www.ann-geophys.net/26/3269/2008/ © European Geosciences Union 2008
Annales
Geophysicae
Survey of ELF-VLF plasma waves in outer radiation belt observed
by Cluster STAFF-SA experiment
D. Pokhotelov1, F. Lefeuvre2, R. B. Horne3, and N. Cornilleau-Wehrlin4,5
1Department of Electronic & Electrical Engineering, University of Bath, BA2 7AY, Bath, UK 2LPCE, 3A Avenue de la Recherche Scientifique, 45071, Orl´eans, France
3British Antarctic Survey, Natural Environment Research Council, CB3 0ET, Cambridge, UK 4CETP/IPSL, 10–12 Avenue de l’Europe, 78140, V´elizy, France
5Station de Radioastronomie de Nanc¸ay, Observatoire de Paris/CNRS, 18330, Nanc¸ay, France
Received: 31 October 2007 – Revised: 16 April 2008 – Accepted: 12 August 2008 – Published: 21 October 2008
Abstract. Various types of plasma waves have profound ef-fects on acceleration and scattering of radiation belt parti-cles. For the purposes of radiation belt modeling it is nec-essary to know statistical distributions of plasma wave pa-rameters. This paper analyzes four years of plasma wave ob-servations in the Earth’s outer radiation belt obtained by the STAFF-SA experiment on board Cluster spacecraft. Statisti-cal distributions of spectral density of different plasma waves observed in ELF-VLF range (chorus, plasmaspheric hiss, magnetosonic waves) are presented as a function of mag-netospheric coordinates and geomagnetic activity indices. Comparison with other spacecraft studies supports some ear-lier conclusions about the distribution of chorus and hiss waves and helps to remove the long-term controversy re-garding the distribution of equatorial magnetosonic waves. This study represents a step towards the development of multi-spacecraft database of plasma wave activity in radia-tion belts.
Keywords. Magnetospheric physics (Energetic particles, precipitating; Plasma waves and instabilities)
1 Introduction
Earth’s radiation belt, where energetic plasma particles are trapped by the DC magnetic field, consists of two major parts known as inner and outer radiation belts. The inner radiation belt represents a relatively stable population of trapped pro-tons and electrons with a density peak at the distance of∼1.8 Correspondence to:D. Pokhotelov
Earth radii (RE). In contrast to the inner belt, the outer
radi-ation belt has a highly variable particle populradi-ation in which mostly electrons are trapped though a substantial component of trapped high-energy (few 100 keV) ions is also present (e.g. Davis and Williamson, 1963). For electron energies above 1 MeV the outer radiation belt peaks at a distance of
∼4RE. The dynamics of the outer radiation belt are
gov-erned by radial transport, acceleration and loss due to wave-particle interactions (e.g. Lyons and Thorne, 1973). Various types of electromagnetic waves that are present in the outer radiation belt can contribute into acceleration and/or pitch angle scattering of particles into the loss cone.
3270 D. Pokhotelov et al.: Survey of ELV-VLF plasma waves presumably located near magnetic equator at the edge of
plasmasphere (e.g. Parrot et al., 2003).
2 Types of electromagnetic waves observed in radiation belts
Various types of plasma waves in the ULF-VLF frequency range can interact with radiation belt particles causing pitch angle diffusion and/or acceleration of trapped particles. A summary of the wave types that can contribute to accelera-tion and loss was given by Horne and Thorne (1998). The current study focuses on plasma waves occurring in the ELF and VLF frequency ranges between proton cyclotron fre-quencyfcH and electron cyclotron frequencyfce. Plasma
waves important for the radiation belt dynamics in this fre-quency range include chorus, plasmaspheric hiss and equa-torial magnetosonic waves.
Chorus emissions are coherent right-hand polarized whistler mode waves observed near and outside the plasma-pause, characterized by discrete structure of the dynamic spectrum (e.g. Russell et al., 1972; Storey et al., 1991; Sazhin and Hayakawa, 1992). Chorus is observed in a frequency band running from 0.1 to 0.8fceand often structured in two
distinct bands: one above and one below 0.5fce (Tsurutani
and Smith, 1977). It has been suggested that the chorus emis-sions play an important role in the rapid electron acceleration during magnetic storms from energies of∼100 keV to above 1 MeV (Horne and Thorne, 1998; Summers et al., 1998). Ex-perimental evidences of storm-time chorus acceleration have been recently presented by Horne et al. (2005).
Plasmaspheric hiss represent broad-band incoherent whistler mode waves mainly confined by the plasmasphere and observed in the frequency range from few hundreds of hertz to∼2 kHz (e.g. Taylor and Gurnett, 1968; Thorne et al., 1973; Cornilleau-Wehrlin et al., 1978). Hiss is believed to be generated inside the plasmasphere in contrast to the cho-rus waves generated outside. Statistical parameters of hiss emissions including the dominant direction of wave vectors have been analyzed by Parrot and Lefeuvre (1986) and San-tol´ık and Parrot (2000). Plasmaspheric hiss is believed to be among the dominant mechanisms of pitch angle scattering for radiation belt electrons (Abel and Thorne, 1998). Son-walkar and Inan (1989) suggested that the plasmaspheric hiss emissions can be triggered by lightning-induced whistlers. Pitch-angle scattering of energetic electrons by plasmas-pheric hiss largely accounts for the formation of the slot re-gion that separates the inner and outer radiation belts (Lyons and Thorne, 1973; Abel and Thorne, 1998; Meredith et al., 2006).
Equatorial magnetosonic waves (often referred as “equato-rial electromagnetic noise”) have been first reported by Rus-sell et al. (1969) and studied in detail by Perraut et al. (1982), Kasahara et al. (1994) and Santol´ık et al. (2004). The mag-netosonic waves are linearly polarized compressional mode
waves usually observed in multiple frequency bands situated near harmonics of local proton gyrofrequency with a cutoff at lower-hybrid frequencyflh=(fcefcH)1/2. These waves are
known to propagate nearly perpendicular to the background magnetic field and appear very close to the magnetic equa-tor. Russell et al. (1970) first suggested that the equatorial magnetosonic emissions may interact with radiation belt par-ticles and recent numerical simulations by Horne et al. (2007) outlined the importance of magnetosonic waves for the rela-tivistic electron acceleration.
3 Cluster STAFF-SA experiment and data selection
Cluster is a constellation of four identical highly ellipti-cal orbit spacecraft launched in July–August 2000. Cluster orbit perigee and apogee are, respectively, 20 000 km and 120 000 km with an orbit inclination of 91◦ and a period of 3426 min. Cluster spacecraft cross the Earth’s magnetic equator nearL=4 covering the large portion of outer radia-tion belts.
The STAFF-SA (Spatio-Temporal Analysis of Field Fluc-tuations – Spectrum Analyzer) experiment (Cornilleau-Wehrlin et al., 1997) includes on-board spectrum analyzer with 27 frequency channels logarithmically spaced between 8.8 Hz and 3.56 kHz. The on-board spectrum analyzer calcu-lates the complete spectral matrix (real and imaginary part) of the three magnetic components measured by the STAFF search coil magnetometer and the two electric field compo-nents from the EFW experiment (Gustafsson et al., 2001) with a time resolution that is generally 1 s. Out of the spec-tral matrix coefficient for this study we will use the magnetic field spectral density. The sensitivity of STAFF search coil magnetometers is 4×10⁻⁴nT/Hz1/2 and 1×10⁻⁵nT/Hz1/2, respectively, at 10 Hz and 1 kHz frequency. In this study care has been taken to exclude the values of spectral density falling below the magnetometer sensitivity curve presented by Cornilleau-Wehrlin et al. (2003).
Current survey includes STAFF-SA data from the first Cluster spacecraft (Rumba) for the period from March 2001 to February 2005. The remaining STAFF-SA data is avail-able at the ESA Cluster Active Archive and can be added to the database in the future. Magnetic coordinates (MLT, MLat anL-shell) of the spacecraft and the local values offcehave
been obtained from the Cluster Predicted Magnetic Position catalogues (Hapgood et al., 1997). In order to study waves that may be relevant to the outer radiation belt we only con-sidered those intervals when spacecraft was situated between
MLT 12
00
18 06
4.0
6.5
9.0 L
log(nT2/Hz) log(nT2/Hz)
4.0 6.5 9.0 L
MLat 0◦ 45◦
-45◦
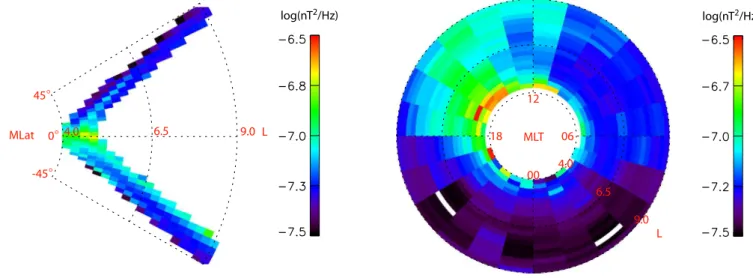
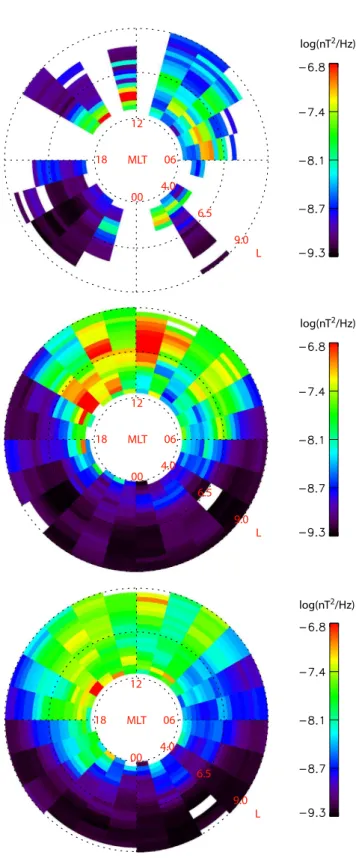
Fig. 1.Distribution of the spectral density in the frequency range 0.0005≤f/fce<0.02 dominated by magnetosonic waves.
4 Distributions of spectral density
4.1 Construction of the database
For the purposes of computing the pitch angle diffusion coef-ficients (e.g. Glauert and Horne, 2005) it is necessary to ex-press the statistical distributions of wave spectral density as a function of magnetic coordinates MLT, MLat andL-shell. In this study the statistical distributions of spectral density have been obtained by logarithmic averaging of all values of spectral density measured within a particular sector in
MLT-L-MLat coordinates.
The dimensions of database sectors are 1 h in MLT, 0.25L
in L-shell values and 2.5◦ in MLat. The distributions in MLT-Lcoordinates (magnetic equator plane) are computed by logarithmic averaging over all MLat sectors, and the dis-tributions in MLat-Lcoordinates (magnetic meridian plane) are obtained by averaging over all MLT sectors.
Since the value of local cyclotron frequency is the mean-ingful parameter for propagation and generation of various plasma waves, it is useful to construct the distributions of spectral density in terms of the normalized frequencyf/fce.
Normalized frequency bands used in this study are shown in Table 1. Taking into account the properties of plasma waves described above we assume that the frequency band 0.0005≤f/fce<0.02 between local fcH and local flh is
dominated by equatorial magnetosonic waves, the frequency band 0.02≤f/fce<0.1 is dominated by plasmaspheric hiss,
the frequency band 0.1≤f/fce<0.5 is dominated by
lower-band chorus, and the lower-band 0.5≤f/fce<1 covers upper-band
chorus waves. This study is limited to the frequency ranges above local proton gyrofrequencyfcH due to the bandwidth
of Cluster STAFF-SA experiment. For the study of lower fre-quency waves one should use the STAFF experiment wave
Table 1.Frequency ranges used in the database.
Frequency range Wave type
0.0005≤f/fce<0.02 Magnetosonic waves
0.02≤f/fce<0.1 Plasmaspheric hiss
0.1≤f/fce<0.5 Lower-band chorus
0.5≤f/fce<1 Upper-band chorus
form data that in the normal mode of operation covers 0.3– 10 Hz frequency range.
4.2 Magnetosonic waves
Statistical distribution of spectral density in the frequency range 0.0005≤f/fce<0.02 dominated by equatorial
magne-tosonic waves is shown in Fig. 1.L-MLT andL-MLat distri-butions in Fig. 1 clearly demonstrate that the spectral density of magnetosonic waves is concentrated within 5–7◦ MLat from the magnetic equator which is consistent with earlier findings (e.g. Andr´e et al., 2002; Santol´ık et al., 2004).
3272 D. Pokhotelov et al.: Survey of ELV-VLF plasma waves
MLT 12
00
18 06
4.0
6.5
9.0 L
log(nT2/Hz) log(nT2/Hz)
4.0 6.5 9.0 L
MLat 0◦ 45◦
-45◦
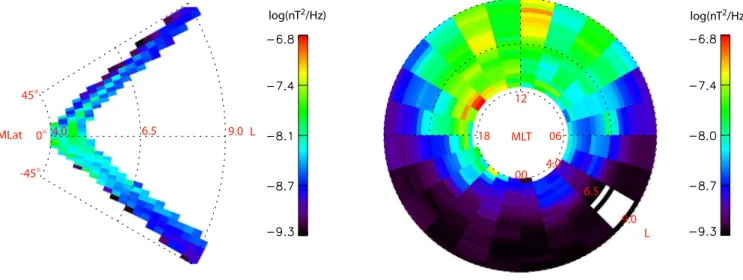
Fig. 2.Distribution of the spectral density in the frequency range 0.02≤f/fce<0.1 dominated by plasmaspheric hiss.
One has to remember that the distributions of spectral density given in this paper represent statistical values aver-aged over time, spatial sector and frequency band. Conse-quently, the statistically averaged values may appear very low comparing to the peak magnitudes of specific plasma wave events reported elsewhere. This is particularly notice-able in the case of equatorial magnetosonic emissions due to the facts that: (1) the intensity of magnetosonic waves changes dramatically with frequency with peak magnitudes typically near 10fcH; and (2) the intensity of magnetosonic
waves falls sharply with latitude. For example, peak magni-tudes of the magnetosonic waves observed by Cluster during specific events can reach∼10−2nT2/Hz (see Fig. 1 in Horne et al., 2007) while statistical averages of the spectral density presented in this paper are lower by a few orders of magni-tude.
4.3 Plasmaspheric hiss
Earlier studies suggested that plasmaspheric hiss appear at all frequencies from 100 Hz up to 2–3 kHz with spectral in-tensity peaking near a few hundred Hz (Thorne et al., 1973; Cornilleau-Wehrlin et al., 1978; Meredith et al., 2004). In this paper we assume plasmaspheric hiss to be dominant in the frequency range above the local flh (0.02fce) and
be-low 0.1fce. These restrictions on hiss frequency band are
imposed to avoid contributions of plasmaspheric hiss into spectral bands of magnetosonic and lower-band chorus emis-sions. As been already noted the hiss frequency band is gen-erally not related to the local gyrofrequency (e.g. Meredith et al., 2004) and while the above definition of hiss band is valid near the equator at L=4.5 where Cluster crosses the equa-tor, at higher latitudes along Cluster orbit hiss emissions can potentially contribute into the spectral bands of other emis-sions. Magnetosonic waves are confined to the equatorial
region and thus potential contribution of hiss into the magne-tosonic band at high latitudes can be easily identified. Con-tribution of hiss into lower-band chorus spectra is likely to be small in most regions since the intensity of hiss falls rapidly above 1 kHz (Meredith et al., 2004). More sensible discrimi-nation between hiss, chorus and magnetosonic emissions can be achieved by analyzing coherency of measured magnetic components (e.g. Cornilleau-Wehrlin et al., 1978; Lefeuvre and Parrot, 1979) but such analysis is beyond the scope of this paper.
Distribution of spectral density in the frequency range 0.02≤f/fce<0.1 is shown in Fig. 2. Hiss emissions appear
in all MLT sectors from 06:00 to 18:00 MLT insideL∼6 with maximum magnitudes in the post-noon sector. Original pa-per by Thorne et al. (1973) suggested that plasmaspheric hiss can be found at all MLT, and few recent studies (e.g. Andr´e et al., 2002; Meredith et al., 2004; Green et al., 2005) have demonstrated that these waves occur primarily on the day side with maximum intensities in the post-noon MLT sec-tor which is consistent with the distributions presented here. Relatively high spectral densities that are seen in Fig. 2 in the noon sector at highL-shells (L>6.5) appear far outside the plasmapause and most likely are caused by lower-band chorus contributing into the hiss band.
4.4 Lower- and upper-band chorus
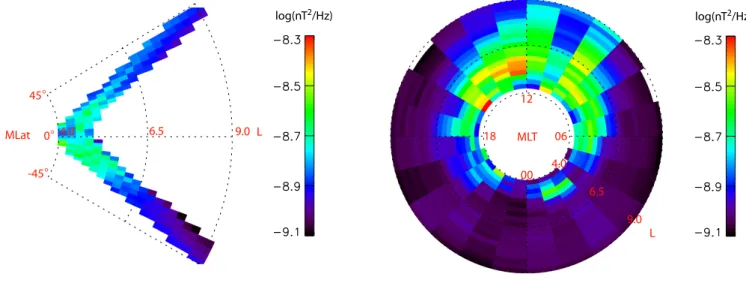
Left- and right-hand panels in Fig. 3 show the distributions of spectral density in MLat-L and MLT-L coordinates, re-spectively, for the frequency range 0.1≤f/fce<0.5 which is
dominated by lower-band chorus.
MLT 12
00
18 06
4.0
6.5
9.0 L
log(nT2/Hz) log(nT2/Hz)
4.0 6.5 9.0 L
MLat 0◦ 45◦
-45◦
Fig. 3.Distribution of the spectral density in the frequency range 0.1≤f/fce<0.5 dominated by lower-band chorus.
away from the magnetic equator. This could be due to the propagation of chorus waves from the generation region in the vicinity of magnetic equator (e.g. LeDocq et al., 1998; Parrot et al., 2003) assuming that the chorus waves are gen-erated mainly outside plasmapause while Cluster crosses the equator inside plasmapause.
The shape of spectral density distribution shown in Fig. 3 resembles the distribution of lower-band chorus derived from CRRES measurements for latitudes MLat>15◦(see Plate 4 in Meredith et al., 2001, or top row in Fig. 6 of Bortnik et al., 2007), while CRRES distributions of lower-band chorus for MLat<15◦(see Plate 3 in Meredith et al., 2001, or bottom row in Fig. 6 of Bortnik et al., 2007) looks substantially dif-ferent. The fact that Cluster results resemble CRRES distri-butions of chorus at higher latitudes but differ from CRRES distributions near the equator is likely to be due to the dif-ference between Cluster high-inclination orbit and CRRES orbit with inclination of 18◦, i.e. Cluster goes too deep into the plasmasphere near its perigee to detect the intense night-side chorus near the equator.
Distribution of spectral density in the frequency range dominated by upper-band chorus (0.5≤f/fce<1) is shown
in Fig. 4. Unfortunately, the frequency range of Cluster STAFF spectrum analyzer allows to scan frequencies above 0.5fceonly at lowL-shells. Thus the spectral distribution in
Fig. 4 only covers upper-band chorus waves occurring within
L∼5.5. The distribution shows the maximum intensity of upper-band chorus in post-midnight and morning MLT sec-tors which is consistent with Meredith et al. (2001) who re-ported the maximum intensity of upper-band chorus in the morning sector.
MLT 12
00
18 06
4.0
6.5
9.0 L
log(nT2/Hz)
Fig. 4. Distribution of the spectral density in the frequency range 0.5≤f/fce<1 dominated by upper-band chorus.
4.5 Dependence on global magnetospheric activity Since few models of radiation belt dynamics (e.g. Bourdarie et al., 1996; Shprits and Thorne, 2004) utilize three-hourKp
index as an indicator of global disturbance in this study we use theKpindex to illustrate the dependance of wave
inten-sity on the global magnetospheric activity, even though other indices could be more relevant to the generation of particu-lar types of plasma waves. Cluster STAFF-SA dataset have been separated into three groups representing high (Kp≥5o),
moderate (3o≤Kp<5o) and low (Kp<3o) levels of
geomag-netic activity.
Dependance of magnetosonic waves
3274 D. Pokhotelov et al.: Survey of ELV-VLF plasma waves
MLT 12
00
18 06
4.0
6.5
9.0 L
log(nT2/Hz)
MLT 12
00
18 06
4.0
6.5
9.0 L
log(nT2/Hz)
MLT 12
00
18 06
4.0
6.5
9.0 L
log(nT2/Hz)
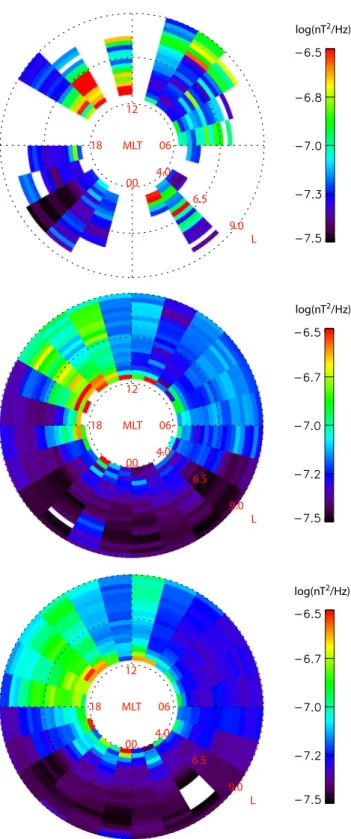
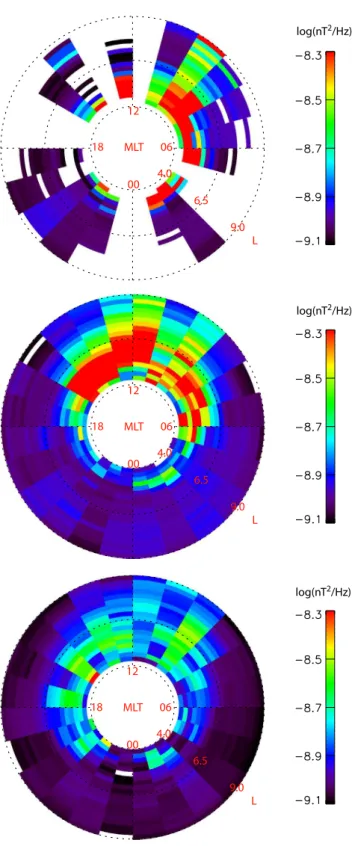
Fig. 5.Distributions of the spectral density in the frequency range 0.0005≤f/fce<0.02 (magnetosonic waves) for differentKp
lev-els. Top, central, and bottom panel corresponds, respectively, to high (Kp≥5o), moderate (3o≤Kp<5o), and low (Kp<3o) levels
of magnetospheric activity.
(0.02≤f/fce<0.1) and lower-band chorus (0.1≤f/fce<0.5)
on global magnetospheric disturbance level is illustrated, respectively, in Figs. 5, 6 and 7. Obviously, the periods of high magnetospheric disturbance have relatively poor data coverage (see top panels in Figs. 5–7).
Lower-band chorus waves in Fig. 7 demonstrate very strong dependance on the magnetospheric activity with the maximum intensity of chorus waves apparently shifting from post-noon to pre-noon/morning MLT sectors as the activity level goes up. It has been suggested that high latitude cho-rus on the dayside could be generated above the magnetic equator in the minimum magnetic field pockets produced by the solar wind compression of the magnetosphere (Tsuru-tani and Smith, 1977). Since chorus wave power becomes more restricted to lowerLwith increasing magnetic activity in Fig. 7, this could be due to a more compressed magne-topause during active conditions which restricts wave gener-ation to lowerL. Ray tracing in a compressed magnetic field needs to be considered to verify this idea.
Plasmaspheric hiss also shows strong dependence on global activity as shown in Fig. 6. While for lowKp(bottom
panel in Fig. 6) hiss shows relatively uniform distribution over 08:0–18:00 MLT sector, for moderateKplevels (central
panel) hiss distribution has clear peak in 13:00–17:00 MLT sector. Similar behavior of plasmaspheric hiss has been ob-served in CRRES data (see Fig. 3 in Meredith et al. (2004)). Apparent reduction of hiss intensity during highly-disturbed periods (Kp≥5o) seen in the top panel of Fig. 6 is probably
due to the fact that during these disturbed periods the plas-masphere gets eroded and thus Cluster perigee lies outside the region dominated by plasmaspheric hiss.
In contrast to hiss and chorus, the intensity of magne-tosonic waves in Fig. 5 shows relatively weak dependance onKp level, with the peak intensity in post-noon MLT
sec-tor. While Kasahara et al. (1994) also reported weak or no dependence on geomagnetic activity for the magnetosonic waves, Andr´e et al. (2002) suggested that the “equatorial noise” was mainly observed during periods of strong mag-netic activity. It has to be noted that the definition of “equa-torial noise” adopted by Andr´e et al. (2002) includes not only magnetosonic waves occurring above localfcH but also
ion-cyclotron waves belowfcH, while Cluster STAFF-SA data
only includes the waves abovefcH.
5 Conclusions
A four year long dataset of Cluster STAFF-SA experi-ment has been processed to create the statistical distri-butions of wave spectral density in the ELF-VLF fre-quency range between local fcH and local fce. The
re-sulting statistical distributions cover four essential frequency ranges: 0.0005≤f/fce<0.02 dominated by equatorial
mag-netosonic waves, 0.02≤f/fce<0.1 dominated by
chorus and 0.5≤f/fce<1 range dominated by upper-band
chorus waves. The use of normalized frequencies for the database construction helps to discriminate chorus waves from plasmaspheric hiss though at high latitudes some am-biguity still remains due to the fact that plasmaspheric hiss appear at wide range of frequencies and not related to the local gyrofrequency. This ambiguity can be resolved either through physical considerations described in Sect. 4.3, or in a more regular way, by performing the coherency analysis of Cluster dataset.
Analysis of statistical distributions in the range 0.0005≤f/fce<0.02 confirms that the magnetosonic
waves are closely confined to the equatorial region within
±5◦MLat. It also outlines the important fact that the equa-torial magnetosonic waves have maximum intensity in the post-noon sector near 14:00–20:00 MLT. Spectral density distributions in the range 0.02≤f/fce<0.1 demonstrate
that plasmaspheric hiss appearing in the regions near the plasmapause (L<6) dominates local time sectors from 06:00 to 18:00 MLT with maximum magnitudes observed in 13:00–17:00 MLT sector. Distributions of spectral density in the range 0.1≤f/fce<0.5 show the presence of chorus
waves in MLT sectors from 05:00 to 18:00 MLT with a maximum intensity in post-noon sector. Lower-band chorus distributions appear to be consistent with the distribution of chorus observed by CRRES spacecraft at latitudes above 15◦ MLat (Meredith et al., 2001). Distribution of spectral density in the range 0.5≤f/fce<1 (only partially covered
by the STAFF spectrum analyzer) shows that the upper-band chorus waves have maximum intensity in post-midnight and morning MLT sectors. Chorus and plasmaspheric hiss show strong dependance on geomagnetic activity while equatorial magnetosonic emissions demonstrate weaker dependence on
Kplevel.
It has been demonstrated that Cluster STAFF-SA experi-ment is capable of extracting some features of the distribu-tions of magnetosonic waves, plasmaspheric hiss and cho-rus that have not been analyzed before (such as MLT dis-tributions of magnetosonic waves and distribution of cho-rus at high latitudes). Spacecraft datasets used to construct the existing wave models have considerable limitations. For instance, due to its orbit configuration the DE-1 spacecraft (Andr´e et al., 2002) provides limited coverage of the radi-ation belt regions outside L∼5 and has coverage gaps in the evening MLT sector. CRRES dataset (Meredith et al., 2001, 2004) only covers the regions inside MLat<30◦ and has relatively poor statistical coverage in pre-noon MLT sec-tor. Also, CRRES instrument is only able to detect waves be-low be-lower-hybrid frequency at be-lowerL-shells and thus is not very suitable for the statistical analysis of equatorial magne-tosonic waves. In contrast, Cluster dataset of four years has nearly uniform coverage in MLT thus providing good statis-tics in the region around the equatorial plasmapause which is important for the generation of chorus and magnetosonic waves. Cluster also extends the coverage to higher latitudes
MLT 12
00
18 06
4.0
6.5
9.0 L
log(nT2/Hz)
MLT 12
00
18 06
4.0
6.5
9.0 L
log(nT2/Hz)
MLT 12
00
18 06
4.0
6.5
9.0 L
log(nT2/Hz)
Fig. 6. Distributions of the spectral density in the frequency range 0.02≤f/fce<0.1 (plasmaspheric hiss) for differentKp
lev-els. Top, central, and bottom panel corresponds, respectively, to high (Kp≥5o), moderate (3o≤Kp<5o), and low (Kp<3o) levels
3276 D. Pokhotelov et al.: Survey of ELV-VLF plasma waves
MLT 12
00
18 06
4.0
6.5
9.0 L
log(nT2/Hz)
MLT 12
00
18 06
4.0
6.5
9.0 L
log(nT2/Hz)
MLT 12
00
18 06
4.0
6.5
9.0 L
log(nT2/Hz)
Fig. 7. Distributions of the spectral density in the frequency range 0.1≤f/fce<0.5 (lower-band chorus) for differentKp
lev-els. Top, central, and bottom panel corresponds, respectively, to high (Kp≥5o), moderate (3o≤Kp<5o), and low (Kp<3o) levels
of magnetospheric activity.
not covered by CRRES and DE-1 thus providing the infor-mation needed to calculate bounce averaged diffusion rates (Glauert and Horne, 2005). On the negative site, Cluster dataset covers narrow range ofL-shells at a given latitude (e.g. Cluster always crosses the equatorial plane atL∼4.5). Taking into account all the limitations it would be benefi-cial to combine the existing databases into unified multi-spacecraft database that would become an operational tool for radiation belt modeling.
Acknowledgements. We are grateful to D. Boscher and S. Bour-darie of ONERA/DESP and to N. P. Meredith of British Antarctic Survey for valuable discussions of various aspects of wave-particle interactions and radiation belt modeling. We are also grateful to the ESA Cluster Active Archive team for making available the dataset of Cluster STAFF-SA experiment. We would like to acknowledge financial support from the UK STFC and from the International Space Science Institute in Bern, Switzerland within the framework of the ISSI Team 89: “On the use of wave field measurements to trace WPI in the plasmasphere and at medium and low latitude iono-sphere”.
Topical Editor I. A. Daglis thanks two anonymous referees for their help in evaluating this paper.
References
Abel, B. and Thorne, R. M.: Electron scattering loss in Earth’s inner magnetosphere – 1. Dominant physical processes, J. Geophys. Res., 103, 2385–2396, 1998.
Andr´e, R., Lefeuvre, F., Simonet, F., and Inan, U. S.: A first ap-proach to model the low-frequency wave activity in the plasmas-phere, Ann. Geophys., 20, 981–996, 2002,
http://www.ann-geophys.net/20/981/2002/.
Bortnik, J., Thorne, R. M., and Meredith, N. P.: Model-ing the propagation characteristics of chorus usModel-ing CRRES suprathermal electron fluxes, J. Geophys. Res., 112, A08204, doi:10.1029/2006JA012237, 2007.
Bourdarie, S., Boscher, D., Beutier, T., Sauvaud, J. A., and Blanc, M.: Magnetic storm modeling in the earth’s electron belt by the Salammbˆo code, J. Geophys. Res., 101, 27 171–27 176, 1996. Cornilleau-Wehrlin, N., Gendrin, R., Lefeuvre, F., Parrot, M.,
Grard, R., Jones, D., Bahnsen, A., Ungstrup, E., and Gibbons, W.: VLF electromagnetic waves observed on-board GEOS-1, Space Sci. Rev., 22, 371–382, 1978.
Cornilleau-Wehrlin, N., Chauveau, P., Louis, S., Meyer, A., Nappa, J. M., Perraut, S., Rezeau, L., Robert, P., Roux, A., de Villedary, C., de Conchy, Y., Friel, l., Harvey, C. C., Hubert, D., Lacombe, C., Manning, R., Wouters, F., Lefeuvre, F., Parrot, M., Pinc¸on, J.-L., Poirier, B., Kofman, W., and Louarn, Ph.: The CLUSTER Spatio-Temporal Analysis of Field Fluctuations (STAFF) Exper-iment, Space Sci. Rev., 79, 107–136, 1997.
Clus-ter STAFF experiment, Ann. Geophys., 21, 437–456, 2003, http://www.ann-geophys.net/21/437/2003/.
Davis, L. R. and Williamson, J. M.: Low-energy trapped protons, Space Res., 3, 365–375, 1963.
Glauert, S. A. and Horne, R. B.: Calculation of pitch angle and energy diffusion coefficients with the PADIE code, J. Geophys. Res., 110, A04206, doi:10.1029/2004JA010851, 2005.
Green, J. L., Boardsen, S., Garcia, L., Taylor, W. W. L., Fung, S. F., and Reinisch, B. W.: On the origin of whistler mode ra-diation in the plasmasphere, J. Geophys. Res., 110, A03201, doi:10.1029/2004JA010495, 2005.
Gustafsson, G., Andr´e, M., Carozzi, T., Eriksson, A. I., F¨althammar, C.-G., Grard, R., Holmgren, G., Holtet, J. A., Ivchenko, N., Karlsson, T., Khotyaintsev, Y., Klimov, S., Laakso, H., Lindqvist, P.-A., Lybekk, B., Marklund, G., Mozer, F., Mur-sula, K., Pedersen, A., Popielawska, B., Savin, S., Stasiewicz, K., Tanskanen, P., Vaivads, A., and Wahlund, J.-E.: First results of electric field and density observations by Cluster EFW based on initial months of operation, Ann. Geophys., 19, 1219–1240, 2001, http://www.ann-geophys.net/19/1219/2001/.
Hapgood, M. A., Dimbylow, T. G., Sutcliffe, D. C., Chaizy, P. A., Ferron, P. S., Hill, P. M., and Tiratay, X. Y.: The Joint Science Operation Centre, Space Sci. Rev., 79, 487–525, 1997.
Horne, R. B. and Thorne, R. M.: Potential waves for relativistic electron scattering and stochastic acceleration during magnetic storms, Geophys. Res. Lett., 25, 3011–3014, 1998.
Horne, R. B., Thorne, R. M., Shprits, Y. Y., Meredith, N. P., Glauert, S. A., Smith, A. J., Kanekal, S. G., Baker, D. N., Engebretson, M. J., Posch, J. L., Spasojevic, M., Inan, U. S., Pickett, J. S., and Decreau, P. M. E.: Wave acceleration of electrons in the Van Allen radiation belts, Nature, 437, 227–230, 2005.
Horne, R. B., Thorne, R. M., Glauert, S. A., Meredith, N. P., Pokhotelov, D., and Santol´ık, O.: Electron acceleration in the Van Allen radiation belts by fast magnetosonic waves, Geophys. Res. Lett., 34, L17107, doi:10.1029/2007GL030267, 2007. Kasahara, Y., Kenmochi, H., and Kimura, I.: Propagation
charac-teristics of the ELF emissions observed by the satellite Akebono in the magnetic equatorial region, Radio Sci., 4, 751–768, 1994. Lyons, L. R. and Thorne, R. M.: Equilibrium structure of radiation
belt electrons, J. Geophys. Res., 78, 2142–2149, 1973.
LeDocq, M. J., Gurnett, D. A., and Hospodarsky, G. B.: Chorus source locations from VLF Poynting flux measurements with the polar spacecraft, Geophys. Res. Lett., 25, 4063–4066, 1998. Lefeuvre, F. and Parrot, M.: The use of the coherence function for
the automatic recognition of chorus and hiss observed by GEOS, J. Atmos. Terr. Phys., 41, 143–152, 1979.
Meredith, N. P., Horne, R. B., and Anderson, R. R.: Substorm de-pendence of chorus amplitudes: Implications for the accelera-tion of electrons to relativistic energies, J. Geophys. Res., 106, 13 165–13 178, 2001.
Meredith, N. P., Horne, R. B., Thorne, R. M., Summers, D., and Anderson, R. R.: Substorm dependence of plasmaspheric hiss, J. Geophys. Res., 109, A06209, doi:10.1029/2004JA010387, 2004.
Meredith, N. P., Horne, R. B., Clilverd, M. A., Horsfall, D., Thorne, R. M., and Anderson, R. R.: Origins of plasmaspheric hiss, J. Geophys. Res., 111, A09217, doi:10.1029/2006JA011707, 2006. Parrot, M. and Lefeuvre, F.: Statistical study of the propagation characteristics of ELF hiss observed on GEOS-1, inside and out-side the plasmasphere, Ann. Geophys., 4, 363–384, 1986, http://www.ann-geophys.net/4/363/1986/.
Parrot, M., Santol´ık, O., Cornilleau-Wehrlin, N., Maksimovic, M., and Harvey, C. C.: Source location of chorus emissions observed by CLUSTER, Ann. Geophys., 21, 473–480, 2003,
http://www.ann-geophys.net/21/473/2003/.
Perraut, S., Roux, A., Robert, P., Gendrin, R., Sauvaud, J.-A., Bosqued, J.-M., Kremser, G., and Korth, A.: A systematic study of ULF waves abovefH+ from GEOS 1 and 2 measurements
and their relationship with proton ring distributions, J. Geophys. Res., 87, 6219–6236, 1982.
Russell, C., Holzer, R., and Smith, E.: OGO 3 observations of ELF noise in the magnetosphere : 1. spatial extent and frequency of occurrence, J. Geophys. Res., 74, 755–777, 1969.
Russell, C., Holzer, R., and Smith, E.: OGO 3 observations of ELF noise in the magnetosphere, 2. the nature of the equatorial noise, J. Geophys. Res., 75, 755–768, 1970.
Russell, C., McPherron, R., and Coleman, P.: Fluctuating magnetic fields in the magnetosphere, I: ELF and VLF fluctuations, Space Sci. Rev., 12, 810–856, 1972.
Santol´ık, O. and Parrot, M.: Application of wave distribution func-tion methods to an ELF hiss event at high latitudes, J. Geophys. Res., 105, 18 885–18 894, 2000.
Santol´ık, O., Nˇemec, F., Gereov´a, K., Mac´uˇsov´a, E., de Conchy, Y., and Cornilleau-Wehrlin, N.: Systematic analysis of equato-rial noise below the lower hybrid frequency, Ann. Geophys., 22, 2587–2595, 2004, http://www.ann-geophys.net/22/2587/2004/. Sazhin, S. S. and Hayakawa, M.: Magnetospheric chorus emissions:
A review, Planet. Space Sci., 40, 681–697, 1992.
Shprits, Y. Y. and Thorne, R. M.: Time dependent radial diffusion modeling of relativistic electrons with realistic loss rates, Geo-phys. Res. Lett., 31, L08805, doi:10.1029/2004GL019591, 2004. Sonwalkar, V. S. and Inan, U. S.: Lightning as an embryonic source
of VLF hiss, J. Geophys. Res., 94, 6986–6994, 1989.
Storey, L. R. O., Lefeuvre, F., Parrot, M., Cair´o, L., and Ander-son, R. R.: Initial survey of the wave distribution function for plasmaspheric hiss observed by ISEE-1, J. Geophys. Res., 96, 19 469–19 489, 1991.
Summers, D., Thorne, R. M., and Xiao, F.: Relativistic theory of wave-particle resonant diffusion with application to electron ac-celeration in the magnetosphere, J. Geophys. Res., 103, 20 487– 20 500, 1998.
Taylor, W. W. L. and Gurnett, D. A.: The morphology of VLF emis-sions observed with the Injun 3 satellite, J. Geophys. Res., 73, 5615–5626, 1968.
Thorne, R. M., Smith, E. J., Burton, R. K., and Holzer, R. E.: Plas-maspheric hiss, J. Geophys. Res., 78, 1581–1596, 1973. Tsurutani, B. T. and Smith, E.: Two types of magnetospheric ELF