2Institut of Physics, Minsk, Belorussia
Received: 18 June 1996 / Revised: 4 December 1996 / Accepted: 6 December 1996
Abstract. A new optical sensor, the airborne Polar Nephelometer, has been tested in an open wind tunnel. The wind tunnel was operated in cloudy conditions including either cloud water droplets or ice crystals, or a mixture of these particles. The sensor is designed to measure the optical and microphysical parameters of cloud particles sized from a few micrometers to about 500 lm diameter. Basically, the probe measures the scattering phase function of an ensemble of cloud particles which intersect a collimated laser beam near the focal point of a paraboloidal mirror. From the measured scattering phase function the retrieval of the droplet-size spectra and subsequent derived quantities such as liquid water content and size parameters can be calculated using an inversion method. The particle phase discrimination (water droplets/ice particles) can be derived from the shape of the scattering phase function and the sensitivity of the probe allows the detection of small ice crystals (typically of 5lm diameter). The paper describes the preliminary results obtained by the proto-type version of the Polar Nephelometer in various cloudy conditions. These results are compared with direct microphysical measurements obtained by usual PMS probes also mounted in the wind tunnel. Comple-mentary results obtained in a cold chamber are pres-ented in order to illustrate the reliability of the Polar Nephelometer in the presence of small ice crystals.
1 Introduction
A considerable increase in our understanding of cloud microphysics was facilitated in the 1970s by the use of the particle measuring system (PMS) airborne optical spectrometers (Knollenberg, 1981). However, improve-ments are still needed to obtain reliable measureimprove-ments of cloud microphysical parameters (see among others, Gayet, 1988) and the study of the interaction between radiation and microphysics strongly needs direct
mea-surements on the scattering properties of ice particles (Kinne et al., 1992).
We have discussed in detail in the companion to this paper (Gayetet al., this issue) the theoretical design of a new optical airborne instrument, the `Polar Nephelo-meter', which provides direct measurement of the scattering phase function of cloud particles. The phase of the particles (droplets and/or ice crystals) can be derived from the recognition shape of the phase function and droplet-size spectra, and subsequent microphysical parameters can be retrieved using the inversion method of Oshchepkov et al.(1993).
The following presents the experimental procedure for the performance evaluation of the prototype of the probe. This procedure consisted in using an open wind tunnel operated in cloudy conditions including either cloud water droplets or ice crystals or a mixture of these particles. The airspeed was about 50 m s)1in the sampling section of the Polar Nephelometer, a value which is close to turboprop aircraft airspeed. Prelimi-nary results obtained by Polar Nephelometer are discussed by comparing with direct microphysical mea-surements from PMS ASSP & 2D-C, probes which were also installed in the wind tunnel. Results obtained in cloud water droplets are discussed, then tests run in mixed conditions (cloud water droplet and ice-crystal particles) are presented. Finally some results obtained in a cold chamber are given in order to illustrate the reliability of the Polar Nephelometer in the presence of small ice crystals.
2 Description of the experimental procedure
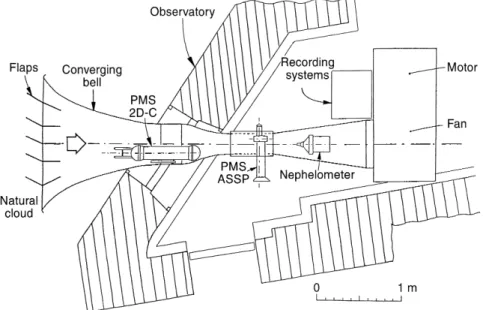
The horizontal wind tunnel is set up at the Observatory of Puy de DoÃme, which is located at the summit of Puy de DoÃme mountain (1465 m MSL) (Personne and Gayet, 1988). Figure 1 displays a sketch of the wind tunnel. Inside the ®rst sampling section of 46.8 ´64.8 cm, a
section (situated downstream) of 23.4´32.4 cm (Gayet
et al., 1995). The Polar Nephelometer was installed in the divergent bell in order to reduce the blockage eects due to the relatively large section of the probe (23 cm diameter). The airspeed can be varied from 5 to 15 m s)1 in the ®rst sampling section, from 20 to 60 m s)1in the second, and from about 15 to 50 m s)1near the sampling section of the Polar Nephelometer, by adjusting the power supply of motor. The convergent entry bell located outside the Observatory (cf. Fig. 1) has an area of 153´159 cm, and ensures a contraction ratio of 8
between the plenum and the ®rst sampling section. Furthermore, the convergent bell mouth contains a grid extended by adjustable ¯aps in order to improve the homogeneity of the sampled clouds when the outside wind is not directed along the wind tunnel axis.
The open wind tunnel was operated when the observatory was surrounded by clouds. During the whole 1994 experiment, which included 11 tests, various meteorological conditions were observed. The outside temperature was most commonly)1°C but only ranged
from)2 to +3°C; the mean values of the cloud liquid
water content and median volume diameter ranged from 0 to 0.4 g m)3, and from 5 to 12 lm, respectively, and mixed conditions (water droplets and ice crystals) were encountered during six tests. Details of the runs expe-rienced with the Polar Nephelometer can be found in Gayetet al.(1994) and CreÂpel (1995).
3 Results obtained in water droplet clouds
3.1 Direct measurements
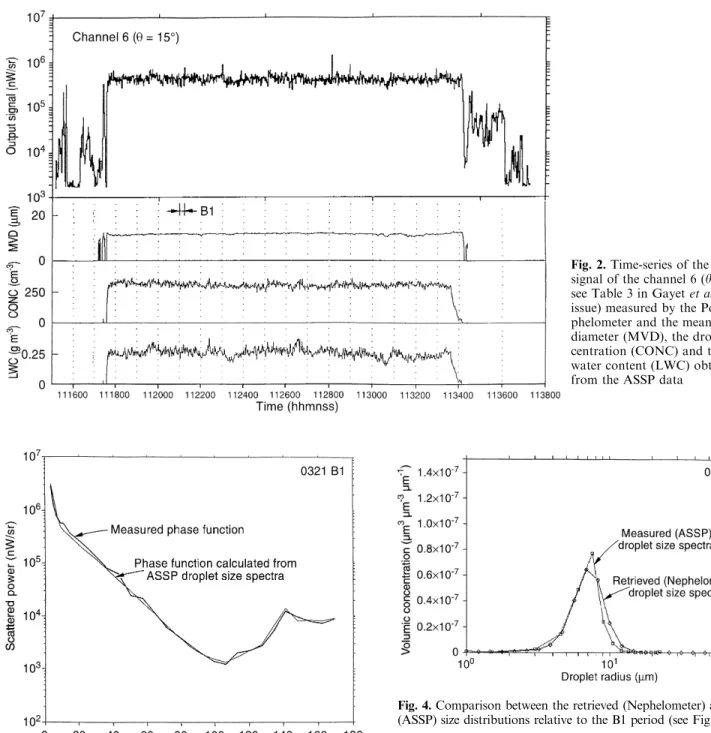
Figure 2 illustrates the results of a test performed in cloud-water-droplet conditions. The outside air temper-ature was close to 0°C and no ice crystals were detected by the 2D-C probe. The ®gure represents a time-series of the output signal of channel 6 (h15, see Table 3 in
Gayetet al., this issue) measured by the Polar Nephelo-meter and the mean volume diaNephelo-meter (MVD), the droplet concentration (CONC) and the liquid water content (LWC) obtained from the ASSP data. Both Nephelometer and ASSP data are averaged over 1 s. Details of the derivation of microphysical parameters from PMS probes and subsequent accuracies can be found in Appendix A. The wind tunnel was started at 11:17:40 and the run lasted 16 min 20 s. The results show that the test was run with very stable cloudy conditions (LWC = 0.25 gm)3, CONC = 300 cm)3 and DVM = 13 lm). In order to highlight the consis-tency of all the Polar Nephelometer channels, the mean scattering phase function (averaged over the 10-s period labelled B1 in Fig. 2) has been plotted in Fig. 3. Superimposed onto this ®gure is the scattering phase function obtained by Mie theory and calculated with the measured ASSP mean droplet spectra, also averaged over the B1 period. The comparison between the two curves shows that the measurement agrees very well with the calculated pattern. In particular, the scattering at forward angles h5 and side angles h100 is correctly measured, indicating that the illuminating beam has been property dumped, and re¯ections of the forward scattered radiation are minimized. Furthermore, the rainbow feature near 140°is correctly measured.
3.2 Retrieved measurements
that the discrepancy between both values of LWC is within 13% and that discrepancies on droplet concen-tration and size parameters are within 7%.
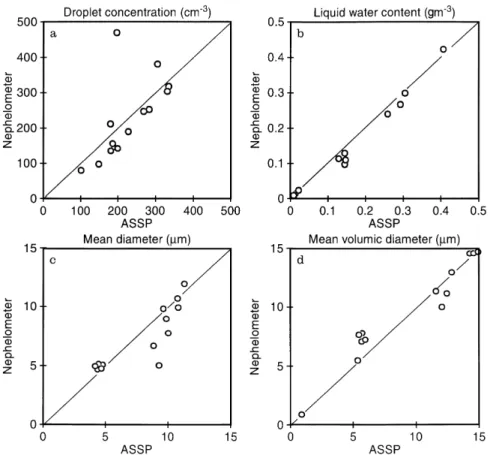
Despite the small number of tests performed in the wind tunnel, the consistency of the results has been con®rmed by extending the range of validation to the available variability of the cloudy conditions experi-enced during the campaign at the Puy de DoÃme moun-tain. Figure 5 displays the retrieved microphysical parameters versus the direct ASSP parameters obtained
for dierent cloudy conditions characterized by cloud water droplets only. The results con®rm that the re-trieved parameters agree well with the direct parameters Fig. 2.Time-series of the output signal of the channel 6 (h15,
see Table 3 in Gayetet al., this issue) measured by the Polar Ne-phelometer and the mean volumic diameter (MVD), the droplet con-centration (CONC) and the liquid water content (LWC) obtained from the ASSP data
Fig. 3. Mean scattering phase function measured by the Polar Nephelometer over the 10-s period labelled B1 in Fig. 2. The scattering phase function obtained by the Mie theory and calculated with the ASSP mean droplet spectra also averaged on the B1 period is also represented
Fig. 4.Comparison between the retrieved (Nephelometer) and direct (ASSP) size distributions relative to the B1 period (see Fig. 2)
Table 1.Comparison between direct and retrieved microphysical parameters (CONC: cloud droplet concentration, LWC: liquid water content, DM: mean diameter, Def: mean eective diameter and DVM: mean volume diameter)
Parameter ASSP Retrieved Relative
values values discrepancies
CONC (cm)3) 290 310 7%
LWC (g m)3) 0.26 0.29 13%
DM (lm) 10.6 10.1 )5%
Def (lm) 11.9 12.6 6%
over the available dynamical ranges (from 0.01 to 0.4 gm)3 for the LWC and from 3 to 15 lm for the mean volume diameter). The LWC and mean volume diameter are particularly well retrieved, whereas dier-ences in the droplet concentration are larger. This is due to the fact that the inversion method gives the results as droplet volumetric size distribution.
3.3 Accuracy and detection threshold
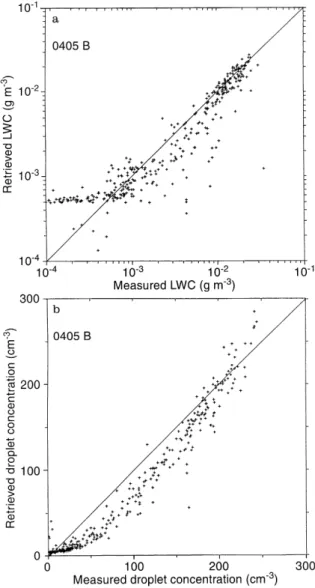
Figure 6 is a scattergram of 1-s-averaged values of retrieved and direct measurements of LWC and droplet concentration. The data are issued from a run per-formed in a thin cloud of water droplets where LWC was not larger than 0.03 gm)3. The results in Fig. 3 highlight a very close agreement between both LWC measurements and suggest that the Polar Nephelometer detection threshold is about 10)3gm)3. Such a value of LWC corresponds to a droplet concentration of about 25 cm)3, that is 5 droplets simultaneously present in the sensitive volume (0.2 cm)3), or 50 droplets correspond-ing to the sum of 10 independant samples (1 s at 10 Hz, see Sect. 3.3 in Gayetet al.,this issue). This result shows that the inversion method can be successfully applied to a sample of at least 50 particles.
The cost function of the inversion algorithm quan-ti®es the root mean square dierence (RMS) between the measured scattering phase function and the scatter-ing phase function relative to the retrieved droplet size distribution. Figure 7 displays the value of the RMS
versus the direct measurement of LWC. The results show that for the lowest values of LWC (<10)3gm)3), RMS is about 80%. RMS obviously decreases for increasing values of LWC (down to about 20% for LWC larger than 10)2 gm)3). This later value must be considered as the sensitivity threshold of the inversion calculation. However, comparison between results in Figs. 6 and 7 shows that LWC is correctly retrieved down to 10)3gm)3.
As for the droplet concentration, the ASSP underes-timates the values for concentration larger than 200 cm)3. This result con®rms the well-identi®ed coin-cidence and dead-time eects on ASSP measurements (Baumgardner et al., 1985).
3.4 Bimodal droplet size distribution
tional comparisons including such conditions should be made in order to test the inversion method over a wider range of microphysical conditions.
4 Results obtained in mixed (water-droplet and ice-particle) clouds
4.1 Evidence of the presence of ice particles from Polar Nephelometer measurements
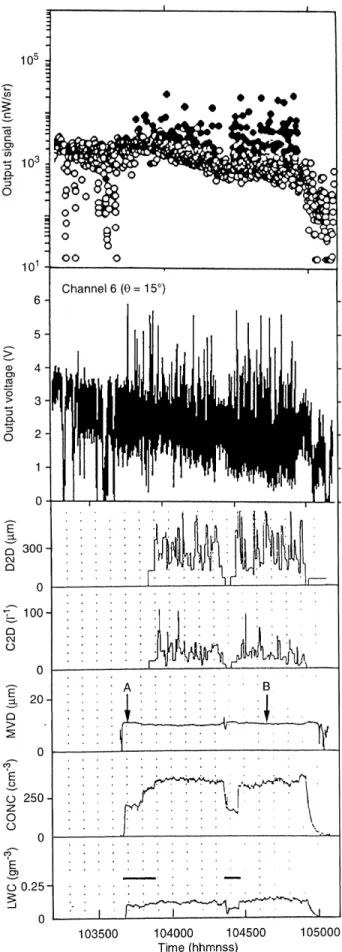
Figure 9 displays the results of a test performed in mixed-cloud conditions with an outside air temperature of)1°C. This ®gure represents a time-series of the raw output signal (10 Hz) of channel 6 h15 measured by the Polar Nephelometer and ASSP parameters (plot-ted at 1 Hz) such as MVD, CONC and the LWC. The ice-particle concentration (C2D) and mean ice-particle size (D2D) obtained from the PMS 2D-C probe (particle size > 25 lm) are also reported in Fig. 9. The plot represented in the upper part of Fig. 9 will be discussed
in Sect. 4.2. The wind tunnel started at 10:36:40 and the run lasted 12 min 30 s. During two periods of the run (10:36:40±10:38:50; 10:43:30±10:44:50) the wind tunnel airspeed was reduced to 25 m s)1(see the corresponding full-line segments in Fig. 9). We now discuss the results Fig. 6a, b.Correspondence between the retrieved and direct
measure-ments (plotted at 1 Hz) of droplet concentration and liquid water content
Fig. 7. Scattergram of RMS versus the ASSP liquid water content (plotted at 1 Hz). RMS is the root mean square dierence between the measured scattering phase function and the scattering phase function relative to the retrieved droplet size distribution
Fig. 8.Retrieved and ASSP measured droplet size distribution relative to cloudy conditions characterized by bimodal droplet size spectra
Table 2.Comparison between direct and retrieved microphysical parameters (CONC: cloud droplet concentration, LWC: liquid water content, DM: mean diameter, Def: mean eective diameter and DVM: mean volume diameter). Results relative to bimodal droplet size distribution
Parameter ASSP Retrieved Relative
values values discrepancies
CONC (cm)3) 180 166
)7%
LWC (g m)3) 0.20 0.20 0%
DM (lm) 9.6 9.9 3%
Def (lm) 14.9 15.1 1%
on periods where the airspeed was set to 50 and 25 m s)1, respectively:
Airspeed set to 50 m s)1:The results show that quasi-stable cloud-water-droplet conditions were experienced during the run. The corresponding LWC, CONC and MVD are 0.1 gm)3, 320 cm)3and 9lm, respectively. In contrast, large ¯uctuations are evidenced both on ice-particle concentration and mean ice-ice-particle size: mean values of about 20 l)1 (maximum 100 l)1) and 120lm (maximum: 500 lm), respectively. Examples of the cor-responding ice-particle images sampled by the 2D-C probe are displayed in Fig. 10. During this period, the Polar Nephelometer output signal is characterized by large ¯uctuations superimposed on to the mean value.
Airspeed set to 25 m s)1: Examination of Fig. 9 indicates that no (or very few) ice particles were sampled by the 2D-C during the periods where the airspeed was set to 25 m s)1(and also during the stopping procedure of the wind tunnel). This indicates that most of the ice particles were too heavy to be drawn into the convergent bell of the wind tunnel. It must be highlighted that during these periods no ¯uctuations are superimposed
Fig. 9. Example of results obtained in mixed conditions. The fol-lowing time-series of parameters are represented: the channel 6
h15calibrated output signal measured by the Polar
Nephelo-meter (theopen circlescorrespond to cloud-water-droplet conditions and thefull circlesdenote the occurrence of ice crystals, see text for explanations), the raw output signal of the channel 6 (plotted at 10 Hz), the mean ice-particle size (D2D) and ice-particle, concentra-tion (C2C) measured by the 2D-C probe (1 Hz) and the mean volume diameter (MVD), droplet concentration (CONC) and liquid water content (LWC) obtained from the ASSP data (1 Hz). The wind tunnel airspeed was set to 50 m s)1except during the periods represented
byfull line segments(in LWC graph) where an airspeed of 25 m s)1
was set
b
on to the mean value of the Polar Nephelometer output signal. This suggests that the Nephelometer may give a typical signature of the presence of ice crystals which are mixed with the water droplets. As a matter of fact, Fig. 11 represents the scattering phase functions (aver-aged over 10 s) sampled at point A (cloud water droplets) and point B (mixed conditions) in Fig. 9. The results clearly evidence that in mixed conditions the resultant scattering phase function is a combination of the respective contributions of the cloud water droplets and ice particles (as indicated by the linear relationship B1, see Appendix B). The resultant phase function is characterized by a side scattering h100 much larger than for the case of cloud water droplets. A typical example of scattering phase function relative to the sampling of ice particles has been added in Fig. 11. Ice particles mostly characterized by irregular shapes have been evidenced from the 2D-C measurements during a test performed at an air temperature of)2°C.
The shape of the corresponding scattering phase func-tion is similar to measured ones relative to ice crystals generated in a cold chamber (Volkovitskyet al., 1980).
4.2 Recognition method of ice-crystal occurrence
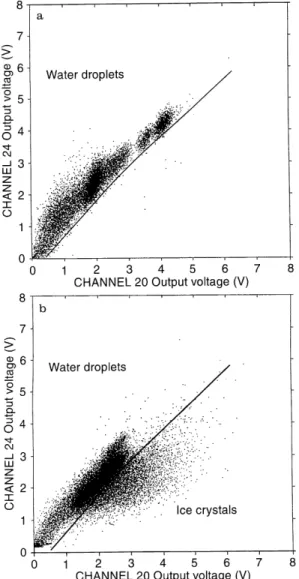
We use the scattering phase function properties already given to propose a recognition method to descriminate the ice particles that may be present in the sensitive volume together with water cloud droplets. The method consists in comparing the values of two channels which correspond respectively to 141° (channel 24, rainbow angle) and 113°(channel 20, side scattering). Figure 12a and b represents the outputs of these two channels (24 versus 20) for water droplet conditions (also including hydrometeor drops) and mixed conditions (water drop-lets and ice crystals), respectively. From Fig. 12a, the scattergram of the measurement points relative to water
droplet conditions de®nes a speci®c domain which is represented by a thick line in Fig. 12. Outside this domain (see Fig. 12b) the measurement points reveal the occurrence of ice particles (the 110°angles are relatively more illuminated than the 140°angles). The method was applied to several tests and results are illustrated by the upper curve in Fig. 9. This curve displays the calibrated output signal of channel 6 which is represented either by open circles or full circles depending on the cloud conditions (water droplets only or ice crystals mixed with water droplets, respectively). It can be seen that the occurrence of measurement points identi®ed as ice particles agrees with the periods where ice crystals are detected by the 2D-C probe.
4.3 ASSP size spectrum
We have shown that in mixed conditions, the measure-ment points attributed to ice particles can be evidenced. Fig. 11.Scattering phase functions (averaged over 10 s) sampled at
point A (cloud water droplets) and point B (mixed conditions) in Fig. 9. Typical scattering phase function measured in ice-crystal conditions is also reported
Fig. 12a, b.Scattergram of output of channel 24 h141 versus output of channel 20 h113for:awater droplets conditions (also
Consequently, they can easily be removed from the data set and the remaining scattering phase function may be attributed to cloud droplets alone. An example of such a retrieved size spectrum is shown in Fig. 13 with the ASSP size spectrum measured in the same time-interval. The results show a quite good agreement between both spectra up to a radius of 12 lm. For larger radii, the measured ASSP spectrum exhibits a second mode (about 15 lm) which is an artefact that could be due to the presence of ice crystals, as shown by Gardiner and Hallett (1985). Table 3 summarizes the comparisons between the direct and retrieved microphysical param-eters. The results show that the ASSP parameters are strongly overestimated (up to 32%) except for the particle concentration, which is underestimated. Conse-quently the retrieved parameters obtained from the corrected phase function appear much more reliable than the parameters measured by the ASSP used alone without more complementary information such as 2D-C data.
4.4 Results obtained in a cold chamber
In order to illustrate the reliability of the Polar Nephelometer in presence of small ice crystals, we
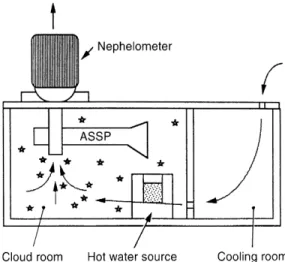
discuss now results obtained in a cold chamber. Figure 14 displays a sketch of the apparatus. The cold chamber consists of a freezer in which the temperature can be lowered to about )30 °C near the ¯oor. Inside
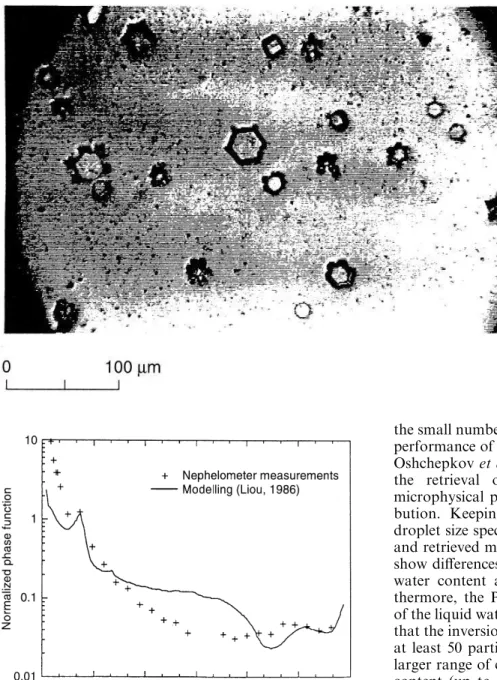
the cold chamber, the ASSP probe has been mounted and the Polar Nephelometer was installed with a special inlet on the roof of the chamber. An aspirator installed at the rear of the Polar Nephelometer provides the air circulation which is ®rst cooled in the cooling room. The cold air then reaches the cloud room and is sucked into the probe inlets. The experimental procedure is to put a source of hot water in the cloud room. This induces the condensation of water droplets which are monitored with the ASSP measurements. The hot-water source is then removed and the water droplet cloud is seeded by silver iodide nuclei which provokes a rapid glaciation of the cloud by Findeisen-Bergeron eect. At the same time the Polar Nephelometer is operated and the measure-ments are recorded at 10 Hz. The size and shape of the produced ice crystals are measured by capture on slides coated with a solution of Formvar plastic in chloroform. Then, photographs of the slides are taken. Figure 15 gives an example of such a slide photograph which exhibits the presence of hexagonal ice crystals with a mean size of 20±30 lm. The smallest particles sampled at the beginning of the seeding were about 5 lm diam-eter. Figure 16 displays a typical example of the scattering phase function measured during the sampling of ice crystals. The results evidence the 22°halo which
characterizes the scattering phase function of hexagonal ice crystals as theoretically displayed in Fig. 16 (Liou, 1986). Compared to the theoretical curve, the measured phase function exhibits a halo which is less pronounced and a lower scattering near the forward and side di-rections, respectively. Several explanations can be hypothesized to explain these dierences:
(i) the model uses a random orientation of the particles while the experimental procedure may induce a preferential orientation (not monitored) of the crystals when they reach the probe inlets; Fig. 13.Retrieved and direct ASSP droplet size distribution relative to
a run characterized by mixed conditions
Table 3.Comparison between direct and retrieved microphysical parameters (CONC: cloud droplet concentration, LWC: liquid water content, DM: mean diameter, Def: mean eective diameter and DVM: mean volume diameter). Results relative to mixed conditions
Parameter ASSP Retrieved Relative
values values discrepancies
CONC (cm)3) 158 248 58%
LWC (g m)3) 0.15 0.11
)27%
DM (lm) 10.5 7.1 )32%
Def (lm) 18.7 15.8 )15%
DVM (lm) 12.3 11.9 ) 4%
(ii) the ice crystals may have some surface roughness and heterogeneous internal structure which modi-®es the scattering pattern;
(iii) the original ice-crystal shape may be modi®ed in the cloud room due to a large temperature gradient between the chamber ¯oor and the probe inlets.
5 Conclusions
This paper describes the results obtained by the prototype of the Polar Nephelometer in real cloudy conditions from open wind tunnel operations. Despite
the small number of tests, the results clearly evidence the performance of the new probe. The inversion method of Oshchepkov et al. (1993) has been successfully used for the retrieval of the droplet size distribution and microphysical parameters, even for bimodal size distri-bution. Keeping in mind the uncertainties of ASSP droplet size spectra, the comparisons between the direct and retrieved microphysical parameters are reliable and show dierences lower than 15% and 5% on the liquid water content and size parameters, respectively. Fur-thermore, the Polar Nephelometer detection threshold of the liquid water content is around 10)3gm)3, showing that the inversion method can be applied for a sample of at least 50 particles. The results must be extended to a larger range of conditions of use, like large liquid water content (up to 5 gm)3 for example), big drops (up to 1 mm diameter).
The results also show that the Polar Nephelometer measurements present a typical signature in the presence of ice crystals. A method of recognition of ice-crystal occurrence has been developed and successfully com-pared to direct measurements of ice crystals. In mixed conditions (water droplets and ice crystals), this method is an attempt to suppress the contribution of the ice particles in the resultant scattering phase function and then to retrieve the cloud-water-droplet parameters.
Results obtained in a cold chamber have shown that the Polar Nephelometer can detect small ice crystals (at least 5 lm diameter) and that the measured phase function relative to hexagonal ice crystals evidences the 22°halo.
The results remain preliminary, and the new airborne probe actually under development must be operated in real cloudy conditions including a wide range of temperature and airspeed compatible with jet aircraft (200 m s)1).
Fig. 15.Photograph of ice crystals collected on Formar coated slides in the cold chamber
concentration (CONC), liquid water content (LWC), mean particle diameter (DM) and eective diameter (Def) are all inferred from the PMS ASSP. Thus the parameters are obtained with the following relations:
CONCRNi ; A.1
LWCp=6qRNiD3i ; A.2
DMRNiDi=RNi ; A.3
DefRNiD3i=RNiD2i ; A.4
with Ni the ASSP concentration of particle having a
mean diameterDi,q the liquid water density.
2 Accuracy of the measurements
Wet wind tunnel tests have been carried out for calibrations of the ASSP probe (Gayet, 1986). The results have shown that for an airspeed of around 50 m s)1, droplet concentration lower than 300 cm)3 and liquid water content lower than 0.3 gm)3, the accuracy of measurements of the parameters may be evaluated to be within 30%. This value is therefore in accordance with the results of Baumgardner (1983), who analysed and compared ®ve water-droplet measuring instruments. These results suggest that absolute micro-physical measurements cannot accurately be obtained from usual PMS probes even when using the most recent versions (Baumgardner et al., 1985). Nevertheless, the relative ¯uctuations of these parameters probably re¯ect the actual cloud characteristics.
3 Method of 2D-C data processing
The method of 2D-C data processing used in this study provides the size spectrum distributed over 30 channels, each having a 25-lm resolution (25±750-lm size range), at 1 Hz frequency. The primary sizing parameter used for all particle images is the mean diameter, that is, the mean value of the image dimensions measured parallel and perpendicular to the orientation of the photodiode array. The sampling volume is the product of the sampling area, the sampling time, and the true airspeed.
Appendix B. The inversion method for retrieving microphysical parameters
For particles described by a size distribution n R, the scattered intensity in the polar directionhis given by the linear superposition of the pattern from each droplet, that is:
u h
Z1
0
K R;hn RdR ; B.1
where K R;h is the angular scattering cross-section corresponding to a single particle of radius R. This assumption is valid if these two conditions hold:
(i) there is no multiple scattering; this assumption is valid to nearly 50% extinction of the incident beam (Blythet al., 1984);
(ii) there are no interference eects between contribu-tion from each particles.
In the case of the Polar Nephelometer, Eq. (B.1) can be approximated by:
ujX
n
i1
Kj;iN Ri 9
> > > ;
j1;2;...;m
; B.2
wheremis the number of measurement angles andnthe number of sought parameters. The inversion problem yields in the resolution of the overdetermined system, Kj;i m>nbeing calculated with Mie theory for
spher-ical particles.
The inversion method used for droplet-size spectra retrieval was developed by Oshchepkov et al. (1993). This method was developed in scope of the statistical estimation theory. Thus, two kind of constraints are considered:
(i) the ®rst constraint is to produce non-negative values for bothn Rand u h;
(ii) the second constraint is to take into account the large dynamic range of the measurement (about 4 orders of magnitude, see Gayetet al., this issue).
In elaborating the method, an original double iterat-ing process is used. It combines the iteratiterat-ing procedure of searching of solutions and K-matrix inversion. Sim-ilar procedures are very eective when used in non-linear methods.
Since the scattering cross-sectionK R;qisr2 -depen-dent, Eq. (B.1) can be expressed as
u h
Z 1
0
pb R;hR3n RdlnR ; B.3
where b R;q is the dimensionless scattering eciency factor. Thus, the inversion calculation is made on vol-ume size distribution and the modules ofRi are equally
log-spaced.
References
Baumgardner, D., An analysis of ®ve water droplet measuring instruments,J. Clim. Appl. Meteorol.,22,891±910, 1983. Baumgardner, D., W. Strapp, and J. E. Dye, Evaluation of the
Forward Scattering Spectrometer Probe. Part II: Corrections for coincidence and dead-time losses,J. Atmos. Ocean. Tech.,2, 626±632, 1985.
Bayvel, L. P., and A. R. Jones,Electromagnetic scattering and its applications, Applied Science Publishers, N.J., 1981.
Blyth, A. M., A. M. I. Chittenden, and J. Latham,An optical device for the measurement of liquid water content in cloud,Q. J. R. Meteorol. Soc.,110,53±63, 1984.
Chanine, M. T., Determination of temperature pro®le in an atmosphere from outgoing radiance, JOSA 1968, 12, 1634± 1637, 1968.
CreÂpel, O., Conception et mise en oeuvre d'un NeÂpheÂlomeÁtre polaire pour la mesure des parameÁtres optiques et microphy-siques des nuages,Ph. D. Universite Blaise Pascal, pp. 194, 1995. Gardiner, B. A., and J. Hallett,Degradation of in-cloud Forward Scattering Spectrometer Probe measurements in presence of ice crystals,J. Atmos. Ocean. Tech.,2,171±180, 1985.
This issue
Heyms®eld, A., and D. Baumgardner,Summary of a workshop on processing 2-D probe data,Bull. Am. Meteorol. Soc.,66,437± 440, 1985.
Heyms®eld, A., and J. Parrish, A computational technique for increasing the eective sampling volume of the PMS Two-Dimensional particle size spectrometer,J. Appl. Meteorol.,17, 1566±1572, 1978.
Kinne, S., T. P. Ackerman, A. J. Heyms®eld, F. P. J. Valero, K. Sassen, and J. D. Spinhirne,Cirrus microphysics and radiative transfer: Cloud ®eld study on 28 October 1986,Mon. Weather Rev.,20,661±684, 1992.
Knollenberg, R. G.,Techniques for probing cloud microstructure, inClouds, Their formation, Optical properties and Eects, Eds. P. V. Hobbs, A. Deepak, Academic Press, New York, pp. 15± 92, 1981.
Liou, K. N., In¯uence of cirrus clouds on weather and climate processes: A global perspective.Mon. Weather Rev.,114,1167± 1199, 1986.
Oshchepkov, S. L., O. V. Dubovik, and T. V. Lapyonok,A method of numerical solution of line-inverse problem with log-normal noise distribution: the estimation of aerosol size distribution,
IRS-92 Current Problems in Atmospheric Radiation, Deepak, Hampton, Va., 334±337, 1993.
Personne, P., and J-F Gayet,Ice accretion on wires and anti-icing by Joule eect,J. Appl. Meteorol.,27,101±114, 1988. Phillips, B. L., A technique for the numerical solution of certain
integral equations of the ®rst kind,J. Assoc. Comp. Mach,9, 84±97, 1962.
Trakhovsky, E., and E. D. Settle,Improved inversion procedure for the retrieval of aerosol size distributions using aureole mea-surements,JOSA,2,2054±2061, 1985.
Twomey, S., On the numerical solution of Fredholm integral equations of the ®rst kind by inversion of the linear system produced by quadrature, J. Assoc. Comp. Mach, 10, 97±101, 1963.