1 - Department of Sports Sciences, University of Beira Interior, Portugal.
2 - Research Center for Sport, Health and Human Development (CIDESD), Portugal. 3 - Sports Sciences School of Rio Maior, Polytechnique Institute of Santarém, Portugal. 4 - School of Healthcare, Setúbal Polytechnic Institute, Portugal.
5 - CICS-UBI Health Sciences Investigation Center, University of Beira Interior.
6 - Lisbon University, Faculty of Human Kinetics, Neuromechanics Research Group- Interdisciplinary Centre for Study of Human
Performance (CIPER), LBMDF, Portugal. .
Determination of Aerobic Power Through a Specific Test
for Taekwondo ‐ A Predictive Equation Model
by
Fernando P.S. Rocha
1,2; Hugo Louro
2,3; Ricardo Matias
4,6; João Brito
2,3;
Aldo M. Costa
1,2,5Our aim was to verify the concurrent validity of a maximal taekwondo specific test (TST) to predict VO2max through an explanatory model. Seventeen elite male taekwondo athletes (age: 17.59 ± 4.34 years; body height: 1.72 ± 6.5 m; body mass: 61.3 ± 8.7 kg) performed two graded maximal exercise tests on different days: a 20 m multistage shuttle run test (SRT) and an incremental TST. We recorded test time, VO2max, ventilation, a heart rate and time to exhaustion. Significant differences were found between observed and estimated VO2max values [F (2, 16) = 5.77, p < 0.01]; post-hoc subgroup analysis revealed the existence of significant differences (p = 0.04) between the estimated VO2max value in the SRT and the observed value recorded in the TST (58.4 ± 6.4 ml/kg/min and 52.6 ± 5.2 ml/kg/min, respectively). Our analysis also revealed a moderate correlation between both testing protocols regarding VO2max (r = 0.70; p = 0.005), test time (r = 0.77; p = 0.02) and ventilation (r = 0.69; p = 0.03). There was no proportional bias in the mean difference (t = -1.04; p = 0.313), and there was a level of agreement between both tests. An equation/model was used to estimate VO2max during the TST based on the mean heart rate, test time, body height and mass, which explained 74.3% of the observed VO2max variability. A moderate correlation was found between the observed and predicted VO2max values in the taekwondo TST (r = 0.74, p = 0.001). Our results suggest that an incremental specific test estimates VO2max of elite taekwondo athletes with acceptable concurrent validity.
Key words: aerobic assessment; martial arts; mechanical specificity; validity.
Introduction
Taekwondo has emerged as an international martial art of self-defence that uses mainly hands and feet for both defence and attack. As a sport, in terms of temporal structure, the match/fight lasts for three rounds of two minutes with one minute rest period between each round. Like most combat sports, it is characterized as an acyclic intermittent activity,
where short and intense movement bouts (moments of fighting) alternate with low intensity periods (pauses) (Matsushigue et al., 2009; Nunan, 2006).
Although different post-match blood lactate concentrations can be found in the literature on this sports discipline (due to different types of competition), a glycolytic
metabolism is unlikely to be the predominant energy source during competition (Nunan, 2006). In fact, MedØ and Tabata (1989) indicated that the contribution of energy from aerobic pathways was as high as 40% during a 30 s maximal workout and 50% during 1 min of maximal work. Elite taekwondo athletes show an average ratio between the duration of exercise and rest ranging from 1:3 to 1:4 in both male and female athletes (Heller et al., 1998). In national and international level athletes, it is estimated that actions are intense for 3-5 s before periods of low intensity, causing heart rate (HR) responses near maximum effort (99% maximum HR) and blood lactate concentrations close to 11.4 mmol•L-1 and 10.2 mmol•L-1, respectively (Bridge et al., 2009).
These assumptions support the fact that high demands are placed upon both the aerobic and anaerobic metabolism during taekwondo matches. Muscle power produced in a fight does not depend on aerobic capacity, however, aerobic capacity becomes essential in the intervals of rounds, or even in a combat, when athletes perform more than once during a competition day, and to aid the recovery process, particularly in the removal of lactic acid. Glaister et al. (2006) found that in 20 sets of 5 s of high intensity exercise with rest intervals between sets lasting 10-30 s, the aerobic system was required for recovery and was also involved in ATP resynthesis. According to Nunan (2006), this suggests that even for activities considered anaerobic in nature, there is significant involvement of the aerobic system in energy production.
In this sense, coaches should structure taekwondo training sessions based not only on the technical and tactical needs of athletes, but also in a manner that enables sufficient cardiovascular conditioning for competition (Bridge et al., 2007). Some authors have already reported quite high VO2max values in national and international level taekwondo athletes that ranged between 44.0 and 55.8 ml/kg/min (Thompson and Vinueza, 1991; Pieter, 1991). In a study conducted by Heller et al. (1998), average VO2max was 57.0 and 53.8 ml/kg/min for Spanish and Czech international taekwondo athletes, respectively. Cooke et al. (1997) stated that athletes with VO2max close to 55.0 and 65.0 ml/kg/min (women and men, respectively) were
in a better position to win an Olympic medal. These authors recommended intensive aerobic training to optimize athletes’ aerobic conditioning, using VO2max as an indicator of cardiovascular fitness and aerobic endurance.
However, this presents a major challenge as in order to measure oxygen uptake or improve aerobic fitness in taekwondo athletes, specific types of assessments and workouts are required. The literature offers several laboratory tests to assess VO2max using cycle ergometers or treadmills. None of these modes of exercise reproduces technical movements of this martial art, so as to develop a closer representation of the fitness/training status of the athletes (Bridge et al., 2014). The same inconsistency seems applicable to running field tests. To our knowledge, only one study (Sant´Ana et al., 2009) intended to assess physiological responses of taekwondo athletes using a specific testing protocol by performing the Bandal Chagui technique, the most commonly used kick during competition (Lee, 1996). However, this study did not estimate VO2max and only sought to predict the anaerobic threshold from the HR deflection point.
The main purpose of this study was to verify the concurrent validity of a maximal taekwondo specific test to predict VO2max. To this end, we compared the acute metabolic responses of elite taekwondo athletes when performing a 20 m multistage shuttle run test (SRT) (Léger and Lambert, 1982; Léger et al., 1988) and a taekwondo specific test (TST). Additionally, we performed an explanatory model of VO2 uptake (during the TST) associated with a predictive equation.
Material and Methods
Participants
A convenience sample of 17 elite male athletes (age 17.59 ± 4.34 years; body height 1.72 m ± 0.07 m; body mass 61.3 kg ± 8.7 kg) recruited from the taekwondo Portuguese national team was used in this exploratory research. According to the characterization survey, all subjects were high-level junior and senior taekwondo athletes with more than 5 years of experience (black belts) that trained 8.7 ± 1.4 sessions per week. The athlete’s federal license was also verified to attest the absence of any impediment to the practice of taekwondo.
The athletes were invited for two consecutive internship weekends for testing. This period coincided with the competitive phase of the season to ensure that all athletes would be in a state of good overall performance.
All subjects and their parents (for those under 18-years-old) were informed in advance about the procedures of the study and asked to sign a term of consent that had been approved by the University of Beira Interior, Portugal; the study was carried out according to the Declaration of Helsinki.
Measures
Anthropometric measures
The anthropometric assessment was carried out according to the International Working Group of Kinanthropometry methodology (Ross and Marfell-Jones, 1991). To evaluate body height (m), a stadiometer (SECA, model 225, Hamburg, Germany) with a range scale of 0.10 cm was used. Body mass and body fat were assessed using a Tanita body composition analyser (model TBF-200, Tanita Corporation of America, Inc. Arlington Heights, IL). These variables were assessed prior to any physical performance test. Subjects were tested barefoot while wearing shorts and t-shirts.
Assessment of maximal aerobic power
The SRT, a popular field test, was used as a predictor of aerobic power (Léger and Lambert, 1982). The test, as described by Léger et al. (1988), involved running between two lines set 20 m apart. The pace was dictated by emitting recorded tones at prescribed intervals. The initial running velocity was 8.5 km·h-1 for the first minute, which
increased by 0.5 km·h-1 every minute thereafter.
The individual test score was established according to the number of 20 m shuttle runs completed before reaching volitional exhaustion or failure to be within 3 m of the end lines on two consecutive tones. The Léger prediction equation from Léger et al. (1988) was used for the indirect calculation of VO2max.
The athletes were also submitted to a progressive TST (Sant´Ana et al., 2009) of approximately 15 min long, starting with a frequency of 6 Bandal Chagui techniques during the first 100 s. The time between following techniques was constant at each stage; as it progressed to the next stage, this interval became shorter; an additional increment of four
techniques on each new stage occurred and a steady decline over time in the following stages.
According to Sant’Ana et al. (2009), during the course of the exercise protocol, the athletes should be “stepping”, and the techniques should be performed alternately (lower limbs) starting with the right leg (the left leg forward at the start of the test). Each kick was executed at a predefined individual height (between the navel and nipples, previously marked in the strike bag). As suggested by the authors, the following criteria were also used to determine the end of the test: (i) the subject failed to track the frequency of kicks (determined by a beep); (ii) the subject did not reach the previously stipulated height; (iii) voluntary exhaustion. Additionally, an extra criterion was applied, i.e. a decrease in kicking force to less than 60% of the maximum previously recorded value. Thus, the athletes’ muscle force was formerly evaluated by performing the Bandal
Chagui technique on the bag with a strike shield
(Mega-Strike, IMPTEC, United Kingdom). A single piezo sensor (LDT4-028K/L, Measurement Specialties Incorporation) located in the centre of the shield was used to assess the Bandal Chagui absolute force expressed in units ranging between 0 and 255. Subjects were encouraged to exert their maximal force in three trials. The rest intervals between the consecutive measurements lasted 3 min.
In both the SRT and TST protocols, the ventilatory pattern [(VO2max, expiratory ventilation
(VE), time to exhaustion (TE), time to achieve VO2max, respiratory quotient (RQ)] was assessed
with a portable gas analyser device (Cosmed® K4b2, Roma, Italy) (Duffield et al., 2004). The expired gases were collected breath-by-breath and then averaged for 15 s intervals (Aisbett and Rossignol, 2003). Subsequently, the average values for each minute were calculated (McCann and Adams, 2002). Time delay and the reference air calibration of the device was performed before each test using a gas sample with 16% O2
concentration and 5% CO2 concentration. The
flow meter was also calibrated before each test with a 3000 ml syringe according to the manufacturer’s recommendation. The HR was continuously monitored (Polar T31 codedTM
transmitter). The criteria for establishing peak VO2max adopted from Howley et al. (1995) were as
the estimated maximum HR (220-age) attained during the test and no VO2 increase in the last
minute of the test.
Procedures
In the 48 hours before testing, subjects were instructed to refrain from any physical activity. Prior to baseline tests, each subject was familiarized with all testing procedures. During this familiarization session, all athletes were counselled on proper exercise technique, as well as stretching and an appropriate warm up.
During the first testing weekend, data collection started with anthropometric measurements, followed by the evaluation of absolute force (leg strikes in the boxing bag) just after 10 min of a specific warm up. Approximately 60 min later, all athletes performed the SRT (Léger and Lambert, 1982) with direct metabolic measurement by means of the Cosmed K4b2
system (Rome, Italy)
On the second testing weekend, all athletes performed the TST just after 10 min of a specific warm up with the applied Cosmed K4b2
system. The test basically consisted of performing a turning kick in a strike bag with a force sensor at a gradual pace over the following protocol levels indicated by means of a sound stimulus or a "beep".
All tests were conducted in an indoor sports facility (temperature 19-21ºC) by two experienced sports science researchers.
Statistical Analysis
All data were analysed using SPSS 20.0 (Chicago, IL). Standard statistical methods were used for the calculation of means and standard deviations. The Kolmogorov-Smirnov test was used to verify the normal distribution of variables.
Pearson and Spearman (for HR from VO2max TST, RQ and SRT) product-moment
correlation coefficients were used to verify the association between dependent (VO2 uptake) and
independent variables (HR, kick absolute power measured in units, total number of executed techniques and test duration) and also between common variables measured during the TST and the SRT with direct metabolic measurements (time to achieve VO2max; HR at VO2max; test
duration, maximum HR; RQ and VE). A t-test for paired measures was applied to compare the mean values obtained in both testing conditions (SRT and TST).
The Levene's test was used to assess variance homogeneity. The coefficient of variation
(represented by the mean squared error as a
percentage of the overall mean) was also
calculated to compare the degree of variation
between both testing protocolsusing the ANOVA
Levene's F test to verify the existence of differences.
We also constructed a 95% confidence interval for the observed VO2max. The extent to
which the TST and SRT produced the same VO2max
values, by means of the strength of relation as well as the extent of agreement, was examined by the Bland-Altman graphics using linear regression analysis to verify if there was a significant bias.
A one-way repeated measures ANOVA was also used to assess any differences among the observed and estimated VO2max values and also to
detect differences among the Bandal Chagui absolute power over the ten stages of the TST. The Tukey’s test was used for post-hoc analysis when the F-ratio was significant. To establish statistical significance, a p≤0.05 criterion was used.
IBM Amos v20 software was used to apply structural equation modeling (SEM) in the univariate multiple regression models adjusted for obtaining maximum VO2 uptake in the TST.
The existence of outliers was assessed by the square Mahalanobis distance (D2) and the
normality of variables was assessed by asymmetry coefficients (Sk) and kurtosis (Ku) uni- and multivariate analysis. No variable had values of Sk and ku that indicated a severe violation of the normal distribution [|Sk|<3 and |Ku| <10].
Results
Table 1 shows the results (mean values ± standard deviation) for all recorded variables in both testing protocols. One can note significant differences between both tests concerning the time to achieve VO2max (p = 0.03).
Our analysis also revealed a moderate correlation between both testing protocols regarding VO2max (r = 0.70; p = 0.005), test time (r =
0.77; p = 0.02) and VE (r = 0.69; p = 0.03).
The TST and SRT coefficients of variation (CV) were 9.9% and 11.0%, respectively. Through the ANOVA Levene´s F test, no significant differences were found in the CV (F = 0.17; p = 0.72).
observed for VO2 uptake through the TST was
between 55.3 and 61.5 ml/kg/min. The point estimate was 58.4 ml/kg/min, with a margin of error of 3.1 ml/kg/min.
There were significant differences between the observed and estimated VO2max
values [F(2,16) = 5.77, p < 0.01]; post-hoc subgroup analysis revealed the existence of significant differences (p = 0.04) between the estimated VO2max value in the SRT (52.6 ± 5.2 ml/kg/min) and
the observed value recorded in the TST (58.4 ± 6.4 ml/kg/min). No significant differences were found between the predicted and observed VO2max
values in the SRT.
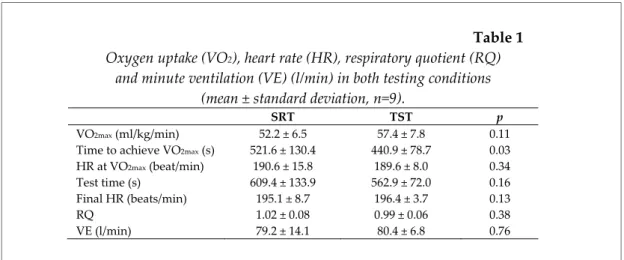
Figure 1 shows the Bland-Altman graphs and Table 2 shows the Bland-Altman fit differences. The mean difference between the TST and SRT was significantly different from zero (p = 0.002). We performed a linear regression model to see if there was a trend towards a bias; given the t score (t = -1.04; p = 0.313), there was no proportional bias and it seemed there was a level of agreement between both tests. We assumed that there was no trend that existed for data above or below the mean of the difference score of the two tests.
Our results also showed a non-significant increasing trend for the HR and VO2 uptake and a
non-significant declining trend for the Bandal
Chagui absolute force over time in the TST.
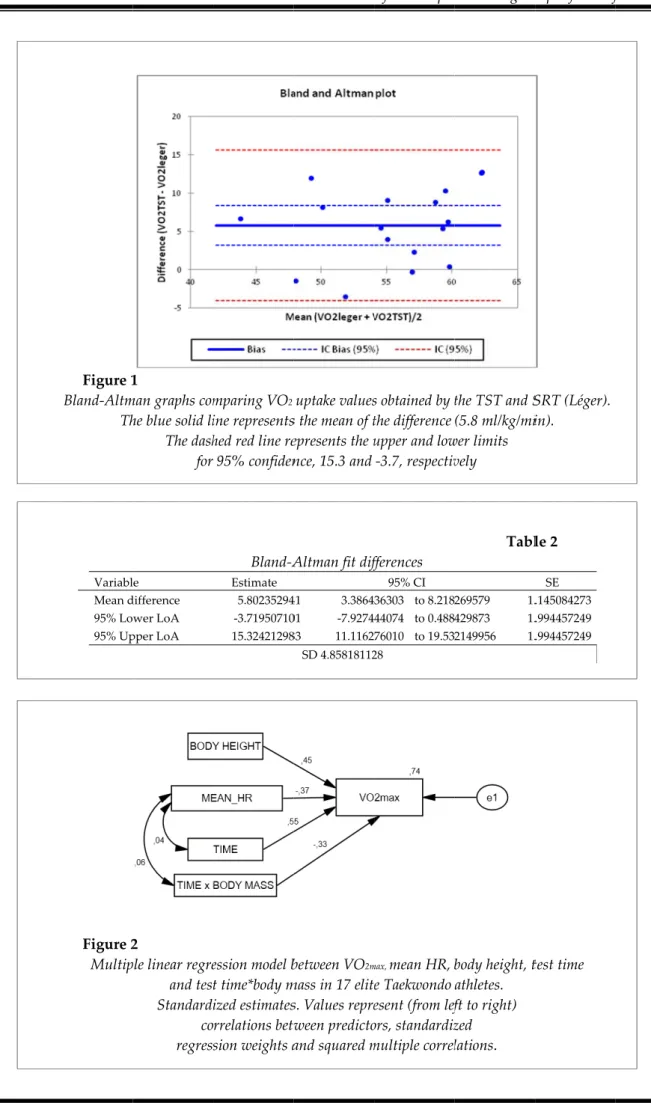
Multiple linear regression was used to model the relationship between explanatory variables during the TST and VO2 uptake by fitting a linear
equation to the observed data. No outliers were found and data analysis proceeded. The adjusted model included four independent variables (mean
HR, body height, TST time and the test time multiplied by body mass), which together explained 74.3% of the overall variability. All of the following paths were statistically significant: - Body Height→VO2max(βVO2max.Body Height = 0.45, p
< 0.001);
- Mean_TST_HR→VO2max(βVO2max.mean_TST_HR =
-0.37, p < 0.003);
- TST_Time→VO2max(βVO2max.TST_Time = 0.55, p <
0.001);
- TST_Time*Body
Mass→VO2max(βVO2max.TST_Time*Body Mass = -0.33, p <
0.01);
The correlation between the predictors was not significant (mean_HR↔ TST_time, r = 0.04, p = 0.86; mean_HR↔ TST_time*body mass, r = 0.06, p
= 0.82).
Figure 2 presents the standardized model with the model estimates of regression coefficients and variability that explained O2 uptake.
To use this model with one equation, we must consider the values of non-standardized coefficients (Figure 3), where we obtain:
The mathematical equation that best described the relationship between VO2max, mean
HR, body height, TST time and test time multiplied by body mass in the TST was as follows:
Equation (1)
VO2max = – 1.4 + 0.58 (body height) – 0.32 (meanHR) +
3.84 (time) – 0.03(time*body mass).
A moderate correlation coefficient was found between the observed (58.4 ml/kg/min) and predicted (60.9 ml/kg/min) VO2max values in the
TST (r = 0.74, p = 0.001; Cohens´s d of -0.45).
Table 1 Oxygen uptake (VO2), heart rate (HR), respiratory quotient (RQ)
and minute ventilation (VE) (l/min) in both testing conditions (mean ± standard deviation, n=9).
SRT TST p
VO2max (ml/kg/min) 52.2 ± 6.5 57.4 ± 7.8 0.11
Time to achieve VO2max (s) 521.6 ± 130.4 440.9 ± 78.7 0.03
HR at VO2max (beat/min) 190.6 ± 15.8 189.6 ± 8.0 0.34
Test time (s) 609.4 ± 133.9 562.9 ± 72.0 0.16
Final HR (beats/min) 195.1 ± 8.7 196.4 ± 3.7 0.13
RQ 1.02 ± 0.08 0.99 ± 0.06 0.38
Figure 1 Bland-Altm Th Variabl Mean d 95% Lo 95% Up Figure 2 Multip 1
man graphs com he blue solid li The dash for e difference wer LoA pper LoA 2
ple linear regre and test Standardi co regress mparing VO2 ine represents hed red line re 95% confiden Bland-A Estimate 5.80235294 -3.71950710 15.32421298 ession model b t time*body m ized estimates rrelations betw sion weights a uptake values s the mean of t epresents the u nce, 15.3 and
Altman fit diff
41 3.3864 01 -7.9274 83 11.1162 SD 4.85818112 between VO2m mass in 17 elite s. Values repre ween predicto and squared m s obtained by the difference upper and low
-3.7, respectiv fferences 95% CI 36303 to 8.218 44074 to 0.488 76010 to 19.53 28 max, mean HR, e Taekwondo esent (from lef ors, standardiz multiple correl the TST and S (5.8 ml/kg/mi wer limits vely Tabl 269579 1. 429873 1. 2149956 1. body height, t athletes. ft to right) zed lations. SRT (Léger). in). le 2 SE .145084273 .994457249 .994457249 test time
Figure 3
Multiple linear regression model between VO2max, mean HR, body height, test time and test time*body mass in 17 elite Taekwondo athletes.
Non-standardized estimates. Values represent (from left to right) covariance, means and variances, regression weights, intercept and variance of e1.
Discussion
The purpose of this study was to assess the aerobic power of taekwondo athletes using an incremental test with high mechanical specificity. Our aim was also to establish an explanatory model of VO2 uptake related with a predictive equation.
Our primary findings showed a similarity between the observed and estimated VO2max during the SRT, which reinforced the reliability of the Léger equation (Cunningham et al., 1994; Paliczaka et al., 1997). However, this appeared to differ from the results presented by Cetin et al. (2005), who reported the underestimation of approximately 16% between observed and estimated VO2max during the SRT in elite Turkish taekwondo athletes. The fact that these authors examined a joint sample of men and women may explain this difference.
We also showed that both protocols (SRT and TST) elicited comparable observed VO2max values (and also VE, HR and RQ). This might appear to be a negative finding as it provides some evidence that a non-specific protocol was a valid method of VO2max determination in
taekwondo athletes. In our opinion, the SRT was useful for its intended application but fairly insensitive to predict VO2max in elite taekwondo athletes, particularly when using the Léger predictive equation. This was the reason why Cetin et al. (2005) developed a regression equation to improve the accuracy of VO2max estimations from the SRT (Bridge et al., 2014). In fact, the Léger predictive equation underestimated VO2max by 10% (52.6 ml/kg/min vs. 58.4 ml/kg/min, p = 0.04) compared to the observed VO2max values during the TST. With regard to the results obtained in the TST, it should be emphasized that these values fell within the range shown by several studies (between 44 and 63 ml/kg/min) (Bridge et al., 2014; Cetin et al., 2005).
A Bland and Altman plot was used not as an analysis, but rather to check the assumptions necessary for validation of the limit of agreement. The points on the plot scattered all over a chart, above and below zero, which suggested that there was no consistent bias of one approach versus the other. This led us to conclude that the plot showed no relationship between discrepancy and the level of measurement, so that the limit of
agreement was valid. In fact, the limit of agreement also estimated an interval of -3.7 to 15.3, which indicated that the TST may measure as much as 3.7 ml/kg/min below and 15.3 ml/kg/min above the SRT (on average the TST measured the VO2 variable over 5.8 ml/kg/min to the SRT). This difference was due to the specificity of the technical gesture: running versus kicking.
Furthermore, significant differences were noted between both tests concerning the time to achieve VO2max (p = 0.03). The mechanisms inducing physiological differences between different exercise modes are not largely understood. Nevertheless, our data seemed in line with other studies (Caputo and Denadai, 2006; Millet et al., 2009) that already showed that exercise mode (e.g., running versus cycling) affected the time to achieve VO2max without influencing maximal exercise time. The physiological differences at submaximal intensities were not addressed in our study. This can be considered a limitation, which otherwise could have shown more physiological dissimilarities between running, cycling and kicking. In fact, running and cycling involve isotonic contractions while kicking is a complex motor task characterized by large force exerted in a short period of time (Falcó and Estevan, 2014). Since VO2 is highly specific to the exercise modality (Millet et al., 2009), given skill can significantly affect motor unit recruitment patterns and as a consequence different technique efficiency (Machado et al., 2010).
For didactic reasons, performing factors of modern-day taekwondo are commonly categorized into those related to tactical and technical efficiency and those related to the physical and physiological demands of competition (Bouhlel et al., 2006). However, heavily dependent relationships are expected to occur between factors. For example, the athlete’s ability to generate and sustain power output (using both concentric and ‘stretch shortening cycle’ muscle actions of the lower limbs) may be important to support the technical and tactical actions in competition (Bridge et al., 2014). In fact, muscle force seems to be a good predictor of endurance performance in several other sporting disciplines such as running and swimming (Hawley and Noakes, 1992). Thus, if muscle force output has a substantial influence on oxygen
uptake, and because intermittent exercises place the accent of stress at the peripheral level (neuromuscular, vascular and metabolic) (Falcó and Estevan, 2014), specialized tests in taekwondo should consider the muscular force characteristic of athletes. However, we failed to identify a significant relationship between muscle force output and VO2max during the TST. For that reason, the adjusted model (structural equation modelling) of VO2max uptake based on force output was not significant. We presume that this lack of correlation was due to the low sensitivity of the Piezo sensor used, particularly when the technique was not performed exactly in the centre of the shield, which can induce some inter-individual variability on the output scores. Nevertheless, mean force values did not change significantly over the TST, which also reflected the commitment of athletes towards the exercise protocol.
We must also keep in mind that a given theoretical model can be appropriate to explain the relational structure of data but can never prove that such a model is unique; it only shows that the theoretical framework envisaged is appropriate for the data observed, not excluding other theoretical models (Marôco, 2014). Further studies should therefore provide a model where the force output could be part of the predictive VO2max equation. Since the TST is an incremental test to be carried out until reaching volitional exhaustion, the number of completed levels/stages represented by the test time was considered in the final model as a predictor variable. Future studies may also consider reporting muscular force in relation to sex, age and weight categories (Bridge et al., 2014); the quotient between body height and force in absolute terms and scaled relatively to lean body mass or height may be important data for researchers and coaches (Pieter and Bercades, 2010).
Notwithstanding the relevance of the present results, this study has some limitations. In particular, the small sample size and its heterogeneity. Taekwondo competitors are usually divided by age, belt, body mass and gender. Our study sample, despite being composed of only elite male athletes (black belts), presents some variability in weight classes. This could have resulted in the exclusion of certain
variables in the predictive model (e.g., the mean power output), leading to only 74% of the overall variability in oxygen uptake. A larger and more homogenous group would lead to more accurate variable estimates, although the results when compared between the predicted and observed TST VO2max had a small to moderate effect size, demonstrating that the differences were insufficient to have a practical impact.
Despite the limitations, this study has some significant merits. An effort was made to assess the aerobic power of taekwondo athletes through a specific test that better represented the mechanical actions and metabolic demands of taekwondo competition. This study also established one equation for predicting VO2max which coaches can use during the training process, without the need to apply a generic laboratory or nonspecific field test. The TST is a
non-invasive test, simple to operate in training and cost efficient together with being valid, i.e. the taekwondo athlete is more likely to respond to this specific test positively as they can identify the techniques with their sports. This presents a great advantage in practice terms and also should encourage researchers to obtain a specific and standardized aerobic assessment protocol.
In summary, the TST had a moderate correlation with the SRT and a relative level of agreement showing that the use of a predictive generalized equation (Léger) can underestimate VO2 uptake in elite taekwondo athletes. The TST protocol with equation (1), which includes such variables as body height, test time, the interaction between test time, body mass and mean heart rate, can be used to estimate VO2max in taekwondo athletes.
Acknowledgements
The expert technical assistance of Luís Crisóstomo and Rui Ramos in collecting data is kindly acknowledged and appreciated. The authors thank the athletes who reported to the laboratory for the two weekends and also thank the Portuguese Taekwondo Federation for the support given to this study.
The results of the current study do not constitute endorsement of the product by the authors or the journal. No conflicts of interest, financial or otherwise, are declared by the authors.
References
Aisbett B, Le Rossignol P. Estimating the total energy demand for supra-maximal exercise using the VO2-power regression from a incremental exercise test. J Sci Med Sport, 2003; 6(3): 343-347
Bouhlel E, Jouini A, Gmada N, Nefzi A, Ben Abdallah K, Tabka Z. Heart rate and blood lactate responses during taekwondo training and competition. Sci Sports, 2006; 21: 285–90
Bridge CA, Jones MA, Drust B. Physiological Responses and perceived exertion during international taekwondo competition. Int J Sports Physiol Perform, 2009; 4: 485-493
Bridge CA, Jones MA, Hitchen P, Sanchez X. Heart rate responses to taekwondo training in experienced practioners. J Strength Cond Res, 2007; 21(3): 718-723
Bridge CA, Santos JFS, Chaabène H, Pieter W, Franchini E. Physical and physiological profiles of taekwondo athletes, Review article. Sports Med, 2014; 44: 713-733
Caputo F, Denadai BS. Exercise mode affects the time to achieve VO2max without influencing maximal
exercise time at the intensity associated with VO2max in triathletes. Int J Sports Med, 2006; 27(10):
798-803
Cetin C, Karatosun H, Baydar ML, Cosarcan K. A regression equation to predict true maximal oxygen consumption of taekwondo athletes using a field test. J Saudi Med, 2005; 26(5): 848-850
Cooke SR, Patersen SR, Quinney HA. The influence of maximal aerobic power on recovery of skeletal muscle following aerobic exercise. Eur J Physiol, 1997; 75: 512-519
Cunningham LN, Cama G, Cilia G, Bazzano O. Relationship of VO2max with the 1-mile run and 20 meter
shuttle run test with youth aged11 to 14 years. Med Sci Sports Exerc, 1994; 26(5): 8209
Duffield R, Dawson B, Pinnington HC, Wong P. Accuracy and reliability of a Cosmed K4b2 portable gas
Falcó C, Estevan I. Biomechanics in Taekwondo: practical applications. In: Performance optimization in
Taekwondo: from laboratory to field. ed. OMICS Group eBooks. Foster City, CA, 1-23; 2014
Glaister M, Stone MH, Stewart AM, Hughes MG, Moir GL. Aerobic and anaerobic correlates of multiple sprint cycling performance. J Strength Cond Res, 2006; 20(4): 792-798
Hawley JA, Noakes TD. Peak power output predicts maximal oxygen uptake and performance time in trained cyclists. Eur J Appl Phyisiol, 1992; 65: 79-83
Heller J, Peic T, Dlouha R, Kohlikova E, Melichna J, Novakova H. Physiological profiles of male and female Taekwondo (ITF) black belts. J Sports Sci, 1998; 16(3): 243-249
Howley ET, Bassett DR Jr, Welch HG. Criteria for maximal oxygen uptake: review and commentary. Med Sci
Sports Exerc, 1995; 27(9): 1292-1301
Lee KM. Tae Kwon Do, techniques and training. New York, NY: Sterling Publishing Comp.; 1996
Léger LA, Lambert J. A maximal multistage 20-m shuttle run test to predict VO2max. Eur J Appl Physiol, 1982;
49: 01-12
Léger LA, Mercier D, Gadoury C, Lambert J. The multistage 20-meter shuttle run test for aerobic fitness. J
Sports Sci, 1988; 6: 93-101
Machado SM, Osório RA, Silva NS, Magini M. Biomechanical analysis of the muscular power of martial arts athletes. Med Biol Eng Comput, 2010; 48: 573-577
Marôco J. Structural equation modelling – theoretical foundations, software and aplications. Pero Pinheiro, 2nd Edition: ReportNumber; 2014
Matsushigue KA, Hartmann K, Franchini E. Taekwondo: physiological responses and match analysis. J
Strength Cond Res, 2009; 23(4): 1112-1117
McCann DJ, Adams WC. A dimensional paradigm for identifying the size-independent cost of walking. Med
Sci Sports Exerc, 2002; 34(6): 1009-1017
MedbØ JI, Tabata I. Relative importance of aerobic and anaerobic energy release during short-lasting exhausting bicycle exercise. J Appl Physiol, 1989; 67: 1881-1886
Millet GP, Vleck VE, Bentley DJ. Physiological differences between cycling and running: lessons from triathletes. Sports Med, 2009; 39(3): 179-206
Nunan D. Development of a sports specific aerobic capacity test for karate – a pilot study. J Sports Sci Med, 2006; 47-53
Paliczaka VJ, Nichols AK, Boreham CA. A multi-stage shuttle run as a predictor of running performance and maximal oxygen uptake in adults. Br J Sports Med, 1987; 21(4): 163-165
Pieter W, Bercades L. Strength and power in filipino varsity taekwondo. Mov Culture, 2010; 10: 67–72 Pieter W. Performance characteristics of elite Taekwondo athletes. Korean J Sports Sci, 1991; 3: 94-117
Ross WD, Marfell-Jones MJ. Kinanthropometry. In: Physiological testing of the high-performance athlete. Champaign, Illinois: Human Kinetics Books, 22-29; 1991
Sant´Ana J, Silva JF, Guglielmo LGA. Physiological variables identified in progressive specific test for taekwondo. Motriz, Rio Claro, 2009; 15(3): 611-620
Thompson WR, Vinueza C. Physiologic profile of Tae Kwon Do black belts. Res Sports Med, 1991; 3: 49–53
Corresponding author:
Fernando Paulo Sebastião Rocha
University of Beira Interior, Department of Sport Sciences Rua Marquês d'Ávila e Bolama, 6201-001 Covilhã, Portugal Phone: +00351 275329153; Fax: 00351 275320695