Predictors of muscle strength in older individuals
Vagner RasoI, Ricardo Cardoso CassilhasII, Marcos Gonçalves de SantanaIII, Rita Aurélia BoscoloII, Valter Antônio Rocha
VianaII,IV, Viviane GrassmannII,IV, Sergio TuikII,IV, Marco Túlio de MelloII,IV
DOI: 10.5935/MedicalExpress.2016.03.09
I Centro de Estudos do Laboratório de Aptidão Física de São Caetano do Sul (CELAFISCS), São Caetano do Sul, SP, Brazil II Universidade Federal de São Paulo Centro de Estudos em Psicobiologia e Exercício, São Paulo, Brazil
III Universidade Federal de Goiás, Faculdade de Educação Física, Jataí, GO, Brazil IV Universidade Federal de São Paulo, Departamento de Psicobiologia, São Paulo, Brazil
PURPOSE: To analyze possible relationships between load, body mass and lean body mass in an efort to provide norm-referenced standards for the one repetition maximum test and to predict whole body muscle strength (WBMS) in older individuals.
METHODS: We measured body mass, lean body mass and the one repetition maximum (1RM) test in diferent exercises in 189 older men and women aged 61 to 82 years. Whole body muscle strength (WBMS) was calculated as the sum of loads of the diferent exercises.
RESULTS: For women, the inclusion of body mass or lean body mass increased the R2 from 0.41 to 0.82, and yielded the following equation: WBMS = 75.788 + (2.288 × load in kg of latissimus pull down) + (0.799 × lean body mass in kg). For men, the inclusion of either body mass (WBMS = 290.33 – [3.140 × age in years] + [1.236 × body mass in kg] + [1.549 × load in kg of leg press]) or, in particular, lean body mass (WBMS = 343.25 – [3.298 × age in years] + [.415 × lean body mass in kg] + [1.737 × load in kg of leg press]) decreased the standard error of the estimate.
CONCLUSION: Our data support the idea that load correlates with body mass and lean body mass and that the load used for a speciic exercise is signiicantly associated with WBMS, thereby permitting the development of a predictive model of WBMS with increased accuracy.
KEYWORDS: Aging, Muscle strength, Resistance exercise.
Raso V, Cassilhas RC, Santana MG, Boscolo RA, Viana VAR, Grassmann V, Sergio Tuik S, Mello MT. Predictors of muscle strength in older individuals. MedicalExpress. 2016 3(2)M160309
Received for Publication on January 23, 2016; First review on February 18, 2016; Accepted for publication on May 1, 2016; Online on May 16, 2016.
E-mail: [email protected]
■
INTRODUCTIONAccumulating evidence indicates that aging affects the neuromuscular system1 and, consequently,
activities of daily living.2,3 Resistance exercises have
been recommended as a strategy to decrease the speed and magnitude of neuromuscular aging, especially as an important resource to preserve physical function and reduce the relative demand for activities of daily living, regardless of the health status.4-6
Aging itself determines the magnitude by which
specific intrinsic variables (e.g., exercise order, velocity
of muscle action) should be adjusted during resistance
training programs. In general, exercise intensity should be maintained within a certain percentage of the one
repetition maximum (1RM) test.4,7 In addition, load per se or load adjusted for body mass or for fat-free mass may be employed as a norm-referenced standard.8
Nevertheless, there is an increased difficulty
in establishing norm-referenced standards in older individuals because aging is typically associated with the presence of diseases,9 which in turn may underlie
the variability in their neuromuscular performance.10
In contrast, norm-referenced standards may assist in identifying older individuals at risk for immediate or prospective mobility limitations11 and could serve as a reference for monitoring therapeutic efficacy.4,6 In this
exercises (older men: chest press, leg press, vertical traction,
abdominal crunch, leg curl and lower back exercises,which were performed using appropriate devices manufactured by Technogym®, Italy; older women: seated chest press, latissimus pull down, seated row, knee extension, and leg press exercises, which were performed using appropriate devices manufactured by Biodelta Equipment®, Brazil).
Initially, volunteers performed the exercises with no load, and subsequently, the load was calibrated based on the
rating of perceived exertion (6-8 on a 10-point scale).
During this period, volunteers learned how to perform the exercises correctly, learned an adequate respiratory
technique (expiration during the concentric phase),
performed each exercise at an adequate velocity of execution
(1- to 2-sec concentric and 2- to 3-sec eccentric action), and took adequate rest intervals (120 s intersets and 180
s interexercises). Approximately 5-10 min of upper- and lower-extremity mobility and stretching exercises preceded and followed all sessions during the acclimation period.8
One repetition maximum test
1RM was determined as the maximum amount
of weight a subject could move once, using the proper
technique. “Proper technique” was defined as the subject performing each resistance exercise using the specified
muscle groups and without using momentum or changes in body position to apply force.8
Load and muscle strength
Absolute load indicates the total load, i.e., the weight
moved in the 1RM test. The relative load is the total load
adjusted to body mass and lean body mass.8 Thus, our
cutoffs are presented as absolute and relative loads. We also developed an indicator of whole body muscle strength
(WBMS), which in men, was the sum of loads on the chest
press, leg press, vertical traction, abdominal, leg curl and
lower back exercises. In women, WBMS was characterized as the sum of loads on the chest press, leg press, latissimus pull down, knee extension and seated row exercises.
Statistical analysis
The Shapiro-Wilk test was used to analyze data
normality. The Pearson product-moment correlation
coefficient was used to determine the univariate associations
of muscle force with body mass or lean body mass. A principal component analysis was calculated that included chest press, leg press, vertical traction, abdominal crunch, arm curl and back extension. Hierarchical multiple regression analyses were also performed to develop prediction equation models for whole-body muscle strength as a function of age, absolute load, body mass, and lean body mass. All analyses were performed using the Predictive Analytics Software 17.0
version for Windows package (PASW, Inc., Chicago, IL). Data
are presented as the mean ± the standard error of the mean. during session exercises and allow clinicians to estimate
whole-body muscle strength with a satisfactory level of accuracy. Therefore, the purpose of this study was to analyze possible relationships between load, body mass and lean body mass in an effort to provide norm-referenced
standards for the 1RM test and to predict whole-body muscle strength (WBMS) using univariate or multivariate
regressions models in clinically healthy older individuals.
■
METHODSSubjects
Physically inactive male and female volunteers aged 60 to 82 years were recruited from the community. They were informed of the procedures and risks and then gave their written consent to participate in this study, which had been approved by the institutional research ethics
committee (cases #842/11 and #0095/03).
A preliminary telephone screening focused on current health status, drug and cigarette use, and habitual physical activity; this was followed by a hospital visit for a detailed history and physical examination covering past and current health status, symptoms of depression, self-reported ability to perform the basic and instrumental activities of daily living, a 12-lead electrocardiogram, an assessment of body composition, and general laboratory blood and urine tests.
Subsequently, volunteers were excluded if they (i) had
participated in any regular physical activity program during
the previous three months; (ii) were involved in alternative dietary therapy; (iii) were undernourished or obese; (iv) smoked cigarettes; (v) had a cardiovascular, pulmonary,
or metabolic disease or a chronic infectious or an
auto-immune disease; (vi) had a central or peripheral nervous system disorder; (vii) had been treated for or had a history of cancer; (viii) had chronically used corticosteroids; (ix) had any surgery during the previous three months; (x) had been
forced to take bed rest during the previous three months; or
(xi) had any orthopedic condition(s) that could limit exercise
or that could be exacerbated by exercise testing.
Body composition
Body mass and height were measured using standard techniques. Body mass index was calculated as the body
mass (kg) divided by body height squared (m2). For men,
fat mass and lean body mass were determined using the
air displacement plethysmograph for men (BODPOD®, Life Measurement Instruments, Concord, CA, USA),12 whereas
for women, a bioelectrical impedance device was used
(Biodynamics®, model 450, USA).
Acclimation period
■
RESULTSGeneral demographics
With few exceptions, our subjects fell into the “young-old” age category regardless of gender. The average body mass
index and fat mass were within normal ranges (Table 1).
Association between body composition and load
Body mass was significantly correlated with load
in all exercises for both genders. The same phenomenon was observed for lean body mass, but in this case, only for men. In contrast, lean body mass correlated with chest press, knee extension, and seated row only in women; in
the first two exercises, the correlation was higher for lean body mass (data not shown).
Cutofs and absolute and relative load
We establishedcutoffs for each exercise based on the
absolute and relative load (adjusted for body mass and lean body
mass). These cutoffs were higher when the load was matched
for lean body mass regardless of gender (Tables 2 and 2A).
Principal components analysis (PCA)
We submitted the men (vertical traction, biceps curl, triceps extension, abdominal, leg curl, leg press and lower back) and women exercise data (chest press, latissimus
pull down, leg press, knee extension and seated row) to
the principal component analysis (PCA) analysis. The
Kaiser-Meyer-Olkin value was 0.82 for men and 0.79 for
women, and Bartlett’s test of sphericity attained statistical
significance (p = 0.001) in both genders. PCA revealed that its first component only had an Eigenvalue exceeding 1 for both men (3.989) and women (2.968), which explained 54% and 59.5% of the variance, respectively (Table 3).
Prediction models
We developed prediction models to estimate
WBMS as a function of absolute load for each exercise
and adjusted for important covariates, such as age, body
mass, and lean body mass (Tables 5 and 6). The predictive
power of all models was age independent only for women
(Table 6); for men, all outputted models reached statistical significance. We present only the first three models based on the standard error of estimate (Tables 5 and 6).
In men, the leg press exercise, when modeled
either with body mass (77% and 30.72 kg) or lean body mass (73% and 33.44 kg), was more accurate than other
exercises For women, the model using the latissimus pull down exercise demonstrated elevated predictive power and a low standard error of estimate, regardless of the
variable included in the model (body mass [81% and 11.09 kg] or lean body mass [82% and 11.01 kg]). The
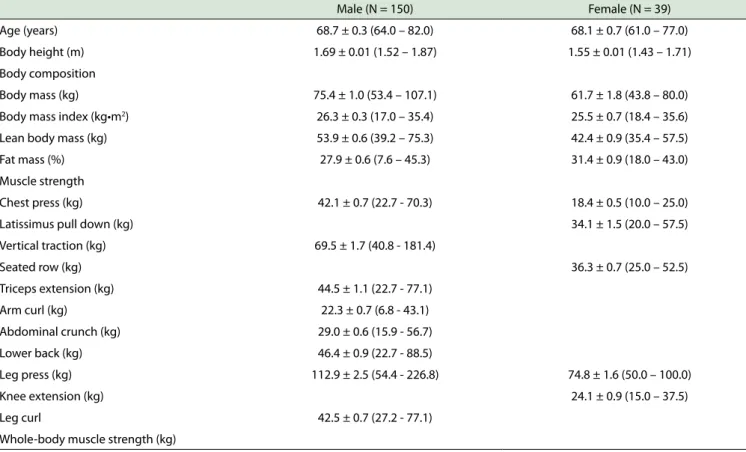
Table 1 - Sample population demographics*
Male (N = 150) Female (N = 39)
Age (years) 68.7 ± 0.3 (64.0 – 82.0) 68.1 ± 0.7 (61.0 – 77.0)
Body height (m) 1.69 ± 0.01 (1.52 – 1.87) 1.55 ± 0.01 (1.43 – 1.71)
Body composition
Body mass (kg) 75.4 ± 1.0 (53.4 – 107.1) 61.7 ± 1.8 (43.8 – 80.0)
Body mass index (kg•m2) 26.3 ± 0.3 (17.0 – 35.4) 25.5 ± 0.7 (18.4 – 35.6)
Lean body mass (kg) 53.9 ± 0.6 (39.2 – 75.3) 42.4 ± 0.9 (35.4 – 57.5)
Fat mass (%) 27.9 ± 0.6 (7.6 – 45.3) 31.4 ± 0.9 (18.0 – 43.0)
Muscle strength
Chest press (kg) 42.1 ± 0.7 (22.7 - 70.3) 18.4 ± 0.5 (10.0 – 25.0)
Latissimus pull down (kg) 34.1 ± 1.5 (20.0 – 57.5)
Vertical traction (kg) 69.5 ± 1.7 (40.8 - 181.4)
Seated row (kg) 36.3 ± 0.7 (25.0 – 52.5)
Triceps extension (kg) 44.5 ± 1.1 (22.7 - 77.1)
Arm curl (kg) 22.3 ± 0.7 (6.8 - 43.1)
Abdominal crunch (kg) 29.0 ± 0.6 (15.9 - 56.7)
Lower back (kg) 46.4 ± 0.9 (22.7 - 88.5)
Leg press (kg) 112.9 ± 2.5 (54.4 - 226.8) 74.8 ± 1.6 (50.0 – 100.0)
Knee extension (kg) 24.1 ± 0.9 (15.0 – 37.5)
Leg curl 42.5 ± 0.7 (27.2 - 77.1)
Whole-body muscle strength (kg)
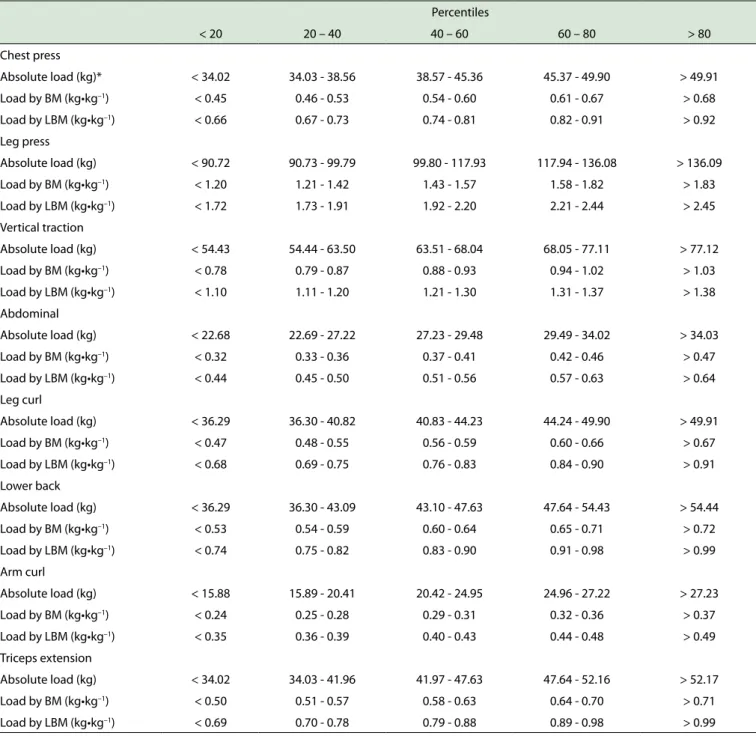
Table 2 - Cutofs for the absolute and relative load in distinct exercises for men
Percentiles
< 20 20 – 40 40 – 60 60 – 80 > 80
Chest press
Absolute load (kg)* < 34.02 34.03 - 38.56 38.57 - 45.36 45.37 - 49.90 > 49.91
Load by BM (kg•kg–1) < 0.45 0.46 - 0.53 0.54 - 0.60 0.61 - 0.67 > 0.68
Load by LBM (kg•kg–1) < 0.66 0.67 - 0.73 0.74 - 0.81 0.82 - 0.91 > 0.92
Leg press
Absolute load (kg) < 90.72 90.73 - 99.79 99.80 - 117.93 117.94 - 136.08 > 136.09
Load by BM (kg•kg–1) < 1.20 1.21 - 1.42 1.43 - 1.57 1.58 - 1.82 > 1.83
Load by LBM (kg•kg–1) < 1.72 1.73 - 1.91 1.92 - 2.20 2.21 - 2.44 > 2.45
Vertical traction
Absolute load (kg) < 54.43 54.44 - 63.50 63.51 - 68.04 68.05 - 77.11 > 77.12
Load by BM (kg•kg–1) < 0.78 0.79 - 0.87 0.88 - 0.93 0.94 - 1.02 > 1.03
Load by LBM (kg•kg–1) < 1.10 1.11 - 1.20 1.21 - 1.30 1.31 - 1.37 > 1.38
Abdominal
Absolute load (kg) < 22.68 22.69 - 27.22 27.23 - 29.48 29.49 - 34.02 > 34.03
Load by BM (kg•kg–1) < 0.32 0.33 - 0.36 0.37 - 0.41 0.42 - 0.46 > 0.47
Load by LBM (kg•kg–1) < 0.44 0.45 - 0.50 0.51 - 0.56 0.57 - 0.63 > 0.64
Leg curl
Absolute load (kg) < 36.29 36.30 - 40.82 40.83 - 44.23 44.24 - 49.90 > 49.91
Load by BM (kg•kg–1) < 0.47 0.48 - 0.55 0.56 - 0.59 0.60 - 0.66 > 0.67
Load by LBM (kg•kg–1) < 0.68 0.69 - 0.75 0.76 - 0.83 0.84 - 0.90 > 0.91
Lower back
Absolute load (kg) < 36.29 36.30 - 43.09 43.10 - 47.63 47.64 - 54.43 > 54.44
Load by BM (kg•kg–1) < 0.53 0.54 - 0.59 0.60 - 0.64 0.65 - 0.71 > 0.72
Load by LBM (kg•kg–1) < 0.74 0.75 - 0.82 0.83 - 0.90 0.91 - 0.98 > 0.99
Arm curl
Absolute load (kg) < 15.88 15.89 - 20.41 20.42 - 24.95 24.96 - 27.22 > 27.23
Load by BM (kg•kg–1) < 0.24 0.25 - 0.28 0.29 - 0.31 0.32 - 0.36 > 0.37
Load by LBM (kg•kg–1) < 0.35 0.36 - 0.39 0.40 - 0.43 0.44 - 0.48 > 0.49
Triceps extension
Absolute load (kg) < 34.02 34.03 - 41.96 41.97 - 47.63 47.64 - 52.16 > 52.17
Load by BM (kg•kg–1) < 0.50 0.51 - 0.57 0.58 - 0.63 0.64 - 0.70 > 0.71
Load by LBM (kg•kg–1) < 0.69 0.70 - 0.78 0.79 - 0.88 0.89 - 0.98 > 0.99
BM: body mass; LBM: lean body mass.
model constituted by age, lean body mass, and leg press
also provided significant accuracy for women. Other single
models and the model comprising the chest press plus body mass showed similar predictive power and standard
errors of the estimate (Table 5 and 6).
■
DISCUSSIONOur data offers substantial information, which
may be considered as norm-referenced standards for
the 1RM test in clinically healthy and sedentary older individuals. Our results also support the idea that
load correlates with body mass and lean body mass; the load used for a specific exercise is significantly
associated with WBMS and allows the development of predictive models of WBMS with significant accuracy.
To the best of our knowledge, no previous reports exist demonstrating that the load used in a certain exercise
represents an important predictor of WBMS regardless
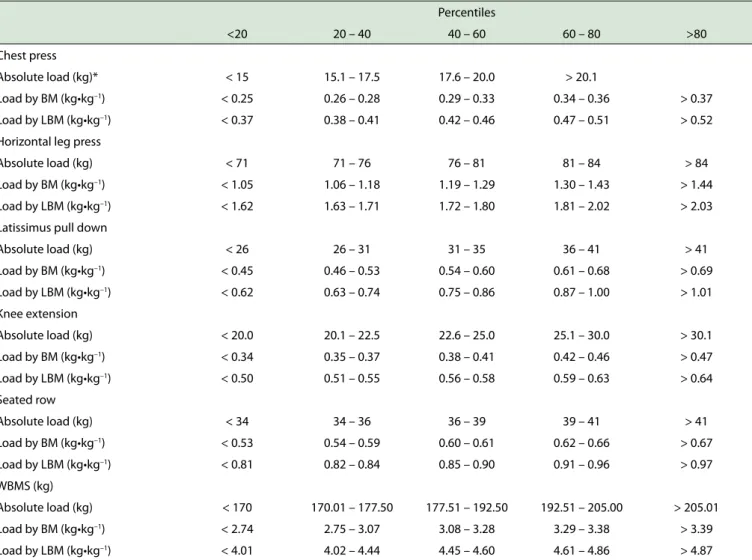
Table 3 - Cutofs for the absolute and relative load in distinct exercises for women
Percentiles
<20 20 – 40 40 – 60 60 – 80 >80
Chest press
Absolute load (kg)* < 15 15.1 – 17.5 17.6 – 20.0 > 20.1
Load by BM (kg•kg–1) < 0.25 0.26 – 0.28 0.29 – 0.33 0.34 – 0.36 > 0.37
Load by LBM (kg•kg–1) < 0.37 0.38 – 0.41 0.42 – 0.46 0.47 – 0.51 > 0.52
Horizontal leg press
Absolute load (kg) < 71 71 – 76 76 – 81 81 – 84 > 84
Load by BM (kg•kg–1) < 1.05 1.06 – 1.18 1.19 – 1.29 1.30 – 1.43 > 1.44
Load by LBM (kg•kg–1) < 1.62 1.63 – 1.71 1.72 – 1.80 1.81 – 2.02 > 2.03
Latissimus pull down
Absolute load (kg) < 26 26 – 31 31 – 35 36 – 41 > 41
Load by BM (kg•kg–1) < 0.45 0.46 – 0.53 0.54 – 0.60 0.61 – 0.68 > 0.69
Load by LBM (kg•kg–1) < 0.62 0.63 – 0.74 0.75 – 0.86 0.87 – 1.00 > 1.01
Knee extension
Absolute load (kg) < 20.0 20.1 – 22.5 22.6 – 25.0 25.1 – 30.0 > 30.1
Load by BM (kg•kg–1) < 0.34 0.35 – 0.37 0.38 – 0.41 0.42 – 0.46 > 0.47
Load by LBM (kg•kg–1) < 0.50 0.51 – 0.55 0.56 – 0.58 0.59 – 0.63 > 0.64
Seated row
Absolute load (kg) < 34 34 – 36 36 – 39 39 – 41 > 41
Load by BM (kg•kg–1) < 0.53 0.54 – 0.59 0.60 – 0.61 0.62 – 0.66 > 0.67
Load by LBM (kg•kg–1) < 0.81 0.82 – 0.84 0.85 – 0.90 0.91 – 0.96 > 0.97
WBMS (kg)
Absolute load (kg) < 170 170.01 – 177.50 177.51 – 192.50 192.51 – 205.00 > 205.01
Load by BM (kg•kg–1) < 2.74 2.75 – 3.07 3.08 – 3.28 3.29 – 3.38 > 3.39
Load by LBM (kg•kg–1) < 4.01 4.02 – 4.44 4.45 – 4.60 4.61 – 4.86 > 4.87
*Only four cutof points were generated due to granularity in the data (thus, data are in quartile format: P0–P25, P25–P50, P50–P75, P75–P100). BM: Body mass, LBM: Lean body mass, WBMS: Whole-body muscle strength.
On the other hand, these data may have limited gene -ralizability because the models were developed in a selected
group of clinically healthy older individuals. Certainly, further
studies are required to determine the ability of our models to
predict WBMS in groups of individuals whose demographics vary substantially from the range of our sample (e.g., physical
activity level, health status, disease severity).
It is also important to consider that evidence from populations with different lifestyles may simply characterize the consequences of their respective lifestyles rather than the inevitable expression of aging.10 Therefore, our study is relevant because a significant proportion of our findings
may be explained by aging per se (due to the fact that these
volunteers were selected using rigorous eligibility criteria). But these subjects may represent a homogeneous group of people with an elevated predisposition to health care and who volunteer to participate in research projects. In this way, a certain degree of caution should be considered for our results particularly if our cutoffs are compared with
older individuals with transmissible or non-transmissible diseases.
The performance of activities of daily living is de-pendent upon muscle strength, which may be used objec-tively as a preclinical marker of mobility limitations.13-15 Our norm-referenced standards may assist in identifying
individuals who are susceptible to mobility limitations or individuals with a neuromuscular reserve that could be used to protect against mobility limitations.11
The multiple regression model obtained using
com-bined variables (i.e., load with a certain body composition
parameter) showed improved sensitivity.
For women, when estimating WBMS, the inclusion of body mass or lean body mass increased the R2 from 0.41 (model 6) to 0.82 (model 5); this accounts for the additional 41% of the variability for the WBMS. Moreover, an important
decrease was observed in the standard error of estimate
(SEE), and the following predictive equation (R = 0.90,
Table 4 - Vectors for the principal component analysis of data from the men and women
Men Women
Component First Second Third First Second Third
% of variance explained 57.0 11.5 10.3 59.5 16.0 11.0
Abdominal .330 .837
Biceps curl .715 .331 .393
Chest press .913
Knee extension .646 .546
Latissimus pull down .716 .483
Leg curl .165 .782 .359
Leg press .324 .834 .937
Lower back .183 .436 .741
Seated row .896
Triceps .640 .364 .370
Vertical traction .922 .165 .155
Table 5 - Predictive models to estimate whole-body muscle strength as a function of absolute load and body composition for men
Prediction model Variable Coeicients SE Β P Constant R(R2) SEE P
Body mass
1
Age -3.140 .733 -.173 .0005
290.33 .88 (0.77) 30.72 .0005 Body mass 1.236 .236 .226 .0005
Leg press 1.549 .093 .726 .0005
2
Age -1.897 .912 -.105 .039
141.40 .82 (0.66) 37.31 .0005 Body mass 1.953 .273 .357 .0005
Chest press 4.378 .364 .620 .0005
3
Age -1.962 .992 -.108 .050
258.97 .78 (0.60) 40.40 .0005 Body mass 1.134 .326 .207 .001
Vertical traction 1.914 .189 .626 .0005
Lean body mass 4
Age -3.298 .798 -.182 .0005 343.25 0.86 (0.73) 33.44 .0005
Lean body mass .415 .374 .049 .0005
Leg press 1.737 .094 .815 .0005
5
Age -1.997 1.035 -.110 .031 362.10 0.76 (0.56) 42.32 .0005
Lean body mass -1.373 .477 -.161 .0005
Chest press 5.151 .409 729 .0005
6
Age -1.824 1.033 -.101 .046 319.77 0.76 (0.57) 42.09 .0005
Lean body mass -.082 .468 -.010 .0005
Vertical traction 2.218 .174 .726 .0005
Univariate
7 Age -3.313 .795 -.183 .0005 375.44 0.86 (0.73) 33.47 .0005 Leg press 1.726 .094 .809 .0005
8 Age -1.822 1.025 -.100 .078 313.56 0.76 (0.57) 41.94 .0005 Vertical traction 2.220 .173 .726 .0005
9 Age -2.130 1.057 -.117 .046 280.71 0.74 (0.54) 43.40 .0005 Chest press 4.950 .411 .701 .0005
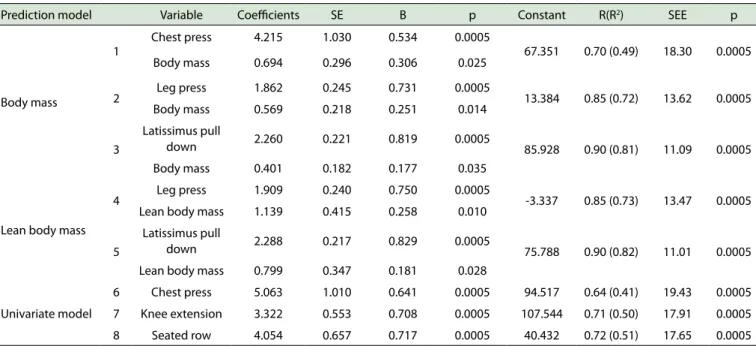
Table 6 - Predictive models to estimate whole-body muscle strength as a function of absolute load and body composition for women* Prediction model Variable Coeicients SE Β p Constant R(R2) SEE p
Body mass
1
Chest press 4.215 1.030 0.534 0.0005
67.351 0.70 (0.49) 18.30 0.0005 Body mass 0.694 0.296 0.306 0.025
2 Leg press 1.862 0.245 0.731 0.0005 13.384 0.85 (0.72) 13.62 0.0005 Body mass 0.569 0.218 0.251 0.014
3
Latissimus pull
down 2.260 0.221 0.819 0.0005 85.928 0.90 (0.81) 11.09 0.0005
Body mass 0.401 0.182 0.177 0.035
Lean body mass
4 Leg press 1.909 0.240 0.750 0.0005 -3.337 0.85 (0.73) 13.47 0.0005 Lean body mass 1.139 0.415 0.258 0.010
5
Latissimus pull
down 2.288 0.217 0.829 0.0005 75.788 0.90 (0.82) 11.01 0.0005
Lean body mass 0.799 0.347 0.181 0.028
Univariate model
6 Chest press 5.063 1.010 0.641 0.0005 94.517 0.64 (0.41) 19.43 0.0005
7 Knee extension 3.322 0.553 0.708 0.0005 107.544 0.71 (0.50) 17.91 0.0005
8 Seated row 4.054 0.657 0.717 0.0005 40.432 0.72 (0.51) 17.65 0.0005
*The models were outputted regardless of age; SE: standard error; SEE: standard error of estimate (kg).
(2.288 × load in kg of latissimus pull down) + (0.799 × lean body mass in kg). The most practical equation was WBMS = 85.928 + (2.260 × load in kg of latissimus pull down) + (0.401 × body mass in kg; R= 0.90, SEE = 11.09 kg, p < 0.0005).
For men, the most practical equation was WBMS = 375.44 - (3.313 × age in years) + (1.726 × load in kg of leg
press; R = 0.86, SEE = 33.47 kg, p < 0.0005). However, the
inclusion of either body mass (WBMS = 290.33 – [3.140 × age in years] + [1.236 × body mass in kg] + [1.549 × load in kg of leg press]) or lean body mass (WBMS = 343.25 – [3.298 × age in years] + [.415 × lean body mass in kg] + [1.737 × load in kg of leg press]) decreased the standard
error of estimate.
Some practical implications should be noted. Our
predictive models may be used by clinicians and therapists in the management of load during exercise sessions as well as for the estimate of the whole-body muscle strength with satisfactory accuracy.
In conclusion, our data supports the idea that load correlates with body mass and lean body mass, and that the
load used for a specific exercise is significantly correlated with WBMS, allowing the development of satisfactory models to predict WBMS in older individuals.
ACKNOWLEDGMENTS
The authors would like to thank the Research
Incentive Fund Association (AFIP), the Psychobiology and Exercise Research Center (CEPE), the Multidisciplinary Center for the Study of Drowsiness and Accidents (CEMSA), the Research Innovation and Dissemination Centers (CEPID-Sleep), the National Council for Scientific and
Technological Development (CNPq), and the São Paulo Research Foundation (FAPESP 2001/14976-2).
CONFLICTS OF INTEREST
The authors declare that they have no further conflict
of interest.
AUTHOR CONTRIBUTIONS
Study concept and design: Raso V. Acquisition of data: Boscolo RA, Grassmann V, Santana MG, Viana VAR, and Raso V. Analysis and interpretation of data: Raso V. Drafting of the manuscript: Raso V. Critical revision of the manuscript for important intellectual content: Cassilhas RC, Mello MT and Raso V. Statistical analysis: Raso V. Administrative, technical, or material support: Mello MT and Tufik S. Study supervision: Mello MT and Tufik S.
PREDITORES DE FORÇA MUSCULAR EM IDOSOS
OBJETIVO: Analisar as relações entre carga, massa corporal e massa magra na tentativa de fornecer normas
padrão de referencia para o teste de uma repetição máxima
e predizer a forca muscular corporal em idosos.
MÉTODOS: A massa corporal, a massa magra e o
teste de uma repetição máxima (1RM) foram medidos em
189 idosos com idade entre 61 e 82 anos. A forca muscular
corporal (FMC) foi calculada como a somatória das cargas
dos diferentes exercícios.
RESULTADOS: Para mulheres, a inclusão da massa
o puxador) + (0.799 × massa magra em kg). Para homens, a inclusão da massa corporal (FMC = 290.33 – [3.140 × idade em anos] + [1.236 × massa corporal em kg] + [1.549 × carga em kg para o leg press]) ou da massa magra (FMC = 343.25 – [3.298 × idade em anos] + [.415 × massa magra em kg] + [1.737 × carga em kg para o leg press]) diminuiu o erro padrão da estimativa.
CONCLUSÃO: Nossos resultados suportam a ideia de que a carga correlaciona-se com a massa corporal e massa magra, e que a carga empregada em determinado exercício
está significativamente associada com a forca muscular
corporal. Portanto, isso permite o desenvolvimento de um modelo preditivo de forca muscular corporal com
substancial acurácia.
PALAVRAS-CHAVE: Envelhecimento, forca muscular, exercícios com pesos.
REFERENCES
1. Boirie Y. Physiopathological mechanism of sarcopenia. Nutr Health
Aging. 2009;13:717-23.
http://dx.doi.org/10.1007/s12603-009-0203-x
2. Buchman AS, Boyle PA, Leurgans SE, Evans DA, Bennett DA. Pulmonary
function, muscle strength, and incident mobility disability in elders.
Proc Am Thorac Soc. 2009;6:581-7. http://dx.doi.org/10.1513/ pats.200905-030RM.
3. Bassey EJ, Fiatarone MA, O’Neill EF, Kelly M, Evans WJ, Lipsitz LA. Leg extensor power and functional performance in very old men and women. Clin Sci. 1992;82:321-7. http://dx.doi.org/10.1042/
cs0820321
4. Chodzko-Zajko WJ, Proctor DN, Fiatarone Singh MA, Minson CT, Nigg CR, Salem GJ, et al. Exercise and physical activity for older adults.
Med Sci Sports Exerc. 2009;41:1510-30. http://dx.doi.org/10.1249/ MSS.0b013e3181a0c95c.
5. Nelson ME, Rejeski WJ, Blair SN, Duncan PW, Judge JO, King AC, et al. Physical activity and public health in older adults: recommendation from the American College of Sports Medicine and the American
Heart Association. Circulation. 2007;116:1094-105. http://dx.doi. org/10.1161/CIRCULATIONAHA.107.185650
6. U.S. Department of Health and Human Services. Physical activity and health: a report of the Surgeon General. Atlanta, GA: U.S. Department of Health and Human Services, Centers for Disease Control and Prevention, National Center for Chronic Disease Prevention and Health Promotion, 1996.
7. Ratamess NA, Alvar BA, Evetoch TK, Housch TJ, Ben Kibler W, Kraemer WJ, et al. Progression models in resistance training for healthy adults.
Med Sci Sports Exerc. 2009;41:687-708. http://dx.doi.org/10.1249/ MSS.0b013e3181915670
8. Heyward VH. Designing resistance training programs. In Vivian Hey
-ward, Ed. Advanced fitness assessment and exercise prescription. 3rd ed. Human Kinetics, USA, 2006, 121-144.
9. Christensen K, Doblhammer G, Rau R, Vaupel JW. Ageing populations: the challenges ahead. Lancet. 2009;374:1196-1208. http://dx.doi. org/10.1016/S0140-6736(09)61460-4
10. Shephard RJ. Impact of aging on major physiological systems at rest and during submaximal and maximal exercise. In: RJ Shephard, Ed.
Aging, physical activity, and health. Human Kinetics. 1997;57-138.
11. Manini TD, Visser M, Won-Park S, Patel KV, Strotmeyer ES, Chen H,
et al. Knee extension strength cutpoints for maintaining mobility. J
Am Geriatr Soc. 2007;55:451-7.
http://dx.doi.org/10.1111/j.1532-5415.2007.01087.x
12. Fields DA, Hunter GR. Monitoring body fat in the elderly: applica
-tion of air-displacement plethysmography. Curr Opin Clin Nutr Metab Care 2004; 7: 11-4, 2004. http://dx.doi.org/10.1097/01.
mco.0000109597.04238.f7
13. Cress ME, Meyer M. Maximal voluntary and functional performance
levels needed for independence in adults aged 65 to 97 years. Phys
Ther. 2003;83:37-48.
14. Lauretani F, Russo CR, Bandinelli S, Bartali B, Cavazzini C, Di Iorio A, et al. Age-associated changes in skeletal muscles and their effect on mobility: an operational diagnosis of sarcopenia. J Appl Physiol. 2003;95:1851-60. http://dx.doi.org/10.1152/japplphysiol.00246.2003
15. Ploutz-Snyder LL, Manini T, Ploutz-Snyder RJ, Wolf DA. Functionally rel