Table of Content
ABBREVIATIONS ... 17
CHAPTER I INTRODUCTION AND AIMS ... 19
1. Resveratrol ... 21
1.1. Resveratrol Quantification ... 22
1.2. Resveratrol Metabolism and Absorption... 23
2. Drug Absorption ... 24
2.1. The Intestinal Epithelium ... 25
2.2. Mechanism of Intestinal Drug Transport... 26
2.2.1. Passive Transcellular Drug Transport ... 27
2.2.2. Passive Paracellular Drug Transport... 28
2.2.3. Carrier Mediated Transport ... 28
2.2.3.1. Carrier Mediated Influx Transport... 28
2.2.3.2. Mammalian Drug Efflux Transporters... 30
2.2.3.2.1. Pgp ... 30
2.2.3.2.2. MRP 1-5... 31
2.2.3.2.3. BCRP... 33
3. Methods for Studying Intestinal Drug Absorption... 34
3.1. Excised tissues ... 35
3.2. Cells-based in vitro studies... 35
3.3. Artificial Membrane and In Silico Methods ... 37
4. Aims... 38
CHAPTER II MATERIAL AND METHODS... 39
1. Reagents and Radiolabeled Material ... 41
2. Caco-2 ... 41
2.1. Cell Culture ... 41
3. Transport of Trans-Resveratrol across Caco-2 Cells... 42
4. Influx of Trans-Resveratrol into Caco-2 Cells ... 42
5. Efflux of Resveratrol from the Caco-2 Cells ... 43
6. Analysis of Trans-Resveratrol Sulfates in Caco-2 Cell Homogenates... 44
7. Bio-analytical Method Validation ... 44
7.1. Reference Solutions ... 44
7.2. Calibration Standards ... 44
7.3. Quality Controls ... 45
7.4. Validation Parameters ... 45
7.4.1. Carryover ... 45
7.4.2. Working and Linear Range... 45
7.4.3. Precision and Accuracy ... 46
7.4.3.1. Intra-batch Precision and Accuracy... 46
7.4.3.2. Inter-batch Precision and Accuracy... 46
7.4.4. Stability ... 47
8. HPLC-MSD Method... 47
9. Radiolabeled Material Detection ... 47
10. Calculations and Statistics ... 47
10.1. Apparent Permeability Coefficients ... 47
10.2. Analysis Methods... 48
10.2.1. Homoscedasticity... 48
10.3. Simple and Weighted Linear Regression ... 49
10.3.1. Choice the Weighting Factor ... 50
CHAPTER III
RESULTS ... 53
1. Bio-analytical Method Validation ... 55
1.1. Carryover ... 55
1.2. Working Range ... 55
1.2.1. Test of Homoscedasticity ... 55
1.2.2. Choice of the Weighting Factor ... 57
1.3. Intra-batch Precision and Accuracy... 61
1.4. Inter-batch Accuracy and Precision... 62
1.5. Stability ... 63
2. Transport, Influx and Efflux Studies ... 65
2.1. Monolayer Integrity ... 65
2.2. Transport of Trans-Resveratrol across Caco-2 Monolayer ... 65
2.3. Accumulation of Trans-Resveratrol in Caco-2 Cells... 70
2.4. Trans-Resveratrol Efflux from the Caco-2 Cells... 72
2.5. Effect of 2,4-Dinitrophenol on the Trans-Resveratrol Transport ... 76
2.6. Effect of Verapamil in Trans-Resveratrol Accumulation in Caco-2 Cells and Transport.. 83
2.7. Effect of MK571 in Trans-Resveratrol Accumulation in Caco-2 Cells and Transport ... 86
3. Transport of Trans-Resveratrol Glucuronide and Sulfates across Caco-2 Cells Monolayer ... 93
CHAPTER IV DISCUSSION AND CONCLUSION ... 100
CHAPTER V REFERENCES... 108
ABBREVIATIONS
ATP Adenosine Tri-Phosphate
AP ACN AZT BCRP BL CYP CV CI DAD DNP DMSO GC-MS GSH HPLC IAM LC-MS LLOQ ULOQ LC-(AP-ESI)-MS MS MRP OATPs OCT POT Pgp MRD 6-MP PMEA PAMPA PAPS Papp QSAR QC RNA RE SIM SEM TG TEER UV VP i
ω
Apical Cell Border Acetonitrile Azidothymidine
Breast Cancer Resistance Protein Basal Cell Border
Cytochrome Coefficient of Variation Confidence Interval Diode Array 2,4-Dinitrophenol Dimethyl-Sulphoxide
Gas Chromatography –Mass Spectrometry Gluthatione
High Performance Liquid Chromatography Immobilized Artificial Membranes
Liquid Chromatography –Mass Spectrometry Lower Limit of Quantification
Upper Limit of Quantification
Liquid Chromatography–Atmospheric Pressure-Electrospray Ionisation- Mass spectrometry
Mass Spectrometry
Multi-Drug Resistance Proteins
Organic Anionic Transporters Polypeptides Organic Cationic Transporters
Proton-Dependent Oligopeptides Transporters P-Glycoprotein
Multi Resistance Drug 6-Mercaptopurine
9-(2-phosphonylmethoxyethly) Adenine Parallel Artificial Membrane Permeation Assay 3’phosphoadenosine-5’-phosphosulfate Apparent Permeability Coefficients
Quantitative Structure Activity Relationships Quality Controls
Ribonucleic Acid Relative Error
Selected Ion Monitoring Standard Error of the Mean Thioguanine
Transepithelial Electrical Resistance Ultra Violet
Verapamil Weighting Factor
CHAPTER I
INTRODUCTION AND AIMS
1. Resveratrol
Trans-resveratrol (Fig. 1) is a natural occurring polyphenol, found in several fruits,
vegetables and beverages, including red wine. To date, in vivo and in vitro experiments have shown numerous biological activities of this compound. One of the first reviews about resveratrol was written by Soleas et al. (Soleas, Diamandis et al. 1997) with almost 200 references, where it was reported some of the biological effects of resveratrol. Recent reports have been shown that resveratrol is a potent chemioprotective agent (Wang, Heredia et al. 2004; Wolter, Ulrich et al. 2004; Yuan, Pan et al. 2004), it modulates lipid metabolism (Kimura 2003), and the inhibition of platelet aggregation (Pace-Asciak, Hahn et al. 1995) among others effects. Fulda et al. (2004) described an antiproliferative effect of resveratrol involving a disruption of cell cycling at the three stages of initiation, promotion and progression and an induction of apoptosis of tumour cells (Chen, Tseng et al. 2004; Fulda and Debatin 2004). Moreover, Howitz et al. (2003) recently reported a new resveratrol property leading to an increase of yeast life span by cycling proteins of sirtuin family (Howitz, Bitterman et al. 2003). In spite of all the potentials benefits of resveratrol, it is not clear whether the drug reaches the proposed sites of action after oral ingestion, especially in humans. Although research continues to add potential benefits to the already long list of resveratrol effects, the information about the trans-resveratrol mechanism(s) of action(s) is still very poor. In order to add important information to clarify the resveratrol effects, the absorption process across the intestinal barrier and its bioavailability have been subjects of recent investigations. Several studies have shown that trans-resveratrol is extensively metabolised (Goldberg, Yan et al. 2003) and only trace amounts of unchanged resveratrol were found in the circulation (Walle, Hsieh et al. 2004). However, despite resveratrol being highly conjugated in glucuronides and sulfates in the intestine and liver, the trace amounts found in epithelial cells along the aerodigestive tract together with potentially active resveratrol metabolites may still produce cancer preventive and other effects.
Figure 1. Structure of trans-resveratrol
1.1. Resveratrol Quantification
Historically, the measurement of trans-resveratrol has required organic phase extraction followed by one or more high-performance liquid chromatographic steps. Several methods have been used for resveratrol measurements using different detection techniques (Soleas, Diamandis et al. 1997). The HPLC with UV, (Juan, Lamuela-Raventos et al. 1999; Zhu, Klironomos et al. 1999), DAD (Careri, Corradini et al. 2003) and electrochemical detection (Zhu, Huang et al. 2000) have been extensively used for trans-resveratrol quantification in human plasma, in red wines and plant sources for the determination of resveratrol content. As an alternative to HPLC based assay, capillary electrophoresis has been used for the analysis of trans-resveratrol and these methods have been reviewed recently (Gu, Chu et al. 2000). Although not as popular as HPLC, GC techniques, with or without MS detection, have been quite frequently employed. Soleas et al developed and validated an ultra sensitive assay for trans-resveratrol and its conjugates quantification in biological fluids using GC-MS and reaching a limit of quantification of 0.1 µg/l (Soleas, Yan et al. 2001). Although GC-MS analysis provides excellent sensitivity and specificity, derivatization of resveratrol is required prior to analysis in order to increase its thermal stability and volatibility. More recently, methods using LC-MS were reported for
trans-resveratrol quantification in wine (Gamoh and Nakashima 1999; Wang, Catana et al.
2002; Yu, Shin et al. 2002). Usually, samples require some pre-treatment and then they are separated using a reverse phase chromatography followed by MS detection. Resveratrol is frequently extracted from complex matrices using liquid-liquid
O O O H H H H H H H H H H H H
(Zhu, Klironomos et al. 1999) extraction and solid phase extraction (Juan, Lamuela-Raventos et al. 1999; Dominguez, Guillen et al. 2001).
1.2. Resveratrol Metabolism and Absorption
Despite the vast amount of research published on the potential efficacy of resveratrol, the information on the pharmacokinetics remains scarce. Goldberg showed that free resveratrol accounted for less than 2 % after oral administration of 25 mg/70 kg and it is present in urine and serum predominantly as glucuronide and sulfate conjugates (Goldberg, Yan et al. 2003). They also reported that the absorption of trans-resveratrol is very efficient as judged by peak serum concentration, area under the curve (4h) and urinary 24-h excretion (Goldberg, Yan et al. 2003). Studies performed with [14C]
trans-resveratrol in order to analyse the absorption, bioavailability and metabolism in humans have shown that only trace amounts of unchanged trans-resveratrol (< 5 ng/ml) could be detected in plasma after 25 mg oral dose (Walle, Hsieh et al. 2004). Most of the oral [14C]
trans-resveratrol was recovered in urine predominantly as glucuronide and sulfates
conjugates. Surprisingly, the hydrogenate of the aliphatic double bond was also found. The extremely rapid sulfate conjugation by intestine and liver appears to be the rate limiting step in resveratrol bioavailability (Walle, Hsieh et al. 2004).
To study intestinal absorption of trans-resveratrol rat small intestine model (Marier, Vachon et al. 2002), human intestinal Caco-2 cells models (Kaldas, Walle et al. 2003) or healthy human subjects (Goldberg, Yan et al. 2003; Walle, Hsieh et al. 2004), have been used. The absorption and metabolism studied using an isolated rat small intestine model (Kuhnle, Spencer et al. 2000) suggested that the resveratrol uptake is efficient, however only small amount of the absorbed compound is unmetabolised. It was found that the major metabolite detected on the basal side was the glucuronide conjugate of resveratrol indicating the susceptibility of resveratrol for glucuronidation during transfer across the rat intestine. Studies performed by Kaldas et al. using Caco-2 cells to measure transport and metabolism of resveratrol, suggested that trans-resveratrol is efficiently transported in a direction-independent manner. In contrast to the previous findings in rat, the metabolism of resveratrol in Caco-2 cells involves mainly sulfation and in a minor extent glucuronidation (Kaldas, Walle et al. 2003).
2. Drug Absorption
Despite the innovations in drug delivery systems in the last decades, the oral route still remains the most preferable administration route for most drugs (Balimane, Chong et al. 2000). Following oral administration, once in solution, the drug is susceptible to enzymatic and chemical degradation. The fraction of drug that appears intact in the systemic circulation is defined as bioavailability. The bioavailability is dependent on: 1) the fraction of drug absorbed over the mucosal membrane of the enterocytes; 2) the fraction of drug that escapes metabolism in the gut wall or first pass metabolism in intestinal epithelium; 3) and the fraction of the drug that escapes liver metabolism and the bilis excretion. The oral biavailability may be further reduced by efflux mechanisms.
One prerequisite for successful oral drug therapy is its intestinal absorption. Intestinal drug absorption is controlled by, (i) dissolution rate and solubility, determining how fast a drug reaches a maximum concentration (Cmax) in the luminal intestinal fluid, and (ii)
permeability coefficient (p), which relates to the rate at which the dissolved drug will cross the intestinal wall to reach the portal blood circulation (Bohets, Annaert et al. 2001). In Fig. 2 is represented the schematic illustration of the sequential events during the transfer of a drug molecule from a solid dosage in the gastrointestinal tact to the systemic circulation.
Figure 2. Schematic illustration of the factors influencing the oral drug absorption and
2.1. The Intestinal Epithelium
The human small intestine with approximately 2-6 m is divided into three sections: duodenum, jejunum and ileum. Approximately 90% of all absorption in the gastrointestinal tract occurs in the small intestine region. The intestinal mucosa consists of muscularis mucosa, the lamina propria, and the epithelial cell layer (Fig.3). The muscularis mucosa is a continuous sheet of smooth muscles, whose contraction may help the emptying of the cryp luminal contents (Hidalgo 2001). Lamina propria is a connective tissue containing numerous defensive cells that interact with foreign substances that enters this layer from gastrointestinal tract. The epithelial cell layer is a monolayer of heterogeneous cells which include mainly enterocytes or absorptive cells and undifferentiated cryp cells (Hidalgo 2001). The absorptive cells are highly polarized, columnar cells whose main function is absorption. The apical surface is characterized by closely packed microvilli about 0.5-1.5 µm in length and 0.1 µm in width, depending on species (Hidalgo 2001). The thickness of the apical membrane, 10-11 nm, is larger than that of most eukaryotic plasma membranes (Hidalgo 2001). In the apical membrane outer leaflet there is a fine filamentous surface of weakly acidic sulfated mucopolysaccharides directly connected to the apical membrane named glycocalyx. The apical membrane has a high (1,7:1) protein-to-lipid molar ratio and an abundance of glycolipids and cholesterol. The basal membrane of the absorption cells differs from the apical membrane in morphology, biochemical composition and function (Bouhours and Glickman 1977). Intestinal epithelial cells are joined at intercellular junction complexes. These junction complexes, which are approximately 0.5-2 nm wide, consists of three components; tight junctions, intermediate junctions and spot desmosomes (Hidalgo 2001).
Figure 3. Schematic of the villi ”fingers” covered by a monolayer of epithelial cells, separating the lumen from the blood capillary network (Madara 1991; Levy 1998).
2.2. Mechanism of Intestinal Drug Transport
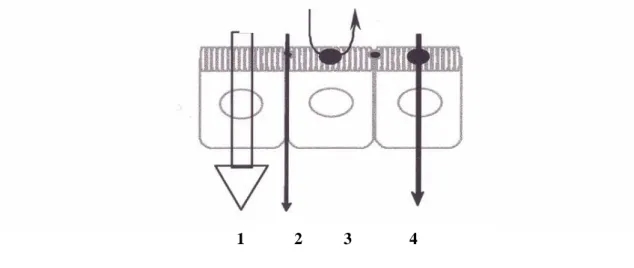
The intestinal mucosa is a selective permeability barrier. Drugs administered into the intestinal lumen can cross the mucosal epithelium different mechanisms, such as passive diffusion (paracellular and transcellular routes), carrier mediated transport and transcytosis (Balimane, Chong et al. 2000). In Fig. 4 it is represented a schematic illustration the different transport routes that are relevant for drug absorption.
Figure 4. Schematic illustration of the different transport routes that are relevant in drug absorption.
1. Passive transcellular and 2. Paracellular transport. 3. carrier mediated efflux transport, and 4. Carrier mediated active transport. The carrier mediate transport may also be situated on the basal membrane (not shown in the figure). Transcytotic pathway is not shown in figure.
2.2.1. Passive Transcellular Drug Transport
A drug molecule must penetrate the membrane of the epithelial cells in order to transverse the cell. Thus, passive transcellular transport consists in the drug penetration of the apical membrane, which is assumed to be followed by the diffusion of drug through the cytoplasm of the cells, and subsequent permeation through the basal membrane. The passive transcellular transport is largely determined by the biophysical properties of the cells membrane and by the physicochemical properties of an orally administered compound (Balimane, Chong et al. 2000). Moreover, for all this process the physicochemical properties of the compound, which include molecular weight, pKa, lipophilicity (logP/log D), charge, ionization, solubility and molecular size are the major determinants (Balimane, Chong et al. 2000). Transcellular transport is the main route of permeation of the hydrophobic compounds (Hidalgo 2001). Very lipophilic molecules may became trapped in the plasma membrane or their transport may require lateral diffusion through the cells interior. The log P value, usually provide an indirect information of the extend of passive transcellular transport for the compounds that are not transported actively (Balimane, Chong et al. 2000).
2.2.2. Passive Paracellular Drug Transport
The paracellular pathway is an aqueous intracellular route across the epithelium, important for the penetration of hydrophilic compounds (Hidalgo 2001). Drugs of small to moderate molecular weights can penetrate the intestinal epithelium due to the electrochemical potential gradients derived from differences in concentrations, electrical potential and hydrostatic pressure between the two sides of epithelium (Ballard, Hunter et al. 1995) The rate-limiting step for the paracellular drug transport is, therefore, the passage through the narrow pores of the tight-junctions (Ballard, Hunter et al. 1995)
2.2.3. Carrier Mediated Transport
Although a vast number of drugs cross the intestinal epithelium by passive diffusion, there are evidences that some molecules (i.e. amino acids, oligopeptides, monosacharides, inorganic phosphate monocarboxylic acids, bile acids and several water soluble vitamins) are transported across the epithelial barrier by carrier-mediated membrane transport mechanisms (Tsuji and Tamai 1996). Carrier mediated transport can be active (energy dependent) or facilitated (independent of energy) (Dubyak 2004). Although the influence on the in vivo drug absorption is still largely unexplored an increased number of active transporters such as ABC-transporters, that may have an impact on oral absorption, are being identified.
In order to prevent unwanted entry of compounds into the body, carriers are substrate specific. However the substrate specificity is not absolute, and carrier mediated transport is available to a limited number of drugs and some drugs are even modified in order to use the transporters to cross the intestinal barrier (Tsuji and Tamai 1996). Numerous transporters have been described during the last few years, but this work will be focus on only some influx transporters of natural products and some efflux transporters.
2.2.3.1. Carrier Mediated Influx Transport
Influx transporters can bind compounds and translocate them across the membrane into the cells. The compounds that are substrates for these transporters in the intestine exhibit higher absorption than expected from their diffusion across cells membranes. A list of substrates of different transporters, which highlights the diversity of molecular structures
capable of interacting with transporters, was presented in a review from Tsuji and Tamai (1996). Herein, are focused the following proteins: Organic anion-transporting polypeptides; Organic cationic transporters; and the proton-dependent oligopeptides transporters.
Organic anion-transporting polypeptides (OATPs) are polyspecific membrane transporters that mediate sodium independent transmembrane transport of a wide range of amphipatic organic compounds, including organic anions, bile salts, bilirrubin, anionic oligopeptides and drugs, such as pravastatin and digoxin and other xenobiotics (Kunta and Sinko 2004). Some of the OATPs characterized so far are shown to be expressed exclusively at the basal membrane of hepatocytes (Kunta and Sinko 2004). However there are some OATPs expressed in extra hepatic organs including the apical membrane of small intestine, renal proximal tubules and both membranes of brain capillary endothelium, placenta, testis, choroid plexus, lung and heart (Hagenbuch and Meier 2003; Kunta and Sinko 2004).
Organic cationic transporters (OCT) are a multispecific family that transport organic cations, as well as organic anions (Wu, Huang et al. 1999). Due to is multispecificity it may play an important role in the handling of a wide variety of structurally diverse xenobiotics and endobiotics in tissues such as the kidney, liver, intestine, heart and placenta (Pritchard and Miller 1993; Koepsell 2004). There are several transporters, identified so far, as members of this family and their functions are Na+, Cl- and H+
independent, with exception of a OCTN2 (Wu, Prasad et al. 1998). OCTN2 transports organic cations without Na+ involvement, but it transports carnitine in the presence of Na+
(Wu, Huang et al. 1999).Wu et al. (1999) reported that OCTN2 mediates the transport of cations such as tetraethylammonium (TEA) and drugs such as pyrilamine, valproate and verapamil which confer to OCTN2 an important pharmacological role. Recently a polymorphism in OCTs was associated with an increased risk of adverse drug reactions in some patients (Koepsell 2004).
The proton-dependent oligopeptide transporters (POT) (Fei, Ganapathy et al. 1998) are expressed in human intestine (Liang, Fei et al. 1995). Among the POT family, only two members are shown to display transport activity: PepT1 and PepT2. PepT1 is a H+/peptide co-transporter which utilizes the downward proton gradient from the intestinal
lumen (pH 5.5- 6.0) into the cells (pH 7.0) (Kunta and Sinko 2004) and is involved in the transport of neutral, mono or polyvalently charged peptides (Daniel 2004). The structure similarity of a variety of drugs with the basic structure of di-or tripeptides explains the transport of B-lactam antibiotics, rennin inhibitors, angiotensin converting enzyme inhibitors, aminocephalosporins and aminopenicillins by PepT1 on the apical side of enterocytes (Tsuji and Tamai 1996). The proton gradient is believed to be produced by Na+/H+ exchange at the apical cell surface (Meredith and Boyd 2000).
2.2.3.2. Mammalian Drug Efflux Transporters
The efflux proteins limit the intracellular exposure to xenobiotics by pumping these agents out of the cells (Borst and Elferink 2002). The ATP-binding cassette (ABC) superfamily of transporters are efflux proteins, in an active ATP-dependent manner, with a well defined role in the transport of clinically relevant drugs. The drugs pharmacological properties affected by ABC transporters include the oral bioavailability, hepatobiliary, direct intestinal and urinary excretion, drug metabolites and conjugates (Schinkel and Jonker 2003). These transporters are designated as multidrug resistance since they limit penetration of drugs in some pharmacological sanctuaries, such as the brain, testis and fetus, determining to a large extent the clinical usefulness, side effects and toxicity risk of drugs (Schinkel and Jonker 2003). Multidrug resistance is a significant obstacle to the success of chemotherapy in many cancers (Borst and Elferink 2002). The family of ABC transporters is extensive and functionally diverse, but herein we will limit ourselves to the following proteins: P-Glycoprotein (Pgp), multi-drug resistance proteins (MRP 1-5) and breast cancer resistance protein (BCRP), all of them located in plasma membrane and mediating the efflux of compounds from the cells in an ATP-dependent manner.
2.2.3.2.1. Pgp
Pgp, the most studied member of the ABC-transporters is the product of the MRD-1 gene (Tsuji and Tamai 1996). Functionally, Pgp is characterised by a broad substract specificity, including anticancer calcium channel blockers, immunosuppressive agents, etc (Terao, Hisanaga et al. 1996; Janice Hunter 1997; Kunta and Sinko 2004). The most efficiently transported molecules are uncharged or weakly basic molecules. It was also observed that hydrophobicity, planar aromatic rings and the presence of tertiary amino
groups favour substrate interactions with Pgp (Seelig 1998; Seelig and Landwojtowicz 2000). However, it was demonstrated that some acid, i.e. phenitoin are transported by Pgp (Potschka and Loscher 2001). MDR-1 Pgp is mainly localized in the apical membrane of the epithelial cells in the body (Schinkel and Jonker 2003). It has blood-brain barrier, blood-testis barrier and fetal-maternal barrier functions, protecting relatively sensitive and critical tissues from xenotoxic compounds (Schinkel and Jonker 2003). MDR-1 Pgp is very abundant in the bile canicular membrane of hepatocytes, in the apical membrane of kidney proximal tubes and in the apical membrane of small intestinal epithelium. One of the predicted functions for the MDR-1 type Pgp in these locations is the extrusion of compounds from the liver hepatocytes into the bile and from the intestinal epithelium into the intestinal lumen, which restrict the rate at which substrate compounds present in intestinal lumen enter the blood stream (Terao, Hisanaga et al. 1996). Shapiro & Ling (1998) showed that Pgp is capable of transporting one Rhodamine 123 molecule per ATP molecule hydrolyzed and found evidences for at least two sites for drug binding that interact in a positively cooperative manner. There are evidences that Pgp function may be integrated with drug metabolism. Several drugs are common substrates for Pgp and cytochrome P450 3A (Hochman, Chiba et al. 2000; Johnson, Charman et al. 2001; Cummins, Salphati et al. 2003) which support the role of Pgp in modulating the extent of intestinal metabolism by removal of the CYP 3A4 generated metabolites from the intracellular compartment (Hochman, Chiba et al. 2000; Houston and Kenworthy 2000; Cummins, Salphati et al. 2003).
The first identified inhibitors of Pgp, like the calcium channel blocker verapamil or the immunosuppressive agent Cyclosporin A are transported substracts of P-gp, suggesting that they act as competitive inhibitors. However, other inhibitors, SDZ PSC 833 , GF120918 and LY335979 are under development to be used in humans (Bardelmeijer, Ouwehand et al. 2004).
2.2.3.2.2. MRP 1-5
MRP-1 functions as a co-transporter of amphipatic organic anions. It can transport hydrophobic drugs or other compounds that are conjugated or complexed to the anionic tripeptide, gluthatione (GSH), to glucuronic acid or to sulfate (Leier, Jedlitschky et al. 1994; Muller, Meijer et al. 1994; Evers, Zaman et al. 1996; Keppler, Leier et al. 1997; Gerk and Vore 2002). In contrast to Pgp, MRP-1 is localized on the basal membrane of the
epithelial cell layers (Evers, Zaman et al. 1996) and its substrates are therefore, transported towards the basal side of epithelia. Even though MRP-1 is localized predominantly to the basal membrane of epithelial cells, it still has important pharmacological and toxicological functions (Borst and Elferink 2002). Some studies showed that MRP-1 could be involved in extrusion of some compounds administered intravenously and intraperitoneally that should be toxic in the absence of this transporter (Schinkel and Jonker 2003). Mice lacking Mrp-1 are sensitive to ectoposide (Borst and Elferink 2002). A variety of inhibitors of MRP-1 have been described, such as leucotrien-4 analogue MK571, S-decylglutathione, sulfinpyrazone and Pgp inhibitors like cyclosporine A and PSC 833, with reasonable cellular penetration but with low affinity and specificity (Leier, Jedlitschky et al. 1994)
MRP-2 appears to mediate ATP-dependent transport of various compounds, including pravastatin, methotrexate, irinotecan etc, and products from phase II drug metabolism such as glucuronides, sulfates and gluthatione conjugates (Kunta and Sinko 2004). Like MRP-1, MRP-2 is primarily an organic anion transporter, it seems very likely that weakly basic drugs are co-transported with GSH by MRP-2 (Gerk and Vore 2002; Schinkel and Jonker 2003); MRP-2 is expressed in the canalicular membrane of hepatocytes, on the apical plasma membrane of kidney (Konig, Nies et al. 1999; Kunta and Sinko 2004); and in the luminal membrane of the small intestine epithelium (Gerk and Vore 2002; Schinkel and Jonker 2003). In addition MRP-2 was also detected in brain endothelial cells and placenta (St-Pierre, Serrano et al. 2000; Kusuhara and Sugiyama 2002). Here there is fairly extensive overlap between MRP-2 and MDR-1 Pgp tissue distribution, so it is likely that these two proteins have a considerable overlap on pharmacological and toxicological protective functions. Its major physiological function is to excrete waste/toxic by-products from the body and it could limit its oral uptake from the body. Alterations in MRP-2 expression and/or function could have a variety of clinically important consequences (Gerk and Vore 2002). It can impair normal hepatic functions (Konig, Nies et al. 1999) including the capacity to excrete endogenous compounds, such as conjugates of bilirrubin, steroids and leucotrienes and it can change the clearance of many clinical important drugs including cancer chemotherapeutics, antibodies as well as many toxins and their conjugates (Gerk and Vore 2002). MK571, cyclosporine A, probenecid and PSC 833 were found to be inhibitors of MRP-2 (Schinkel and Jonker 2003). These compounds have considerable activity against MRP-1 (Konig, Nies et al. 1999).
MRP-3 is the MRP family member most closely related to MRP-1 and like MRP-1 is present on the basal membrane of polarized cells (Kool, van der Linden et al. 1999). It is a quite broad specificity organic anion transporter, with considerable, but not complete, overlap in substrates with MRP-1 and MRP-2. MRP-3 is expressed in liver, small and large intestine, adrenal gland and to a lower extent in pancreas and kidney (Kool, de Haas et al. 1997; Kiuchi, Suzuki et al. 1998) and it seems unable to transport GSH (Borst and Elferink 2002). Based on the substrate specificity and tissue distribution MRP-3 may be involved in cholehepatic and enterohepatic circulation of the bile salts and may also be involved in toxicological defence by eliminating a range of toxic organic anions, notably glucuronide conjugates, from various epithelial cell types (Schinkel and Jonker 2003);(Keppler, Leier et al. 1997; Borst and Elferink 2002).
The research performed with MRP-4 and MRP-5 is still in its infancy, however it is already known that MRP-5 and MRP-4 have similar structure (Borst, Evers et al. 1999). They have the ability to transport cyclic nucleotides and nucleotides analogs (Borst and Elferink 2002). Different studies with RNA expression showed that MRP-4 and 5 are widely expressed through most tissues tested, like kidney, bladder, pancreas, spleen, thymus, testis, ovary and small intestine (Schinkel and Jonker 2003). There are some evidences that MRP-4 is involved in efflux transport of antiviral agent and AMP analogue 9-(2-phosphonylmethoxyethyl) adenine (PMEA) and azidothymidine (AZT) and anticancer drugs 6-mercaptopurine (6-MP) and thioguanine (TG). MRP-5 expressed in MDCK-II cells, localized primarily to the basal membrane, could mediate the efflux of GS-DNP and GSH. It was also observed that PMEA and 6-MP are also extruded from cells by MRP- 5 (Schinkel and Jonker 2003).
2.2.3.2.3. BCRP
Breast cancer resistance protein, similar to Pgp, is a multidrug resistance protein widely distributed in the body, including the apical membrane of the small and large intestine and the canalicular membrane of the hepatocytes (Maliepaard, Scheffer et al. 2001). Because the gene was isolated from a breast cancer cell line it was called the breast cancer resistance protein (BCRP) gene, but there is no evidence that it is specific for breast cancer cells (Schinkel and Jonker 2003). It was demonstrated that BCRP offer resistance to intestinal absorption of anti-cancer agents (Kunta and Sinko 2004). Some studies in
canine and porcine epithelial cells lines expressing bcrp1 gene indicated that this gene is localised on the apical membrane of the polarised cells (Jonker, Smit et al. 2000). BCRP was detected in the human placental syncytiotrophoblast plasma membrane facing the maternal bloodstream, in the bile canicular membrane of the liver hepatocytes and in the luminal membrane of villous epithelial cells in the small and large intestine, locations shared with MRD1 Pgp (Schinkel and Jonker 2003). BCRP was not detected in human erythrocytes, leucocytes or platelets (Maliepaard, Scheffer et al. 2001), but it was detected in the human hematopoietic compartment (Scharenberg, Harkey et al. 2002). The tissue distribution of BCRP show extensive overlap with Pgp, suggesting that BCRP might have a similar role as Pgp in pharmacological handling of substrates drugs and in the toxicological protective role. Intestinal bcrp1 appears to play a role in limiting re-uptake of drugs from intestine. Interestingly, Taipalensuu et al. (2001) found that BCRP and MRP-2 transcripts were more abundant in jejunum than MDR-1 transcripts. Wether the respective protein levels reflect these RNA levels is not yet certain.
3. Methods for Studying Intestinal Drug Absorption
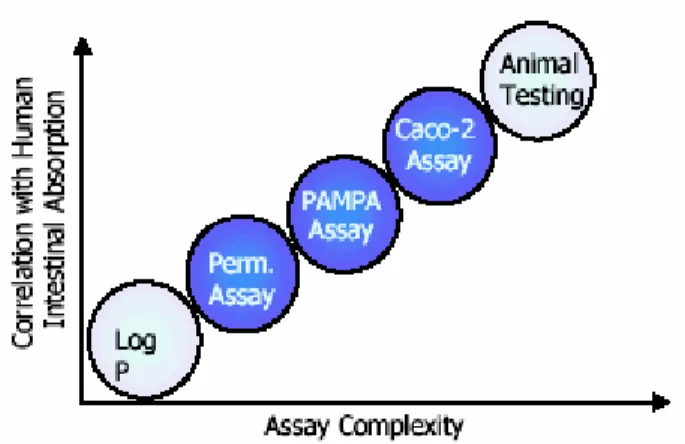
In the characterization of intestinal drug transport a number of experimental approaches can be applied. In general, drug absorption in animals is believed to be a good predictor of human absorption, however the extrapolation of animal permeability/absorption data to human should be performed with caution, because of the potential species differences. A simple uptake/efflux study can be performed in whole cells either adherent or in suspension or in membrane vesicles for a rapid screening of substrates or/and inhibitors involved in drug efflux interactions (Balimane, Chong et al. 2000; Hidalgo 2001). Despite the obvious difficulties associated with trying to reproduce in vitro all the characteristics of the intestinal mucosa, various systems have been developed which mimic, to varying degrees the relevant barrier properties of the intestinal mucosa (Balimane, Chong et al. 2000; Hidalgo 2001). These systems include excised tissues, cultured cells (e.g. Caco-2, LLC-PK1 and MDCK), physicochemical systems (e.g. Log D/P, immobilized artificial membranes, parallel artificial membranes permeation assays-PAMP) and computational (in silico) methods. In Fig. 5 it is illustrated the correlation between the complexity of some assays used to evaluate drug absorption and actual absorption in humans.
Figure 5: Assay Complexity vs Correlation with Human Absorption. The permeability assay uses
an artificial membrane composed of hexadecane. Taken from: http://www.millipore.com/publications.nsf
Below are described the most commonly used methods to evaluate intestinal drug absorption potential:
3.1. Excised tissues
Excised tissues have been used to explore the mechanisms of drug and nutrients absorption. The solution containing the drug is applied to one side of the tissue (apical or basal) and the rate of drug absorption is determined by measuring either the disappearance of the drug in the dosing solution or the appearance of drug in the other side of the membrane. Some of the more widely used preparations for absorption and permeability studies are: isolated intestinal segments, everted sacs, intestinal rings, stripped and unstripped mucosal sheets (Balimane, Chong et al. 2000; Hidalgo 2001). Although its limited viability, the excised tissues preparations share two important advantages: the preservation of the architectural integrity and the ability to determine absorption across different gastrointestinal segments.
3.2. Cells-based in vitro studies
A variety of cell models that mimic in vivo human intestinal epithelium have been developed. The commonly used cell lines are Caco-2, Madin-Darby Canine Kidney (MDCK) and LLC-PK1 cells, which are porcine kidney epithelial cells line. Human
immortalized (tumor) cells grow rapidly into confluent monolayers followed by spontaneous differentiation providing the ideal system for transport studies. Caco-2 cells have been extensively characterized and results from different groups suggest a strong correlation between in vitro permeability coefficient in Caco-2 cells and in vivo human absorption (Artursson, Palm et al. 2001). Caco-2 cells exhibit morphological features of small intestinal cells ( e.g. tight intercellular junctions, microvilli) and express intestinal transporters (Pgp, PEPT1, ABC transporters) and intestinal enzymes (sulfotransferases, glucuronotransferases and CYP P450 enzymes) (Meunier, Bourrie et al. 1995). Due to a low expression of carriers in this cells line, the prediction of carrier mediated transport in humans requires the usage of a scaling factor (Artursson, Palm et al. 2001). Moreover since Caco-2 cells are very heterogenic, consisting of several subpopulations (Kissel 1995) it is difficult to compare the absolute permeability coefficient of individual compounds described in literature, particularly with compounds that are paracellular permeated (Balimane, Chong et al. 2000; Hidalgo 2001). Although this inter-laboratory variability’s, within the same laboratory, completely absorbed compounds can be discriminated from poorly absorbed compounds (Balimane, Chong et al. 2000; Hidalgo 2001). MCDK cells have been receiving attention as an alternative to Caco-2 cells for transport studies. Some authors report that the permeability obtained with MDCK correlates well with Caco-2 cells absorption (Irvine, Takahashi et al. 1999). The major advantage of MDCK cells over Caco-2 cells is the shorter culture times, nevertheless it should be noted that MDCK cells derives from dog kidney cells, this interspecies variation in transporters expression could be observed (Putnam, Pan et al. 2002; Putnam, Ramanathan et al. 2002). In Fig. 6 it is shown the chambers used for growing Caco-2 cells and other cells cultures for drug transport experiments.
Figure 6. Schematic illustration of the chamber used for growing cells used for drug transport studies.
3.3. Artificial Membrane and In Silico Methods
In order to improve the throughput, the reproducibility and to avoid biological systems, several methods involving no biological preparations have been used to model intestinal permeability. These methods have, nevertheless, some disadvantages such as lack of enzymes, transporters and paracellular pathways.
One such method is immobilized artificial membranes (IAM), which are columns with lipids immobilized to mimic the lipid environment of the cellular membrane. Compounds that interacts with the lipid phase have longer retention in the column and should have good permeability across the lipid bilayer (Hidalgo 2001).
Another system used is the Parallel Artificial Membrane Permeation Assay (PAMPA) which consists of filters and solvents that mimic the cellular membrane. The compound is applied on the top filter and rate of appearance on the bottom wells should reflect the diffusion across the lipid layer (Hidalgo 2001).
Computational or virtual screening to assess the absorption potential of the compounds has been receiving more and more attention in the last few years. In silico models involve approaches from relative simple quantitative structure property relationships (QSPR) to the complex physiological based pharmacokinetics models, that could be used to specifically direct the chemical synthesis (Bohets, Annaert et al. 2001). Whichever the approach used for model building, to be valid, it should be based on experimental data obtained from a wide range of structurally diverse compounds
4. Aims
The overall aim of this work was to study the transport of trans-resveratrol across intestinal cells.
Specific aims were,
• Develop a LC-MSD method for trans-resveratrol quantification.
• Study the transport of trans-resveratrol across human adenocarcinoma colonic cell line Caco-2.
• Explore the transporters involved in trans-resveratrol efflux across human adenocarcinoma colonic cell line Caco-2.
• Investigate the trans-resveratrol conjugates transport across human adenocarcinoma colonic cell line Caco-2.
CHAPTER II
MATERIAL AND METHODS
1. Reagents and Radiolabeled Material
Trans-resveratrol was purchased from Abatra Technology Co. LTD-China. [vinyl-1-14C] trans-resveratrol was synthesised by Amersham Biosciences. 2,Dinitrophenol (DNP),
4-Nitophenol, 3’phosphoadenosine-5’-phosphosulfate (PAPS) and verapamil were purchased from Sigma (St. Louis, MO). MK571 was purchased from Calbiochem. [3H]
sorbitol was purchased from American Radiolabeled Chemicals Inc. Compounds were dissolved in DMSO (final concentration <1%) and diluted in Hank’s balanced salt solution (HBSS), pH 7,4. Acetonitrile (ACN) and methanol were purchased from J.T. Baker. MilliQ ultra pure water was obtained in house. HBSS had the following composition (mM): 137 NaCl, 5 KCl, 0.8 MgSO4, 0.33 Na2HPO4, 0.44 KH2PO4, 0.25 CaCl2, 1.0 MgCl2, 0.15
Tris.HCl and 1.0 sodium Butyrate, pH 7.4.
All of the above were stored according to the manufacturers instructions and were of at least standard laboratory grade.
2. Caco-2
The human cells line was obtained from “Deutsche Sammlung von Mikroorganismen und Zellkulturen” (ACC-111; Passages 27-44) and maintained in a controlled humidified atmosphere of air with 5 % CO2 at 37ºC, as previously described (Vieira-Coelho and Soares-Da-Silva 1998).
2.1. Cell Culture
Caco-2 cells (passages-27-52) were grown in minimal essential medium (Sigma Chemical, St Louis, MO) supplemented with 100 U/ml penicillin G, 0.25 µg/ml amphotericin B and 100 µg/ml streptomycin (Sigma Chemical), 20% of fetal bovine serum (Sigma Chemical) and 25 mM HEPES (Sigma Chemical). For subculturing the cells were dissociated with 0.05% trypsin-EDTA, split 1:4, and subcultured in 21 cm2 plates (Costar,
3. Transport of Trans-Resveratrol across Caco-2 Cells
On the day of the experiment, the growing medium was aspirated, the cells were washed with HBSS at 4ºC and then the cells monolayer was pre-incubated for 10 min in HBSS at 37ºC. Transport experiments were performed in collagen treated 0.4 µm polycarbonate filter supports (12 mm ID, transwell, Costar-Corning) with trans-resveratrol being applied from the apical (AP) or the basal (BL) cell border. The upper and lower chambers contained 400 and 1000 µl of HBSS, respectively. For the apical transport trans-resveratrol was added to the upper chamber; for the basal transport substrate was added to the lower chamber. Experiments were started by the addition trans-resveratrol. For inhibition studies, the compounds of interest were applied to the upper and the lower chamber during the pre-incubation period. At different incubation times, 250 µl and 100 µl of medium were taken, from the lower and upper chambers, respectively, to determine the apical and basal transport. At each time point the same volume of medium removed was added to each compartment. During the pre-incubation and incubation periods cells were continuously under agitation.
4. Influx of Trans-Resveratrol into Caco-2 Cells
The influx studies were performed in 24-well plastic cell culture clusters (16 mm ID, Costar-Corning) with the trans-resveratrol being applied from the apical cell border. On the day of the experiment the growing medium was aspirated and the cells were washed with HBSS at 4ºC. The cells were pre-incubated (10-30 min) with 500 µl of HBSS with or without the inhibitor under study. The uptake experiments were initiated by the addition of
trans-resveratrol or [14C] trans-resveratrol. After the incubation period, the accumulation of trans-resveratrol into the cells was determined by rapid removal of uptake solution
followed by two rapid washes with cold HBSS (1500 µL) and then 500 µL methanol were added to extract the compound from cells. After a 2 h incubation at room temperature 250 µl of samples were collected and the some amount of HBSS was added to each sample. The samples were then injected onto LC-MS. In experiments performed with [14C]
trans-resveratrol, cells were incubated with 500 µl of 0.1% Triton X-100 in 5 mM Tris.HCl overnight, to extract the compound from the cells, before radioactivity counting. After overnight extraction 250 µl were used to measure the radioactivity. Cells monolayer
contained approximately 150 µg total protein per cm2, as determined by BioRad protein assay.
5. Efflux of Resveratrol from the Caco-2 Cells
In the experiments designed to evaluate the efflux of trans-resveratrol intracellular, cells cultured in 24-well plastic cell culture clusters (16 mm ID, Costar-Corning) were incubated with 1, 3, 10, 30, 100 and 300 µM of trans-resveratrol. On the day of the experiment the growing medium was aspirated and the cells were washed with HBSS at 4ºC. The cells were pre-incubated (10 min) with 500 µl of HBSS at 37ºC in the presence and in the absence of the inhibitors under study and then 1 to 300 µM of trans-resveratrol was added for the next 12 minutes. The incubation was then terminated on ice, the incubation medium was removed and the cells were washed with 2 ml of ice-cold HBSS. Thereafter 0.5 ml of HBSS, with or without the inhibitor under study, was added to each well and cells were returned to the water bath at 37º C, to monitor the trans-resveratrol efflux. At the end of the efflux collection period, the medium was removed and 500 µl of methanol was added to the cells to extract the remaining compound inside the cells. Thereafter, the cells were kept at room temperature for 2 hours and then 250 µl of medium was collected and added to 250 µl HBSS. Trans-resveratrol was then measured by LC-MS.
In the experiments aimed to evaluate the efflux of trans-resveratrol intracellular through the apical and basal side, cells cultured in collagen treated 0.4 µm polycarbonate filter supports (12 mm ID, transwell, Costar-Corning) were incubated with 1 µM of trans-resveratrol added to the apical or basal side of the transwell. After 12 min the incubation was then terminated on ice, the incubation medium was removed and the cells were washed with 3 ml of ice-cold HBSS. Thereafter 1 ml and 0.5 ml of HBSS was added to the basal and apical side, respectively, and cells were returned to the water bath at 37ºC to monitor the trans-resveratrol efflux over the next 24 minutes, in the absence or presence of inhibitor. The samples were collected at same time on the basal and apical side of the transwell and injected onto the HPLC-MS. The trans-resveratrol efflux was quantified and the trans-resveratrol sulfates were identified based on peak area, using LC-MS.
6. Analysis of Trans-Resveratrol Sulfates in Caco-2 Cell Homogenates
Cells were homogenised in HBSS with a Heidolph DIAX 900 (Teflon/glass) homogeniser and kept continuously in ice. Aliquots of 100 µL (1 mg/ml of protein) cells homogenates plus 100 µl of incubation medium containing PAPS, in presence or absence of MK571 were pre-incubated for 10 min. Thereafter trans-resveratrol was added to the medium for 12 min. During incubation the cells homogenates were continuously shaken. The reaction was stopped by adding 100 µl methanol to 100 µl of cells homogenates after 30 and 60 min incubation. The samples were then centrifuged and filtered to be injected onto LC-MSD.
7. Bio-analytical Method Validation
A method was validated in order to provide an accurate and reliable assay for the quantification of trans-resveratrol in HBSS. This should include appropriate chromatographic conditions, evidence of the lack of significant interference in blank matrix, preliminary indication of a mathematically definable concentration-response relationship and preliminary indications of adequate sensitivity for the intended purpose.
7.1. Reference Solutions
Two separate stock solutions (one for calibration standards and another for quality controls-QC) of trans-resveratrol were prepared by accurately weighing an appropriate amount of compound and dissolving it in ACN to obtain 10 µM solutions. Trans-resveratrol stock solutions were prepared freshly every day.
7.2. Calibration Standards
The calibration solutions were prepared with HBSS:Methanol (50:50, v:v) by dilution of the calibration reference stock solution to have 2000, 1000, 500, 250, 100, 50, 25, 10 nM solutions.
7.3. Quality Controls
The QC solutions were prepared with HBSS medium:Methanol (50:50, v:v) by dilution of the QC stock solution to have 2000, 1000, 250, 50, 25, 10 nM solutions.
7.4. Validation Parameters
Selectivity is the ability of the assay to assess unequivocally the analyte in the presence of components that are expected to be present. This parameter was assessed by injecting a blank sample prepared in the same conditions of the experiment but without trans-resveratrol.
7.4.1. Carryover
Carryover was assessed on the chromatographic system by making a single injection of an extracted blank matrix after each of the last three highest concentrations of the calibration standards (500, 1000 and 2000 nM).
7.4.2. Working and Linear Range
The working range of an analytical procedure is the interval between the upper and the lower concentration of analyte in the sample for which it has been demonstrated that the analytical procedure has a suitable level of precision and accuracy. The linearity was assessed from the calibration curves in the range over which the analyte was determined. The response function is the simplest mathematical relationship for signal response versus concentration. The working and linear range was evaluated using three calibration curves obtained from 3 separated runs (calibration points used for inter-batch accuracy and precision assessment were used to evaluate the working and linear range). The calibration curve consists of eight calibration standards (2000, 1000, 500, 250, 100, 50, 25, 10 nM) covering the range including the lower limit of quantification (LLOQ) and upper limit of quantification (ULOQ).
7.4.3. Precision and Accuracy
The accuracy of an analytical procedure expresses the distance from agreement between the value, which is accepted either as a conventional true value or an accepted reference value, and the determined value. For analytical samples accuracy is determined by replicate analysis of samples containing a known amount of the analyte. The accuracy of the analytical procedure was measured during a single analytical run (Intra-batch) and between runs (Inter-batch) which measure the accuracy with the time (in different days). The precision of an analytical procedure expresses the distance from agreement between a series of measurements obtained from multiple sampling of the same homogeneous sample under the prescribed conditions. The precision can be further divided into repeatability (Intra-batch) and intermediate precision (Inter-batch) assessment. Repeatability expresses the precision under the same operating conditions over a short interval of time, during a single analytical run (Intra-batch). The intermediate precision expresses within laboratory variations (Inter-batch) that will be measured in different days.
7.4.3.1. Intra-batch Precision and Accuracy
The precision and the accuracy of the results for samples were assessed from 5 replicate validation standards at 6 concentrations across the proposed analytical range (10 nM to 2000 nM) along with a full set of calibration standards, in the same analytical run. The accuracy and precision across this working range were assayed for the concentrations of 2000, 1000, 250, 50, 25 and 10 nM
7.4.3.2. Inter-batch Precision and Accuracy
The inter-batch precision and accuracy were assessed in 3 separate analytical runs, in 3 different days. The inter-batch accuracy and precision across this working range were assayed for the concentrations of 2000, 1000, 250, 50, 25 and 10 nM. This includes the intra-batch run (section 3.7.4.3.1.).
7.4.4. Stability
Analyte stability in a matrix is a function of the storage conditions and the chemical properties of the analyte. The stability of the analyte was evaluated in HBSS after an incubation period of 30 and 60 minutes at 37 ºC.
Standards were prepared at two concentrations (100 and 1000 nM). Four aliquots at each concentration level were injected immediately after preparation. Other four aliquots at each concentration level were kept at 37ºC under agitation. After storage at the referred conditions, the samples were compared against the ones freshly prepared.
8. HPLC-MSD Method
Sample analysis was performed using LC-(AP-ESI) MS (HP 1100 Series, Agilent Technologies) with negative ion detection. Separation was performed on a Zorbax SB-C18,
3 µm, 30 x 4.6 mm, column (Agilent ) using a mobile phase A: water and B: methanol, with gradient conditions of 65% of A and 35% of B at 0 min and 100% B at 6 min. Selected ion monitoring (SIM) with the detection of trans-resveratrol was used for quantification: m/z 227. To measure the resveratrol sulfate it was checked the m/z of 307 and for trans-resveratrol glucuronide it was checked the m/z of 403. For maximal sensitivity, the fragment energy was set to 100 V and further settings were 3500 eV for the capillary voltage, 350ºC nebulizer gas temperature and 40 psi nebulizer pressure. The limit of quantification was 0.01 µM.
9. Radiolabeled Material Detection
The radioactivity was measured by liquid scintillation counting (Wallac) using a single mode detection for [14C]-trans-resveratrol. The instrument was set for counting with a
precision of 0.2.
10. Calculations and Statistics
10.1. Apparent Permeability Coefficients
Where V is the volume of the solution in the receiving compartment, A is the membrane surface area, Co is the initial concentration and dC/dt is the change in the drug
concentration in the receiver solution over the time (Balimane, Chong et al. 2000).
10.2. Analysis Methods
Analyte concentrations in unknown samples are typically evaluated by using a regression results obtained from a calibration curve. The linear regression is the commonly adopted model. However the condition of equal variance of the calibration points, homoscedasticity, is frequently not met for the analytical data. The analysis of homoscedasticity was performed according the method described by (Almeida, Castel-Branco et al. 2002).
10.2.1. Homoscedasticity
The homoscedasticity assumption can be tested in any linear regression analysis. It can be performed by plotting the residuals versus concentration and by applying the F-test in accordance with the following:
ftab (f1,f2;0,99)
Where the experimental f is expressed as the ratio between the variance obtained at the lowest (S1) and the highest (S2) concentration level of the working range, and the table
F-value is obtained from the F-table at the confidence level of 99% for f1=f2=(n-1) degrees of
freedom.
If the variance is constant at the all calibration range, residuals will be more a less randomly around the x-axis and fexp will be lower than the ftab.
dt
dC
x
AC
V
P
app 0=
1 2 2 2 expS
S
f
=
10.3. Simple and Weighted Linear Regression
The linear regression was aimed to find a deterministic model which allows the prediction of values assumed by the dependent variable (y) when independent variable (xn) is known
or fixed. Since the experimental values fit the mathematical model, the sum of squares of deviations between the data and the assumed model should be minimal. This is called the “method of least squares” and the expression to be minimized is:
In the simplest linear regression model the relationship between the variables is stabilised by the straight line, mathematically expressed by y=a+bx where y is the dependent variable, x is the independent variable, a is the y- intercept of the regression equation and b is the slope of the equation. The simple least squares method considers that for each value of x there is subpopulation of y-values normally distributed, that the means of all the subpopulations of y lie on the same straight line and that all the subpopulation of y-values have the same variance. However, it is very common an increase of variance as a function of the concentration. To eliminate the influence on the calibration line of larger deviation present at higher concentrations and smaller deviations associated to the lower concentrations, it could be used the weighted least squares linear regression. The expression to be minimized adopting the following formula:
Where σ2 is the variance of y.
The most appropriated weighting factor ωi, is the inverse of variance. However this
weighting is impracticable, and other empirical weights based on x- variable or y variable may provide simpler approximation of variance.
2
)
(
∑
−
=
y
observedy
predictedss
∑
− = 2 2 ) ( i predicted observed y y ssσ
10.3.1. Choice the Weighting Factor
In light of evidence of the heteroscedasticity situation the weighting factor, ωi, should be
chosen. As it is not suitable to calculate the inverse of variance routinely, taking into account that it requires several determinations for each calibration point and a fresh calibration line should be performed at each time that the method is used, other empirical weights such as 2 1
1
x
, x 1 ,1
2x
, 211
y
, y 1 ,1
2y
, should be studied.The better weighting factor should be studied according to the percentage of relative error (% RE), which compares the regressed concentration (Cfound) obtained by interpolation to
the regression line for each
ω
iwith the nominal standard concentration (Cnom).100
%
=
−
×
nom nom foundC
C
C
RE
The % RE evaluated by plotting the % RE versus the concentration as well as by calculating % RE values, is useful and a sensitive indicator of goodness of fit in the evaluation of the effectiveness of a weighting factor for weighted least squares linear regression.
The best ωi is the one that gives rise to a narrow horizontal band of randomly distributed
% RE around the concentration axis and presents the least sum of the % RE across the all concentration range.
Conversion of the relations for unweighted least squares into their weighted counterparts can easily be done by adding a term
ω
ito any sum and changing any term n into∑
ω
i . Estimated values for a and b parameters for unweighted least squares may be obtained by the following formulas:∑
∑
∑
∑
−
−
=
2 2)
(
.
.
.
i i i i i ix
x
n
y
x
y
x
n
b
∑
∑
∑
∑
∑
∑
−
−
=
2 2 2)
(
.
.
i i i i i i ix
x
n
y
x
x
y
x
a
Estimated values for a and b parameters of weighted regression
∑
∑
∑
∑
∑
∑
∑
−
−
=
2 2)
.
(
.
.
.
.
.
.
.
i i i i i i i i i i i i ix
x
y
x
y
x
b
ω
ω
ω
ω
ω
ω
ω
∑
∑
∑
∑
∑
∑
∑
−
−
=
2 2 2)
.
(
.
.
.
.
.
.
.
i i i i i i i i i i i i i ix
x
y
x
x
y
x
a
ω
ω
ω
ω
ω
ω
ω
Where xi and yi is the ith data pair of total data pairs and w is the weighting factor chosed,
The degree of dependence established between two variables, expressed by the correlation coefficient (r- value) can be obtained by the following modified formula:
∑ ∑
∑
∑ ∑
∑ ∑
−
∑
∑
∑
−
−
=
2 2 2 2)
.
(
.
.
.
)
.
(
.
.
.
.
.
.
.
.
i i i i i i i i i i i i i i i i i iy
y
x
x
y
x
y
x
r
ω
ω
ω
ω
ω
ω
ω
ω
ω
ω
10.4. Statistical AnalysisRegression parameters were obtained by introducing the respective formulas on Microsoft Excel® Worksheet and using the software ChemStation A.08.04 from Agilent Technologies. The differences between two mean values were analysed using either a two-tailed paired or unpaired student’s t-test. The F-test (two side test) for comparison of standard deviation was used. Values are expressed by Mean±Standard Error Mean (SEM).
CHAPTER III
RESULTS
1. Bio-analytical Method Validation
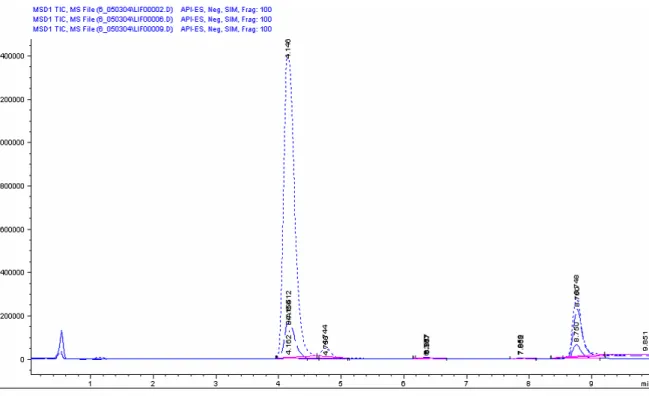
No co-eluted peaks were observed that could compromise the selectivity of the assay for
trans-resveratrol quantification. A typical chromatogram of extracts of blank matrix is
shown in Fig 7.
Figure 7. Chromatogram of blank matrix.
1.1. Carryover
The blank matrix injected after the last three highest concentrations of the analytical range presented no peak.
1.2. Working Range
Working range was evaluated using the calibration curves used for inter-batch accuracy and precision assessment. The working range selected was from 10 to 2000 nM. In this range the linearity was checked and it was considered linear.
1.2.1. Test of Homoscedasticity
Homoscedasticity was tested by using the plot of residuals (Fig. 8.) obtained for intra-batch accuracy and precision data. The values were obtained using a simple linear regression model, mathematically expressed by:
y = 12680x + 293993 R2 = 0,9981
Figure 8. Residuals plotted (n=5) against trans-resveratrol concentration.
Residuals presented in Fig. 8. clearly shows that errors were not randomly distributed around the concentration axis but they increase with concentration’s.
In Table 1 it is shown the homocedasticity test, using the F-test, to evaluate if there are significant differences between the variances.
500 1000 1500 2000 2500 -400 -300 -200 -100 0 100 200 300 400
Concentration (nM)
R
esi
d
u
a
ls
(
y
ob s-y
pr e d)
Table 1. Test of homoscedasticity of variances
Nominal peak Standard Variance
Concentration area Deviation
(nM) (y0)*10^5 s*10^5 (s^2)*10^5 1.35126 0.018 34 10 1.32295 1.32332 1.30061 1.31645 236.674 15.3 23428925 2000 255.344 243.247 241.319 213.586 Fexp 697854 Ftab (4,4,99%) 15.98 Fexp>Ftab no homcedasticity was met.
In Table 1 the F-Test also reveals a significant difference between the variances when the experimental F-value (697854) is compared to the tabled one (15.98). Indeed, there are significant differences between variances which mean that homoscedasticity was not met.
1.2.2. Choice of the Weighting Factor
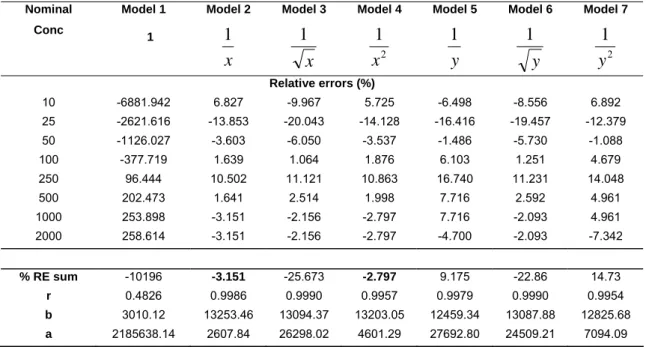
The regression parameters of the calibration curve generated for each weighting factors and the respective sums of relative error are summarized in Table 2. The weighting factor 1/x2 produces the least sum for this data set and provided the most adequate
Table 2. The regression parameters of the calibration curve generated for each weighting factors. Nominal Conc Model 1 1 Model 2
x
1
Model 3x
1
Model 4 21
x
Model 5y
1
Model 6 y 1 Model 7 21
y
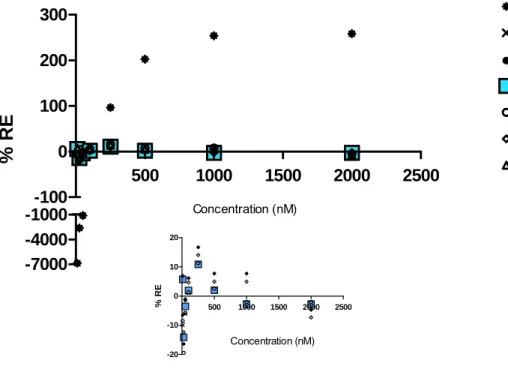
Relative errors (%) 10 -6881.942 6.827 -9.967 5.725 -6.498 -8.556 6.892 25 -2621.616 -13.853 -20.043 -14.128 -16.416 -19.457 -12.379 50 -1126.027 -3.603 -6.050 -3.537 -1.486 -5.730 -1.088 100 -377.719 1.639 1.064 1.876 6.103 1.251 4.679 250 96.444 10.502 11.121 10.863 16.740 11.231 14.048 500 202.473 1.641 2.514 1.998 7.716 2.592 4.961 1000 253.898 -3.151 -2.156 -2.797 7.716 -2.093 4.961 2000 258.614 -3.151 -2.156 -2.797 -4.700 -2.093 -7.342 % RE sum -10196 -3.151 -25.673 -2.797 9.175 -22.86 14.73 r 0.4826 0.9986 0.9990 0.9957 0.9979 0.9990 0.9954 b 3010.12 13253.46 13094.37 13203.05 12459.34 13087.88 12825.68 a 2185638.14 2607.84 26298.02 4601.29 27692.80 24509.21 7094.09The % RE plots for unweighted (model 1) and weighted (model 2-7) regressions of trans-resveratrol across the concentration range are showed in Fig. 9. Model 1 underestimated the concentrations in the lower limit of the calibration curve. Model 4, based on the sum of the % RE represent the best model, however model 2 can also be applied. In this study the model 4 was used for the subsequent calculations.
500 1000 1500 2000 2500 -7000 -4000 -1000
Model 1
Model 2
Model 3
Model 4
Model 5
Model 6
Model 7
-100 0 100 200 300 Concentration (nM)% R
E
500 1000 1500 2000 2500 -20 -10 0 10 20 Concentration (nM) % R EFigure 9. % RE plotted against trans-resveratrol concentration.
Typical chromatograms of extracts of low, medium and high calibration standards are shown in Fig. 10 to 13.
Figure 11. Chromatogram of 250 nM trans-resveratrol in matrix.
Figure 13. Overlay of chromatograms from Fig 10, 11 and 12.
1.3. Intra-batch Precision and Accuracy
To determine the intra-batch accuracy and precision of the assay it was used a calibration curve obtained with a weighting factor 1/x2 over the analytical range of 10 nM to 2000 nM.
For trans-resveratrol the accuracy expressed by % RE value ranged from –13,1 % to 10,9 % and the precision expressed by the coefficient of variation (CV) ranged from 1,4 % to 9,8 %. Individual values are presented in Table 3.
Table 3. Intra-batch accuracy and precision for the quantification of trans-resveratrol
Nominal Found Mean ± 95% CI
Concentration Concentration n Conc. Found SD CV % RE
(nM) (nM) (nM) (%) 10.22 10.00 8.66 5 9.0 ± 2.4 0.9 9.8 -9.9 7.81 9.12 9.23 22.55 25.00 22.79 5 22.8 ± 2.9 1.0 4.6 -8.8 22.23 21.87 24.56 49.87 50.00 53.61 5 48 ± 11 3.8 8.0 -3.7 43.33 46.51 47.51 307.52 250.00 288.28 5 277 ± 56 20 7 11 261.15 260.65 268.83 1071.59 1000.00 1051.22 5 1062 ± 40 15 1.4 6.2 1072.90 1042.05 1072.78 1764.67 2000.00 1833.07 4 17,4x10^2 ± 3,1x10^2 98 5.7 -13.1 1754.62 1600.05
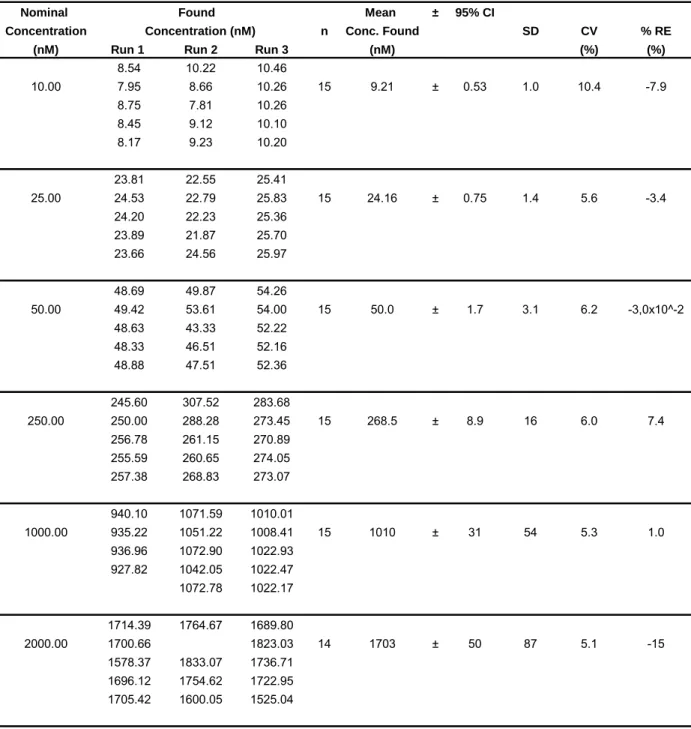
1.4. Inter-batch Accuracy and Precision
The inter-batch accuracy and precision of the analytical method was evaluated over the range of 10 nM to 2000 nM in 3 separate analytical runs. Across this range the accuracy expressed by % RE ranged from –14,8% to 7,8 % and the precision expressed by the coefficient of variation (CV) ranged from 5,1 % to 10,7 %. Individual values are presented in Table 4.