CERN-PH-EP/2013-037 2014/08/22
CMS-TOP-12-018
Measurement of jet multiplicity distributions in tt
production in pp collisions at
√
s
=
7 TeV
The CMS Collaboration
∗Abstract
The normalised differential top quark-antiquark production cross section is measured as a function of the jet multiplicity in proton-proton collisions at a centre-of-mass en-ergy of 7 TeV at the LHC with the CMS detector. The measurement is performed in both the dilepton and lepton+jets decay channels using data corresponding to an in-tegrated luminosity of 5.0 fb−1. Using a procedure to associate jets to decay products of the top quarks, the differential cross section of the tt production is determined as a function of the additional jet multiplicity in the lepton+jets channel. Furthermore, the fraction of events with no additional jets is measured in the dilepton channel, as a function of the threshold on the jet transverse momentum. The measurements are compared with predictions from perturbative quantum chromodynamics and no significant deviations are observed.
Published in the European Physical Journal C as doi:10.1140/epjc/s10052-014-3014-0.
c
2014 CERN for the benefit of the CMS Collaboration. CC-BY-3.0 license
∗See Appendix A for the list of collaboration members
1
Introduction
Precise measurements of the top quark-antiquark (tt) production cross section and top-quark properties performed at the CERN Large Hadron Collider (LHC) provide crucial information for testing the predictions of perturbative quantum chromodynamics (QCD) at large energy scales and in processes with multiparticle final states.
About half of the tt events are expected to be accompanied by additional hard jets that do not originate from the decay of the tt pair (tt +jets). In this paper, these jets will be referred to as additional jets. These processes typically arise from either initial- or final-state QCD radiation, providing an essential handle to test the validity and completeness of higher-order QCD cal-culations of processes leading to multijet events. Calcal-culations at next-to-leading order (NLO) are available for tt production in association with one [1] or two [2] additional jets. The cor-rect description of tt +jets production is important to the overall LHC physics program since it constitutes an important background to processes with multijet final states, such as associated Higgs-boson production with a tt pair, with the Higgs boson decaying into a bb pair, or final states predicted in supersymmetric theories. Anomalous production of additional jets accom-panying a tt pair could be a sign of new physics beyond the standard model [3].
This paper presents studies of the tt production with additional jets in the final state using data collected in proton-proton (pp) collisions with centre-of-mass energy√s =7 TeV with the Compact Muon Solenoid (CMS) detector [4]. The analysis uses data recorded in 2011, corre-sponding to a total integrated luminosity of 5.0±0.1 fb−1. For the first time, the tt cross section is measured differentially as a function of jet multiplicity and characterised both in terms of the total number of jets in the event, as well as the number of additional jets with respect to the leading-order hard-interaction final state. Kinematic properties of the additional jets are also investigated. The results are corrected for detector effects and compared at particle level with theoretical predictions obtained using different Monte Carlo (MC) event generators.
The differential cross sections as a function of jet multiplicity are measured in both the dilepton (ee, µµ, and eµ) and`+jets (`= e or µ) channels. For the dilepton channel, data containing two oppositely-charged leptons and at least two jets in the final state are used, while for the`+jets channel, data containing a single isolated lepton and at least three jets are used. Following the analysis strategy applied to the measurement of other tt differential cross sections [5], the results are normalised to the inclusive cross section measured in situ, eliminating systematic uncertainties related to the normalisation. Lastly, the fraction of events that do not contain additional jets (gap fraction), first measured by ATLAS [6], is determined in the dilepton channel as a function of the threshold on the transverse momentum (pT) of the leading additional jet
and of the scalar sum of the pTof all additional jets.
The measurements are performed in the visible phase space, defined as the kinematic region in which all selected final-state objects are produced within the detector acceptance. This avoids additional model uncertainties due to the extrapolation of the measurements into experimen-tally inaccessible regions of phase space.
The paper is structured as follows. A brief description of the CMS detector is provided in Sect. 2. Section 3 gives a description of the event simulation, followed by details of the object reconstruction and event selection in Sect. 4. A discussion of the sources of systematic uncer-tainties is given in Sect. 5. The measurement of the differential cross section is presented as a function of the jet multiplicity in Sect. 6 and as a function of the additional jet multiplicity in Sect. 7. The study of the additional jet gap fraction is described in Sect. 8. Finally, a summary is given in Sect. 9.
2 3 Event simulation
2
The CMS detector
The central feature of the CMS apparatus is a superconducting solenoid, 13 m in length and 6 m in diameter, which provides an axial magnetic field of 3.8 T. The bore of the solenoid is outfitted with various particle detection systems. Charged-particle trajectories are measured with silicon pixel and strip trackers, covering 0≤ φ<2π in azimuth and|η| <2.5 in pseudo-rapidity, where η is defined as η = −ln[tan(θ/2)], with θ being the polar angle of the trajectory of the particle with respect to the anticlockwise-beam direction. A lead tungstate crystal elec-tromagnetic calorimeter (ECAL) and a brass/scintillator hadron calorimeter (HCAL) surround the tracking volume. The calorimetry provides excellent resolution in energy for electrons and hadrons within|η| < 3.0. Muons are measured up to|η| <2.4 using gas-ionisation detectors embedded in the steel flux return yoke outside the solenoid. The detector is nearly hermetic, providing accurate measurements of any imbalance in momentum in the plane transverse to the beam direction. The two-level trigger system selects most interesting final states for further analysis. A detailed description of the CMS detector can be found in Ref. [4].
3
Event simulation
The reference simulated tt sample used in the analysis is generated with the MADGRAPH
(v. 5.1.1.0) matrix element generator [7], with up to three additional partons. The generated events are subsequently processed usingPYTHIA (v. 6.424) [8] to add parton showering using the MLM prescription [9] for removing the overlap in phase space between the matrix element and the parton shower approaches. The PYTHIA Z2 tune is used to describe the underlying event [10]. The top-quark mass is assumed to be mt=172.5 GeV. The proton structure is
de-scribed by the CTEQ6L1 [11] parton distribution functions (PDFs).
The MADGRAPHgenerator is used to simulate W+jets and Z/γ∗+jets production. Single-top-quark events (s-, t-, and tW-channels) are simulated using POWHEG(r1380) [12–15]. Diboson (WW, WZ, and ZZ) and QCD multijet events are simulated usingPYTHIA.
Additional tt and W+jets MADGRAPH samples are generated using different choices for the common factorisation and renormalisation scale (µ2F =µ2R = Q2) and for the jet-parton match-ing threshold. These are used to determine the systematic uncertainties due to model uncer-tainties and for comparisons with the measured distributions. The nominal Q2scale is defined as m2t +∑ p2T(jet). This is varied between 4Q2and Q2/4. For the reference MADGRAPH sam-ple, a jet-parton matching threshold of 20 GeV is chosen, while for the up and down variations, thresholds of 40 and 10 GeV are used, respectively.
In addition to MADGRAPH, samples of tt events are generated with POWHEG and MC@NLO
(v. 3.41) [16]. The CTEQ6M [11] PDF set is used in both cases. Both POWHEG and MC@NLO
match calculations to full NLO accuracy with parton shower MC generators. For POWHEG,
PYTHIA is chosen for hadronisation and parton shower simulation, with the same Z2 tune
utilised for other samples. ForMC@NLO,HERWIG(v. 6.520) [17] with the default tune is used. For comparison with the measured distributions, the event yields in the simulated samples are normalised to an integrated luminosity of 5.0 fb−1according to their theoretical cross sections. These are taken from next-to-next-to-leading-order (NNLO) (W+jets and Z/γ∗+jets), NLO plus next-to-next-to-leading-log (NNLL) (single-top-quark s- [18], t- [19] and tW-channels [20]), NLO (diboson [21]), and leading-order (LO) (QCD multijet [8]) calculations. For the simulated tt sample, the full NNLO+NNLL calculation, performed with the TOP++ 2.0 program [22], is
with the MSTW2008nnlo68cl [25], CT10 NNLO [26, 27], and NNPDF2.3 5f FFN [28] PDF sets, and added in quadrature to the scale uncertainty to obtain a tt production cross section of 177.3+−10.110.8pb (for a top-quark mass value of 172.5 GeV).
All generated samples are passed through a full detector simulation using GEANT4 [29], and the number of additional pp collisions (pileup) is matched to the real distribution as inferred from data.
4
Event reconstruction and selection
The event selection is based on the reconstruction of the tt decay products. The top quark decays almost exclusively into a W boson and a b quark. Only the subsequent decays of one or both W bosons to a charged lepton and a neutrino are considered here. Candidate events are required to contain the corresponding reconstructed objects: isolated leptons and jets. The requirement of the presence of jets associated with b quarks or antiquarks (b jets) is used to increase the purity of the selected sample. The selection has been optimised independently in each channel to maximise the signal content and background rejection.
4.1 Lepton, jet, and missing transverse energy reconstruction
Events are reconstructed using a particle-flow (PF) technique [30, 31], in which signals from all CMS sub-detectors are combined to identify and reconstruct the individual particle candidates produced in the pp collision. The reconstructed particles include muons, electrons, photons, charged hadrons, and neutral hadrons. Charged particles are required to originate from the primary collision vertex, defined as the vertex with the highest sum of transverse momenta of all reconstructed tracks associated to it. Therefore, charged hadron candidates from pileup events, i.e. originating from a vertex other than the one of the hard interaction, are removed before jet clustering on an event-by-event basis. Subsequently, the remaining neutral-hadron pileup component is subtracted at the level of jet energy correction [32].
Electron candidates are reconstructed from a combination of their track and energy deposition in the ECAL [33]. In the dilepton channel, they are required to have a transverse momentum pT > 20 GeV, while in the`+jets channel they are required to have pT >30 GeV. In both cases
they are required to be reconstructed within |η| < 2.4, and electrons from identified photon conversions are rejected. As an additional quality criterion, a relative isolation variable Irel is
computed. This is defined as the sum of the pT of all neutral and charged reconstructed PF
candidates inside a cone around the lepton (excluding the lepton itself) in the η-φ plane with radius∆R ≡ √(∆η)2+ (∆φ)2 < 0.3, divided by the p
T of the lepton. In the dilepton (e+jets)
channel, electrons are selected as isolated if Irel <0.12(0.10).
Muon candidates are reconstructed from tracks that can be matched between the silicon tracker and the muon system [34]. They are required to have a transverse momentum pT > 20 GeV
within the pseudorapidity interval|η| < 2.4 in the dilepton channel, and to have pT >30 GeV
and |η| < 2.1 in the `+jets channel. Isolated muon candidates are selected by demanding a relative isolation of Irel<0.20(0.125)in the dilepton (µ+jets) channel.
Jets are reconstructed by clustering the particle-flow candidates [35] using the anti-kTalgorithm
with a distance parameter of 0.5 [36, 37]. An offset correction is applied to take into account the extra energy clustered in jets due to pileup, using the FastJet algorithm [38] based on average pileup energy density in the event. The raw jet energies are corrected to establish a relative uniform response of the calorimeter in η and a calibrated absolute response in pT. Jet energy
4 4 Event reconstruction and selection
corrections are derived from the simulation, and are confirmed with in situ measurements with the energy balance of dijet and photon+jet events [35]. Jets are selected within|η| < 2.4 and with pT >30(35)GeV in the dilepton (`+jets) channel.
Jets originating from b quarks or antiquarks are identified with the Combined Secondary Ver-tex algorithm [39], which provides a b-tagging discriminant by combining secondary vertices and track-based lifetime information. The chosen working point used in the dilepton chan-nel corresponds to an efficiency for tagging a b jet of about 80–85%, while the probability to misidentify light-flavour or gluon jets as b jets (mistag rate) is around 10%. In the`+jets chan-nel, a tighter requirement is applied, corresponding to a b-tagging efficiency of about 65–70% with a mistag rate of 1%. The probability to misidentify a c jet as b jet is about 40% and 20% for the working points used in the dilepton and`+jets channels respectively [39].
The missing transverse energy (EmissT ) is defined as the magnitude of the sum of the momenta of all reconstructed PF candidates in the plane transverse to the beams.
4.2 Event selection
Dilepton events are collected using combinations of triggers which require two leptons fulfill-ing pT and isolation criteria. During reconstruction, events are selected if they contain at least
two isolated leptons (electrons or muons) of opposite charge and at least two jets, of which at least one is identified as a b jet. Events with a lepton pair invariant mass smaller than 12 GeV are removed in order to suppress events from heavy-flavour resonance decays. In the ee and µµchannels, the dilepton invariant mass is required to be outside a Z-boson mass window of 91±15 GeV (Z-boson veto), and EmissT is required to be larger than 30 GeV.
A kinematic reconstruction method [5] is used to determine the kinematic properties of the tt pair and to identify the two b jets originating from the decay of the top quark and antiquark. In the kinematic reconstruction the following constraints are imposed: the EmissT originated entirely from the two neutrinos; the reconstructed W-boson invariant mass of 80.4 GeV [40] and the equality of the reconstructed top quark and antiquark masses. The remaining ambiguities are resolved by prioritising those event solutions with two or one b-tagged jets over solutions using untagged jets. Finally, among the physical solutions, the solutions are ranked according to how the neutrino energies match with a simulated neutrino energy spectrum and the highest ranked one is chosen. The kinematic reconstruction yields no valid solution for about 11% of the events. These are excluded from further analysis. A possible bias due to rejected solutions has been studied and found to be negligible.
In the e+jets channel, events are triggered by an isolated electron with pT > 25 GeV and at
least three jets with pT > 30 GeV. Events in the µ+jets channel are triggered by the presence
of an isolated muon with pT > 24 GeV fulfilling η requirements. Only triggered events that
have exactly one high-pT isolated lepton are retained in the analysis. In the e+jets channel,
events are rejected if any additional electron is found with pT >20 GeV,|η| <2.5, and relative isolation Irel < 0.20. In the µ+jets channel, events are rejected if any electron candidate with
pT > 15 GeV, |η| < 2.5 and Irel < 0.20 is reconstructed. In both `+jets channels events with
additional muons with pT > 10 GeV,|η| < 2.5, and relative isolation Irel < 0.20 are rejected. The presence of at least three reconstructed jets is required. At least two of them are required to be b-tagged.
Only tt events from the decay channel under study are considered as signal. All other tt events are considered as background, including those containing leptons from τ decays, which are the dominant contribution to this background.
4.3 Background estimation
After the full event selection is applied, the dominant background in the eµ channel comes from other tt decay modes, estimated using simulation. In the ee and µµ channels, it arises from Z/γ∗+jets production. The normalisation of this backround contribution is derived from data using the events rejected by the Z-boson veto, scaled by the ratio of events failing and passing this selection estimated in simulation (Rout/in) [41]. The number of Z/γ∗+jets→ee/µµ
events near the Z-boson peak, Nin
Z/γ∗, is given by the number of all events failing the Z-boson
veto, Nin, after subtracting the contamination from non-Z/γ∗+jets processes. This contribu-tion is extracted from eµ events passing the same seleccontribu-tion, Neµin, and corrected for the differ-ences between the electron and muon identification efficiencies using a correction factor k. The Z/γ∗+jets contribution is thus given by
Nout= Rout/inNZ/γin ∗ = Rout/in(Nin−0.5kNeµin) (1)
The factor k is estimated from k2 = N
eµ/Nee (Neµ/Nµµ) for the Z/γ∗ → e+e−(µ+µ−)+jets
contribution, respectively. Here Nee(Nµµ) is the number of ee (µµ) events in the Z-boson region,
without the requirement on EmissT . The remaining backgrounds, including single-top-quark, W+jets, diboson, and QCD multijet events are estimated from simulation.
In the`+jets channel, the main background contributions arise from W+jets and QCD multi-jet events, which are greatly suppressed by the b-tagging requirement. A procedure based on control samples in data is used to extract the QCD multijet background. The leptons in QCD multijet events are expected to be less isolated than leptons from other processes. Thus, in-verting the selection on the lepton relative isolation provides a relatively pure sample of QCD multijet events in data. Events passing the standard event selection but with an Irelbetween
0.3 and 1.0, and with at least one b-tagged jet are selected. The sample is divided in two: the sideband region (one b jet) and the signal region (≥2 b jets). The shape of the QCD multijet background is taken from the signal region, and the normalisation is determined from the side-band region. In the sideside-band region, the ETmiss distribution of the QCD multijet model, other sources of background (determined from simulation), and the tt signal are fitted to data. The resulting scaling of QCD multijet background is applied to the QCD multijet shape from the signal region.
Since the initial state of LHC collision is enriched in up quarks with respect to down quarks, more W bosons are produced with positive charge than negative charge. In leptonic W-boson decays, this translates into a lepton charge asymmetryA. Therefore, a difference between the number of events with a positively charged lepton and those with a negatively charged lepton (∆±) is observed. In data, this quantity (∆±data) is proportional to the number of W+jets events
when assuming that only the charge asymmetry from W-boson production is significant. The charge asymmetry has been measured by CMS [42] and found to be well described by the simulation, thus the simulated value can be used to extract the number of W+jets events from data: NW+jetsdata = ∆±data/A. The correction factor on the W+jets normalisation, calculated
before any b-tagging requirement, is between 0.81 and 0.92 depending on the W decay channel and the jet selection. Subsequently, b-tagging is applied to obtain the number of W+jets events in the signal region.
In addition, a heavy-flavour correction must be applied on the W+jets sample to account for the differences observed between data and simulation [43]. Using the matching between se-lected jets and generated partons, simulated events are classified as containing at least one b jet (W+bX), at least one c jet and no b jets (W+cX), or containing neither b jets nor c jets (W+light quarks). The rate of W+bX events is multiplied by 2±1 and the rate of W+cX events
6 5 Systematic uncertainties
is multiplied by 1+−1.00.5. No correction is applied to W+light-jets events. These correction fac-tors are calculated in [43] in a phase space which is close to the one used in the analysis. The uncertainties in the correction factors are taken into account as systematic uncertainties. The total number of W+jets events is modified to conserve this number when applying the heavy-flavour corrections. The remaining backgrounds, originating from single-top-quark, diboson, and Z/γ∗+jets processes, are small and their contributions are estimated using simulation. The multiplicity and the pT distributions of the selected reconstructed jets are shown for the
dilepton and `+jets channels in Fig. 1. Good agreement for the jet multiplicity is observed between data and simulation for up to 5 (6) jets in the dilepton (`+jets) channels. For higher jet multiplicities, the simulation predicts slightly more events than observed in data. The mod-elling of the jet pTspectrum in data is shifted towards smaller values, covered by the systematic
uncertainties. The uncertainty from all systematic sources, which are described in Sect. 5, is de-termined by estimating their effect on both the normalisation and the shape. The size of these global uncertainties does not reflect those in the final measurements, since they are normalised and, therefore, only affected by shape uncertainties.
5
Systematic uncertainties
Systematic uncertainties in the measurement arise from detector effects, background mod-elling, and theoretical assumptions. Each systematic uncertainty is investigated separately and estimated for each bin of the measurement by varying the corresponding efficiency, resolu-tion, or scale within its uncertainty. For each variaresolu-tion, the measured normalised differential cross section is recalculated, and the difference between the varied result and the nominal re-sult in each bin is taken as systematic uncertainty. The overall uncertainty in the measurement is obtained by adding all contributions in quadrature. The sources of systematic uncertainty, described below, are assumed to be uncorrelated.
• Jet energyThe impact of the jet energy scale (JES) [35] is determined by varying the pT of all jets by the JES uncertainty, which is typically below 3%. The uncertainty
due to the jet energy resolution (JER) [44] is estimated by varying the nominal value by±1σ.
• tt model uncertainties Uncertainties originating from theoretical assumptions on the renormalisation and factorisation scales, the jet-parton matching threshold, the hadronisation model, and the colour reconnection modelling [45], are determined by repeating the analysis, replacing the reference MADGRAPHsignal simulation by other simulation samples. In particular, the impact of the former sources is assessed with MADGRAPH samples with the renormalisation and factorisation scales
simul-taneously varied from the nominal Q2 values to 4Q2and Q2/4 and with jet-parton
matching threshold varied to 40 and 10 GeV. The uncertainties from ambiguities in modeling colour reconnection effects are estimated by comparing simulations of an underlying event tune including colour reconnection to a tune without it (the Perugia 2011 and Perugia 2011 noCR tunes described in [46]). The hadronisation model uncertainty is estimated by comparing samples simulated withPOWHEGand
MC@NLO, using PYTHIA and HERWIG, respectively, for hadronisation. The uncer-tainty arising from the PDFs is assessed by reweighting the tt signal sample accord-ing to the 44 CTEQ66 error PDF sets, at 90% confidence level. The effects of these variations are added in quadrature.
• BackgroundThe uncertainty due to the normalisation of the backgrounds that are
Events -1 10 1 10 2 10 3 10 4 10 5 10 6 10 Data Signal t t Other t t Single t W+Jets µ µ ee/ → * γ Z / τ τ → * γ Z / Diboson QCD Multijet Dilepton Combined = 7 TeV s at -1 CMS, L = 5.0 fb jets N 2 3 4 5 6 7 ≥ 8 Data/MC 0.5 1 1.5 Jets / 10 GeV 1 2 3 4 5 6 7 8 3 10 × Data Signal t t Other t t Single t W+Jets µ µ ee/ → * γ Z / τ τ → * γ Z / Diboson QCD Multijet Dilepton Combined = 7 TeV s at -1 CMS, L = 5.0 fb GeV T p 50 100 150 200 250 Data/MC 0.5 1 1.5 Events 1 10 2 10 3 10 4 10 5 10 6 10 Data Signal t t Other t t Single t W+Jets *+Jets γ Z/ Diboson QCD Multijet Lepton+Jets Combined = 7 TeV s at -1 CMS, L = 5.0 fb jets N 3 4 5 6 7 ≥8 Data/MC 0.5 1 1.5 50 100 150 200 250 Jets / 10 GeV 5 10 15 20 25 3 10 × Data Signal t t Other t t Single t W+Jets *+Jets γ Z/ Diboson QCD Multijet Lepton+Jets Combined = 7 TeV s at -1 CMS, L = 5.0 fb [GeV] T p 50 100 150 200 250 Data/MC 0.5 1 1.5
Figure 1: Number of reconstructed jets (left) and jet pT spectrum (right) after event selection
in the dilepton channel for jets with pT > 30 GeV (top), and in the`+jets channel for jets with
pT > 35 GeV (bottom). The hatched band represents the combined effect of all sources of
systematic uncertainty.
This takes into account the uncertainty in the predicted cross section and all other sources of systematic uncertainty.
In the dilepton channels, the contribution from Z/γ∗+jets processes as determined from data is varied in normalisation by±30% [41].
In the`+jets channels, the uncertainty in the W+jets background arises from the con-tamination of other processes with a lepton charge asymmetry when extracting the rate from data, and from the uncertainty in the heavy-flavour correction factors. The rate uncertainty is estimated to range from 10% to 20%, depending on the channel. The model uncertainty is estimated using samples with varied renormalisation and factorisation scales and jet-parton matching threshold.
The QCD multijet background modelling uncertainty arises from the choice of the relative isolation requirement on the anti-isolated lepton used for the extraction of
8 6 Normalised differential cross section as a function of jet multiplicity
the background from data, the influence of the contamination from other processes on the shape, and the extrapolation from the sideband to the signal region. The total uncertainty is about 15% to more than 100%, depending on the channel.
• Other systematic uncertainties The uncertainty associated with the pileup model
is determined by varying the minimum bias cross section within its uncertainty of
±8%. Other uncertainties taken into account originate from lepton trigger, isolation, and identification efficiencies; b-jet tagging efficiency and misidentification proba-bility; integrated luminosity [49]; and the kinematic reconstruction algorithm used in the dilepton channels.
In the dilepton channels, the total systematic uncertainty is about 3% at low jet multiplicities, and increases to about 20% in the bins with at least five jets. In the`+jets channels, the total systematic uncertainty is about 6% at the lowest jet multiplicity, and increases to 34% for events with at least 8 jets.
The dominant systematic uncertainties for both dilepton and `+jets channels arise from the JES (with typical values from 2 to 20%, depending on the jet multiplicity bin and cross section measurement) and the signal model including hadronisation, renormalisation and factorisation scales and jet-parton matching threshold (from 3 to 30%). The typical systematic uncertainty due to JER ranges from 0.2 to 3%, b-tagging from 0.3 to 2%, pileup from 0.1 to 1.4%, and back-ground normalisation from 1.6 to 3.8%. The uncertainty from other sources is below 0.5%. The remaining uncertainties on the model arise from PDF and colour reconnection, varying from 0.1 to 1.5% and from 1 to 5.8%, respectively. In all channels, the systematic uncertainty for larger jet multiplicities is dominated by the statistical uncertainty of the simulated samples that are used for the evaluation of modelling uncertainties.
6
Normalised differential cross section as a function of jet
multi-plicity
The differential tt production cross section as a function of the jet multiplicity is measured from the number of signal events after background subtraction and correction for the detector efficiencies and acceptances. The estimated number of background events arising from pro-cesses other that tt production (Nnon tt BG) is directly subtracted from the number of events in data (N). The contribution from other tt decay modes is taken into account by correcting N– Nnon tt BGwith the signal fraction, defined as the ratio of the number of selected tt signal events to the total number of selected tt events. This avoids the dependence on the inclusive tt cross section used for normalisation. The normalised differential cross section is derived by scal-ing to the total integrated luminosity and by dividscal-ing the corrected number of events by the cross section measured in situ for the same phase space. Because of the normalisation, those systematic uncertainties that are correlated across all bins of the measurement, and therefore only affect the normalisation, cancel out. In order to avoid additional uncertainties due to the extrapolation of the measurement outside of the phase space region probed experimentally, the differential cross section is determined in a visible phase space defined at the particle level by the kinematic and geometrical acceptance of the final-state leptons and jets.
The visible phase space at particle level is defined as follows. The charged leptons from the tt decays are selected with|η| < 2.4 in dilepton events and |η| < 2.5(2.1)in e+jets (µ+jets) final states, pT > 20(30)GeV in the dilepton (`+jets) channels. A jet is defined at the particle
level in a similar way as described in Sect. 4 for the reconstructed jets, by applying the anti-kT clustering algorithm to all stable particles (including neutrinos not coming from the hard
interaction). Particle-level jets are rejected if the selected leptons are within a cone of∆R=0.4 with respect to the jet, to avoid counting leptons misidentified as jets. A jet is defined as a b jet if it contains the decay products of a b hadron. The two b jets from the tt decay have to fulfill the kinematic requirements|η| < 2.4 and pT > 30(35)GeV in the dilepton (`+jets) events. In
the`+jets channels, a third jet with the same properties is also required.
Effects from trigger and detector efficiencies and resolutions, leading to migrations of events across bin boundaries and statistical correlations among neighbouring bins, are corrected by using a regularised unfolding method [5, 50, 51]. A response matrix that accounts for migra-tions and efficiencies is calculated from simulated tt events using the reference MADGRAPH
sample. The event migration in each bin is controlled by the purity (number of events recon-structed and generated in one bin divided by the total number of reconrecon-structed events in that bin) and the stability (number of events reconstructed and generated in one bin divided by the total number of generated events in that bin). In these measurements, the purity and stability in the bins is typically 60% or higher. The generalised inverse of the response matrix is used to obtain the unfolded distribution from the measured distribution by applying a χ2 technique. To avoid non-physical fluctuations, a smoothing prescription (regularisation) is applied [5, 52]. The unfolded data are subsequently corrected to take into account the acceptance in the particle level phase space.
The measured normalised differential cross sections are consistent among the different dilep-ton and`+jets channels. The final results in the dilepton and`+jets channels are obtained from the weighted average of the individual measurements, using the statistical uncertainty as the weight. The result from the combination of e+jets and µ+jets channels is defined for the pseu-dorapidity range|η| < 2.1, i.e. according to the selection criterion of the µ+jets channel. The difference of this result to that for the pseudorapidity range|η| < 2.5 has been estimated to be less than 0.4% in any of the bins of the jet multiplicity distribution. In the combination, the differences in the|η|-range between µ+jets and e+jets channels are therefore neglected.
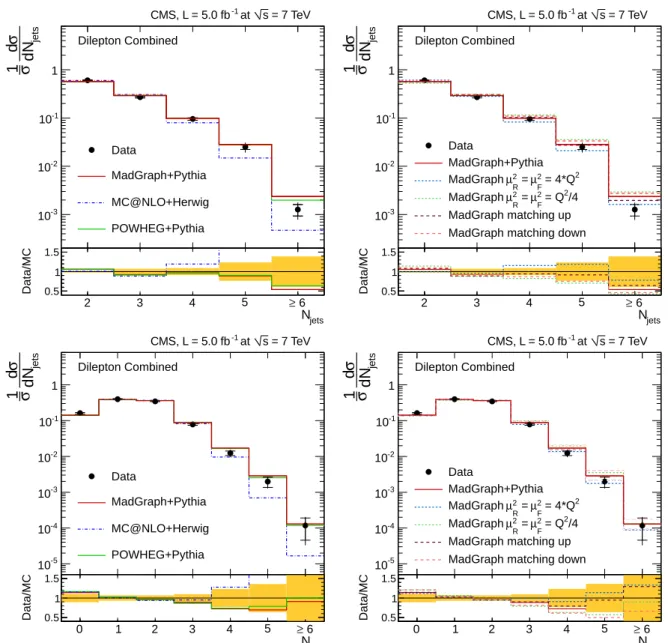
The normalised differential tt production cross section, 1/σ dσ/dNjets, as a function of the jet
multiplicity, Njets, is shown in Tables 1 and 2, and Fig. 2 for the dilepton channel and jets
with pT > 30 (60)GeV. For the `+jets channel it is shown in Table 3 and Fig. 3 for jets with
pT > 35 GeV. In the tables, the experimental uncertainties are divided between the dominant
(JES) and other (JER, b-tagging, pileup, lepton identification, isolation, and trigger efficiencies, background contribution and integrated luminosity) contributions. The model uncertainties are also divided between the dominant (renormalisation and factorisation scales, jet-parton matching threshold, and hadronisation) and other (PDF and colour reconnection) contribu-tions. The measurements are compared to the predictions from MADGRAPH and POWHEG, both interfaced withPYTHIA, and fromMC@NLOinterfaced withHERWIG.
The predictions from MADGRAPH+PYTHIAandPOWHEG+PYTHIAare found to provide a rea-sonable description of the data. In contrast,MC@NLO+HERWIGgenerates fewer events in bins with large jet multiplicities. The effect of the variation of the renormalisation and factorisation scales and jet-parton matching threshold in MADGRAPH+PYTHIA is compared with the
refer-ence MADGRAPH+PYTHIA simulation. The choice of lower values for both these parameters seems to provide a worse description of the data for higher jet multiplicities.
10 6 Normalised differential cross section as a function of jet multiplicity
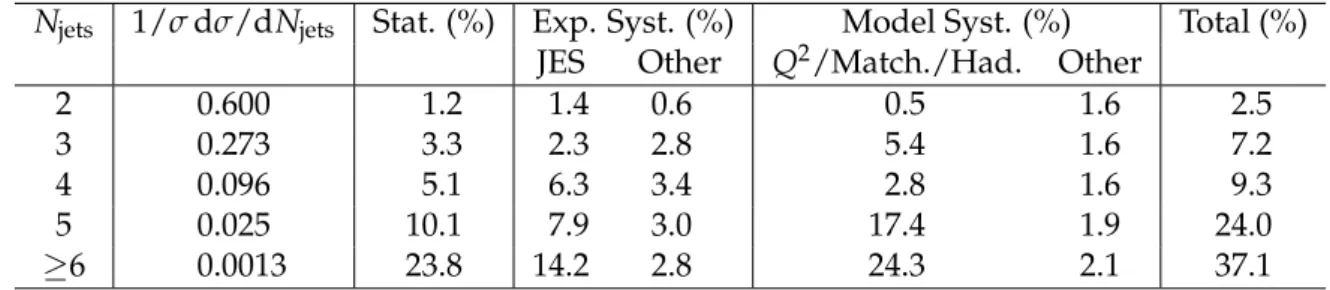
Table 1: Normalised differential tt production cross section as a function of the jet multiplicity for jets with pT > 30 GeV in the dilepton channel. The statistical, systematic, and total
uncer-tainties are also shown. The main experimental and model systematic unceruncer-tainties are dis-played: JES and the combination of renormalisation and factorisation scales, jet-parton match-ing threshold, and hadronisation (in the table “Q2/Match./Had.”).
Njets 1/σ dσ/dNjets Stat. (%) Exp. Syst. (%) Model Syst. (%) Total (%)
JES Other Q2/Match./Had. Other
2 0.600 1.2 1.4 0.6 0.5 1.6 2.5
3 0.273 3.3 2.3 2.8 5.4 1.6 7.2
4 0.096 5.1 6.3 3.4 2.8 1.6 9.3
5 0.025 10.1 7.9 3.0 17.4 1.9 24.0
≥6 0.0013 23.8 14.2 2.8 24.3 2.1 37.1
Table 2: Normalised differential tt production cross section as a function of the jet multiplicity for jets with pT > 60 GeV in the dilepton channel. The statistical, systematic, and total
uncer-tainties are also shown. The main experimental and model systematic unceruncer-tainties are dis-played: JES and the combination of renormalisation and factorisation scales, jet-parton match-ing threshold, and hadronisation (in the table “Q2/Match./Had.”).
Njets 1/σ dσ/dNjets Stat. (%) Exp. Syst. (%) Model Syst. (%) Total (%)
JES Other Q2/Match./Had. Other
0 0.158 3.4 7.0 5.7 2.7 1.6 10.1 1 0.397 4.0 4.9 2.0 3.3 1.9 7.6 2 0.350 2.6 3.2 3.3 3.5 1.7 6.6 3 0.079 5.2 3.4 3.0 5.8 1.6 9.2 4 0.0127 13.9 5.4 3.5 15.8 1.7 22.1 5 0.0020 30.9 4.8 3.6 15.5 1.6 35.1 ≥6 0.00012 57.1 4.7 16.7 38.7 2.9 69.4
Table 3: Normalised differential tt production cross section as a function of the jet multiplicity for jets with pT > 35 GeV in the `+jets channel. The statistical, systematic, and total
uncer-tainties are also shown. The main experimental and model systematic unceruncer-tainties are dis-played: JES and the combination of renormalisation and factorisation scales, jet-parton match-ing threshold, and hadronisation (in the table “Q2/Match./Had.”).
Njets 1/σ dσ/dNjets Stat. (%) Exp. Syst. (%) Model Syst. (%) Total (%)
JES Other Q2/Match./Had. Other
3 0.453 0.9 3.8 2.2 3.8 1.3 6.1 4 0.372 1.2 1.8 1.8 3.2 1.4 4.5 5 0.130 2.7 5.6 2.0 7.5 1.8 10.2 6 0.0353 5.3 6.7 2.4 14.2 2.5 17.0 7 0.00841 10.5 10.7 3.3 19.1 4.3 24.9 ≥8 0.00130 26.4 17.7 5.1 28.6 3.4 43.2
2 3 4 5 6 jets dN σ d σ 1 -3 10 -2 10 -1 10 1 = 7 TeV s at -1 CMS, L = 5.0 fb Dilepton Combined Data MadGraph+Pythia MC@NLO+Herwig POWHEG+Pythia jets N 2 3 4 5 ≥ 6 Data/MC 0.5 1 1.5 2 3 4 5 6 jets dN σ d σ 1 -3 10 -2 10 -1 10 1 Data MadGraph+Pythia 2 = 4*Q 2 F µ = 2 R µ MadGraph /4 2 = Q 2 F µ = 2 R µ MadGraph MadGraph matching up MadGraph matching down
= 7 TeV s at -1 CMS, L = 5.0 fb Dilepton Combined jets N 2 3 4 5 ≥ 6 Data/MC 0.5 1 1.5 0 1 2 3 4 5 6 jets dN σ d σ 1 -5 10 -4 10 -3 10 -2 10 -1 10 1 Data MadGraph+Pythia MC@NLO+Herwig POWHEG+Pythia = 7 TeV s at -1 CMS, L = 5.0 fb Dilepton Combined jets N 0 1 2 3 4 5 ≥ 6 Data/MC 0.5 1 1.5 0 1 2 3 4 5 6 jets dN σ d σ 1 -5 10 -4 10 -3 10 -2 10 -1 10 1 Data MadGraph+Pythia 2 = 4*Q 2 F µ = 2 R µ MadGraph /4 2 = Q 2 F µ = 2 R µ MadGraph MadGraph matching up MadGraph matching down
= 7 TeV s at -1 CMS, L = 5.0 fb Dilepton Combined jets N 0 1 2 3 4 5 ≥ 6 Data/MC 0.5 1 1.5
Figure 2: Normalised differential tt production cross section as a function of the jet multiplicity for jets with pT > 30 GeV (top) and pT > 60 GeV (bottom) in the dilepton channel. The
mea-surements are compared to predictions from MADGRAPH+PYTHIA, POWHEG+PYTHIA, and
MC@NLO+HERWIG(left), as well as from MADGRAPHwith varied renormalisation and
factori-sation scales, and jet-parton matching threshold (right). The inner (outer) error bars indicate the statistical (combined statistical and systematic) uncertainty. The shaded band corresponds to the combined statistical and systematic uncertainty.
7
Normalised differential cross section as a function of the
addi-tional jet multiplicity
The normalised differential tt production cross section is also determined as a function of the number of additional jets accompanying the tt decays in the`+jets channel. This measurement provides added value to the one presented in Sect. 6 by distinguishing jets from the tt decay products and jets coming from additional QCD radiation. This is particularly interesting in final states with many jets.
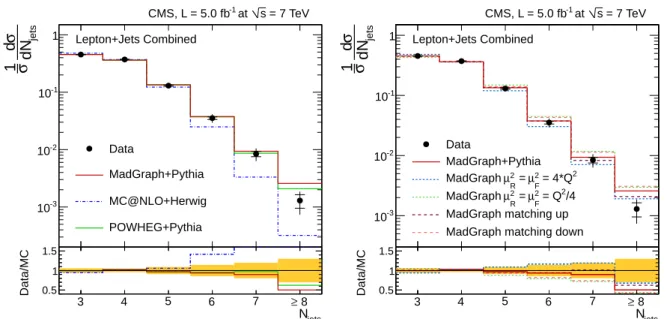
12 7 Normalised differential cross section as a function of the additional jet multiplicity 0 1 2 3 4 5 jets dN σ d σ 1 -3 10 -2 10 -1 10 1 Data MadGraph+Pythia MC@NLO+Herwig POWHEG+Pythia = 7 TeV s at -1 CMS, L = 5.0 fb Lepton+Jets Combined jets N 3 4 5 6 7 ≥ 8 Data/MC 0.5 1 1.5 0 1 2 3 4 5 jets dN σ d σ 1 -3 10 -2 10 -1 10 1 Data MadGraph+Pythia 2 = 4*Q 2 F µ = 2 R µ MadGraph /4 2 = Q 2 F µ = 2 R µ MadGraph MadGraph matching up MadGraph matching down
= 7 TeV s at -1 CMS, L = 5.0 fb Lepton+Jets Combined jets N 3 4 5 6 7 ≥ 8 Data/MC 0.5 1 1.5
Figure 3: Normalised differential tt production cross section as a function of jet multiplicity for jets with pT >35 GeV in the`+jets channel. The measurement is compared to predictions from
MADGRAPH+PYTHIA,POWHEG+PYTHIA, andMC@NLO+HERWIG(left), as well as from MAD
-GRAPHwith varied renormalisation and factorisation scales, and jet-parton matching threshold (right). The inner (outer) error bars indicate the statistical (combined statistical and systematic) uncertainty. The shaded band corresponds to the combined statistical and systematic uncer-tainty.
For this measurement, the event selection follows the prescription discussed in Sect. 4, and requires at least four jets (in order to perform a full event reconstruction later) with pT>30 GeV
and |η| < 2.4. The pT requirement is lowered to gain more data and reduce the statistical
uncertainty. The particle-level jets, defined as described in Sect. 6 but with pT > 30 GeV, are
counted as additional jets if their distance to the tt decay products is∆R>0.5. We consider the following objects as tt decay products: two b quarks, two light quarks from the hadronically decaying W boson, and the lepton from the leptonically decaying W boson; the neutrino is not included. The simulated tt events are classified into three categories according to the number of additional jets (0, 1, and ≥2) selected according to this definition. Figure 4 illustrates the contributions of tt events with 0, 1, and≥2 additional jets to the number of reconstructed jets in the simulation.
A full event reconstruction of the tt system is performed in order to create a variable sensitive to additional jets, taking into account all possible jet permutations. The most likely permutation is determined using a χ2minimisation, where the χ2is given by:
χ2 = mrec
Whad−mtrueWhad
σWhad
!2
+ m rec
thad−mtruethad
σthad
!2
+ m rec
tlep−mtruetlep
σtlep
!2 , where mrec
thadand mrectlepare the reconstructed invariant masses of the hadronically and the
lepton-ically decaying top quark, respectively, and mWhad is the reconstructed invariant mass of the W
boson from the hadronic top-quark decay. The parameters mtrue and σthad, σtlep, and σWhad are
the mean value and standard deviations of the reconstructed mass distributions in the tt simu-lation. In each event, all jet permutations in which only b-tagged jets are assigned to b quarks are considered. The permutation with the smallest χ2 value is chosen as the best hypothesis. For events containing the same number of reconstructed jets (Njets) the variable
p
jets N 4 5 6 7 ≥8 Arbitrary units 0.1 0.2 0.3 0.4 0.5 0.6 + 0 add. Jets t t + 1 add. Jet t t 2 add. Jets ≥ + t t Lepton+Jets Combined = 7 TeV s CMS Simulation at
Figure 4: Jet multiplicity distribution in simulated tt events in the`+jets channel. The splitting into three categories, defined by the compatibility of the selected particle level jets with the tt decay partons is also shown (cf. Sect. 7).
good discrimination between events classified as tt + 0, 1, and≥2 additional jets. The discrim-ination power is due to the sensitivity of the event reconstruction to the relation between Njets
and the number of additional jets Nadd. jets. The best event reconstruction, thus providing a smaller pχ2, is achieved if the observation is close to Njets = 4+Nadd. jets, where four is the
expected number of jets from the tt decay partons. For instance, a tt + 1 additional jet event with Njets = 4 is likely to get a large
p
χ2value because one of the four jets from the tt decay partons is missing for a correct event reconstruction.
The measurement of the fractions of tt events with 0, 1, and≥2 additional jets is performed using a binned maximum-likelihood fit of thepχ2templates to data, simultaneously in both
`+jets channels. The normalisations of the signal templates (tt + 0, 1, and≥2 additional jets) are free parameters in the fit. For the normalisations of the background processes, Gaussian constraints corresponding to the uncertainties of the background predictions are applied. It has been verified that the use of log-normal constraints give similar results. The result of the fit is shown in Fig. 5. The QCD multijet and W+jets templates are estimated using the data-based methods described in Sect. 4.
The normalisations for the three signal templates are applied to the predicted differential cross section in the visible phase space, calculated using the simulated tt sample from MAD
-GRAPH+PYTHIA. This phase space is defined as in Sect. 6 with the requirement of four particle
level jets with pT > 30 GeV. This provides the differential cross section as a function of the
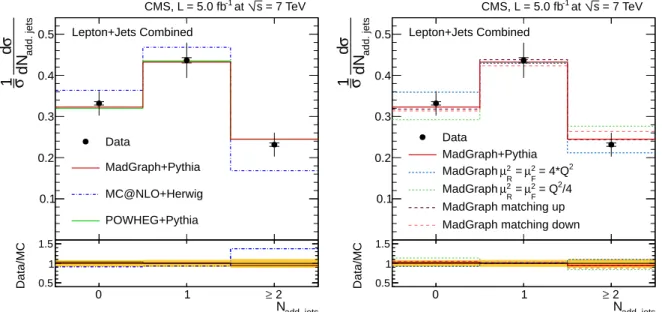
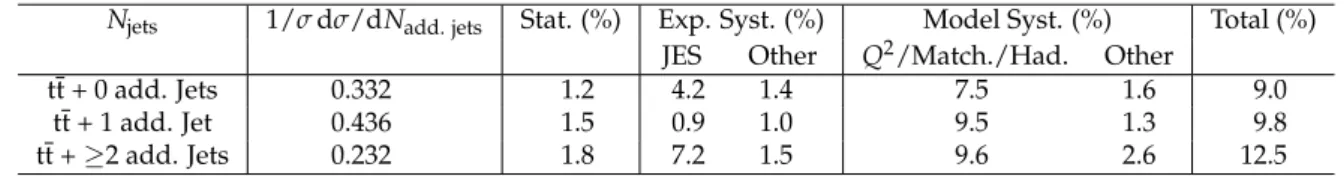
number of additional jets, which is finally normalised to the total cross section measured in the same phase space. The results are shown in Fig. 6 and summarised in Table 4.
For each tt + additional jet template used in the maximum-likelihood fit, a full correlation is assumed between the rate of events that fulfill the particle-level selection and the rate of events that do not. Therefore, a single template is used for both parts.
Including an additional template made from events that are not inside the visible phase space leads to fit results that are compatible within the estimated uncertainties. To check the model dependency, the fit is repeated using simulated data fromMC@NLO+HERWIGandPOWHEG+PYTHIA
14 7 Normalised differential cross section as a function of the additional jet multiplicity
instead of MADGRAPH+PYTHIA. The results are stable within the uncertainties.
Figure 5: Result of the simultaneous template fit to thepχ2distribution in the`+jets channel. All templates are scaled to the resulting fit parameters.
0 1 2 add. jets dN σ d σ 1 0.1 0.2 0.3 0.4 0.5 Data MadGraph+Pythia MC@NLO+Herwig POWHEG+Pythia = 7 TeV s at -1 CMS, L = 5.0 fb Lepton+Jets Combined add. jets N 0 1 ≥ 2 Data/MC 0.5 1 1.5 0 1 2 add. jets dN σ d σ 1 0.1 0.2 0.3 0.4 0.5 Data MadGraph+Pythia 2 = 4*Q 2 F µ = 2 R µ MadGraph /4 2 = Q 2 F µ = 2 R µ MadGraph MadGraph matching up MadGraph matching down
= 7 TeV s at -1 CMS, L = 5.0 fb Lepton+Jets Combined add. jets N 0 1 ≥ 2 Data/MC 0.5 1 1.5
Figure 6: Normalised differential tt production cross section as a function of the number of additional jets in the `+jets channel. The measurement is compared to predictions from
MADGRAPH+PYTHIA,POWHEG+PYTHIA, andMC@NLO+HERWIG(left), as well as from MAD
-GRAPHwith varied renormalisation and factorisation scales, and jet-parton matching threshold
(right). The inner (outer) error bars indicate the statistical (combined statistical and systematic) uncertainty. The shaded band corresponds to the combined statistical and systematic uncer-tainty
The sources of systematic uncertainties are the same as those discussed in Sect. 5, except for the background normalisations, which are constrained in the fit. Their effect is propagated to the fit uncertainty, which is quoted as the statistical uncertainty. The impact of the systematic uncertainties on the extracted fractions of tt + 0, 1, and ≥2 additional jets is evaluated using
Table 4: Normalised differential tt production cross section as a function of the jet multiplicity for jets with pT > 30 GeV in the dilepton channel. The statistical, systematic, and total
uncer-tainties are also shown. The main experimental and model systematic unceruncer-tainties are dis-played: JES and the combination of renormalisation and factorisation scales, jet-parton match-ing threshold, and hadronisation (in the table “Q2/Match./Had.”)
Njets 1/σ dσ/dNadd. jets Stat. (%) Exp. Syst. (%) Model Syst. (%) Total (%)
JES Other Q2/Match./Had. Other
tt + 0 add. Jets 0.332 1.2 4.2 1.4 7.5 1.6 9.0
tt + 1 add. Jet 0.436 1.5 0.9 1.0 9.5 1.3 9.8
tt +≥2 add. Jets 0.232 1.8 7.2 1.5 9.6 2.6 12.5
pseudo-experiments. The most important contributions to the systematic uncertainties orig-inate from JES (up to 7%) and modelling uncertainties: hadronisation (up to 6%), jet-parton matching threshold (up to 5%), and renormalisation and factorisation scales (up to 4%).
The MC@NLO+HERWIG prediction produces fewer events with ≥2 additional jets than data,
which are well described by MADGRAPH+PYTHIAandPOWHEG+PYTHIA. The prediction from
MADGRAPH+PYTHIA with lower renormalisation and factorisation scales provides a worse
description of the data. These observations are in agreement with those presented in Sect. 6.
8
Additional jet gap fraction
An alternative way to investigate the jet activity arising from quark and gluon radiation pro-duced in association with the tt system is to determine the fraction of events that do not con-tain additional jets above a given threshold. This measurement is performed using events in the dilepton decay channel after fulfilling the event reconstruction and selection requirements discussed in Sect. 4. The additional jets are defined as those not assigned to the tt system by the kinematic reconstruction described in Sect. 4.2.
A threshold observable, referred to as gap fraction [6], is defined as: f(pT) =
N(pT)
Ntotal
, (2)
where Ntotal is the number of selected events and N(pT)is the number of events that do not
contain additional jets above a pTthreshold in the whole pseudorapidity range used in the
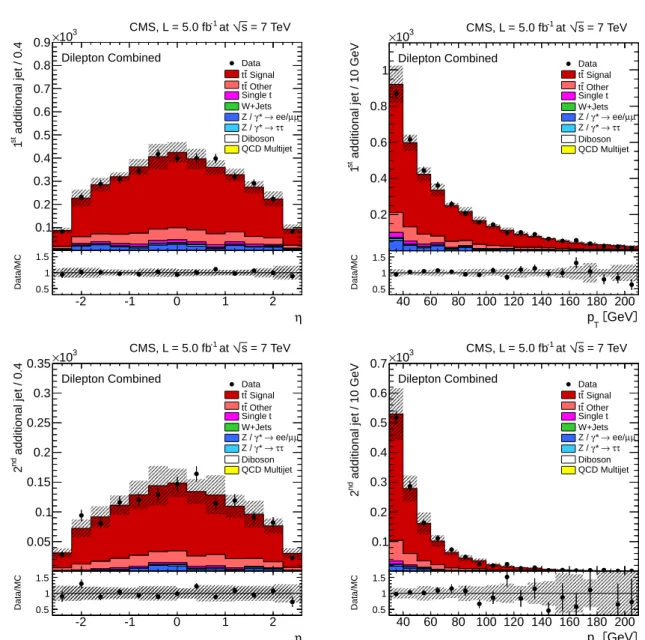
anal-ysis (|η| <2.4). The pseudorapidity and pTdistributions of the first and second leading (in pT)
additional reconstructed jets are presented in Fig. 7. The distributions show good agreement between data and the simulation.
The veto can be extended beyond the additional leading jet criteria by defining the gap fraction as
f(HT) =
N(HT)
Ntotal
, (3)
where N(HT)is the number of events in which HT, the scalar sum of the pT of the additional
jets (with pT >30 GeV), is less than a certain threshold.
For each value of pT and HT thresholds, the gap fraction is evaluated at particle level in the
visible phase space defined in Sect. 6. The additional jets at particle level are defined as all jets within the kinematic acceptance not including the two highest-pT b jets containing the decay
products of different b hadrons. They are required to fulfill the condition that they are not within a cone of∆R=0.4 from any of the two isolated leptons, as described in Sect. 6.
16 8 Additional jet gap fraction additional jet / 0.4 st 1 0.1 0.2 0.3 0.4 0.5 0.6 0.7 0.8 0.9 3 10 × Data Signal t t Other t t Single t W+Jets µ µ ee/ → * γ Z / τ τ → * γ Z / Diboson QCD Multijet Dilepton Combined = 7 TeV s at -1 CMS, L = 5.0 fb η -2 -1 0 1 2 Data/MC 0.5 1 1.5
additional jet / 10 GeV
st 1 0.2 0.4 0.6 0.8 1 3 10 × Data Signal t t Other t t Single t W+Jets µ µ ee/ → * γ Z / τ τ → * γ Z / Diboson QCD Multijet Dilepton Combined = 7 TeV s at -1 CMS, L = 5.0 fb GeV T p 40 60 80 100 120 140 160 180 200 Data/MC 0.5 1 1.5 additional jet / 0.4 nd 2 0.05 0.1 0.15 0.2 0.25 0.3 0.35 3 10 × Data Signal t t Other t t Single t W+Jets µ µ ee/ → * γ Z / τ τ → * γ Z / Diboson QCD Multijet Dilepton Combined = 7 TeV s at -1 CMS, L = 5.0 fb η -2 -1 0 1 2 Data/MC 0.5 1 1.5
additional jet / 10 GeV
nd 2 0.1 0.2 0.3 0.4 0.5 0.6 0.7 3 10 × Data Signal t t Other t t Single t W+Jets µ µ ee/ → * γ Z / τ τ → * γ Z / Diboson QCD Multijet Dilepton Combined = 7 TeV s at -1 CMS, L = 5.0 fb GeV T p 40 60 80 100 120 140 160 180 200 Data/MC 0.5 1 1.5
Figure 7: Distribution of the η (left) and the pT(right) of the first (top) and second (bottom)
lead-ing additional reconstructed jets compared to signal and background simulated samples. The error bars on the data points indicate the statistical uncertainty. The hatched band represents the combined effect of all sources of systematic uncertainty.
Given the large purity of the selected events for any value of pTand HT, a correction for detector
effects is applied following a simpler approach than the unfolding method used in Sect. 6. Here, the ratio of the particle-level to the simulated gap fraction distributions, obtained with the tt sample from MADGRAPH, provides the correction which is applied to the data.
The measured gap-fraction distribution is compared to predictions from MADGRAPH+PYTHIA,
POWHEG+PYTHIA, andMC@NLO+HERWIG, and to the predictions from the MADGRAPH
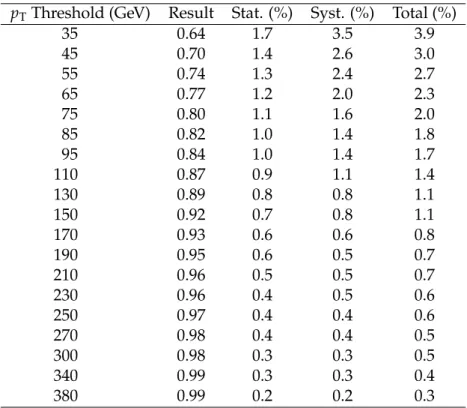
sam-ples with varied renormalisation and factorisation scales and jet-parton matching threshold. In Fig. 8 the gap fraction is measured as a function of the pT of the leading additional jet (left)
and as a function of HT (right), with the thresholds (defined at the abscissa where the data
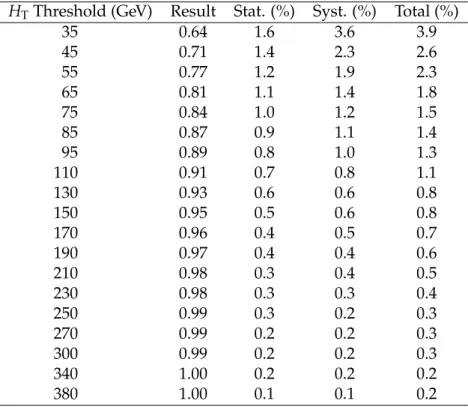
point is shown) varied between 35 and 380 GeV. The results are summarised in Table 5 and Table 6, respectively. The measurements are consistent among the three dilepton channels. The gap fraction is lower as a function of HT showing that the measurement is probing quark and
gluon emission beyond the first emission. The gap fraction is better described by MC@NLO
+HERWIGcompared to MADGRAPH+PYTHIAandPOWHEG+PYTHIA. This result is not
incom-patible with the observation described above, because the gap fraction requires the jets to have a certain pTabove the threshold, which does not imply necessarily large jet multiplicities.
De-creasing the renormalisation and factorisation scales or matching threshold in the MADGRAPH
sample worsens the agreement between data and simulation.
Table 5: Measured gap fraction as a function of the additional jet pT. The statistical, systematic,
and total uncertainties are also shown.
pTThreshold (GeV) Result Stat. (%) Syst. (%) Total (%)
35 0.64 1.7 3.5 3.9 45 0.70 1.4 2.6 3.0 55 0.74 1.3 2.4 2.7 65 0.77 1.2 2.0 2.3 75 0.80 1.1 1.6 2.0 85 0.82 1.0 1.4 1.8 95 0.84 1.0 1.4 1.7 110 0.87 0.9 1.1 1.4 130 0.89 0.8 0.8 1.1 150 0.92 0.7 0.8 1.1 170 0.93 0.6 0.6 0.8 190 0.95 0.6 0.5 0.7 210 0.96 0.5 0.5 0.7 230 0.96 0.4 0.5 0.6 250 0.97 0.4 0.4 0.6 270 0.98 0.4 0.4 0.5 300 0.98 0.3 0.3 0.5 340 0.99 0.3 0.3 0.4 380 0.99 0.2 0.2 0.3
The total systematic uncertainty is about 3.5% for values of the threshold (pT or HT) below
40 GeV, and decreases to 0.2% for values of the thresholds above 200 GeV. Dominant sources of systematic uncertainty arise from the uncertainty in the JES and the background contamina-tion, corresponding to approximately 2% and 1% systematic uncertainty, respectively, for the smallest pT and HT values. Other sources with smaller impact on the total uncertainty are the
b-tagging efficiency, JER, pileup, and the procedure used to correct the data to particle level.
9
Summary
Measurements of the normalised differential tt production cross section as a function of the number of jets in the dilepton (ee, µµ, and eµ) and`+jets (e+jets, µ+jets) channels are presented. The measurements are performed using a data sample corresponding to an integrated luminos-ity of 5.0 fb−1 collected in pp collisions at√s = 7 TeV with the CMS detector. The results are presented in the visible phase space and compared with predictions of perturbative quantum chromodynamics from MADGRAPH and POWHEG interfaced with PYTHIA, and MC@NLO in-terfaced with HERWIG, as well as MADGRAPH with varied renormalisation and factorisation scales, and jet-parton matching threshold. The normalised differential tt production cross sec-tion is also measured as a funcsec-tion of the jets radiated in addisec-tion to the tt decay products in the
18 9 Summary
Table 6: Measured gap fraction as a function of HT= ∑ padd. jetsT . The statistical, systematic, and
total uncertainties are also shown.
HTThreshold (GeV) Result Stat. (%) Syst. (%) Total (%)
35 0.64 1.6 3.6 3.9 45 0.71 1.4 2.3 2.6 55 0.77 1.2 1.9 2.3 65 0.81 1.1 1.4 1.8 75 0.84 1.0 1.2 1.5 85 0.87 0.9 1.1 1.4 95 0.89 0.8 1.0 1.3 110 0.91 0.7 0.8 1.1 130 0.93 0.6 0.6 0.8 150 0.95 0.5 0.6 0.8 170 0.96 0.4 0.5 0.7 190 0.97 0.4 0.4 0.6 210 0.98 0.3 0.4 0.5 230 0.98 0.3 0.3 0.4 250 0.99 0.3 0.2 0.3 270 0.99 0.2 0.2 0.3 300 0.99 0.2 0.2 0.3 340 1.00 0.2 0.2 0.2 380 1.00 0.1 0.1 0.2
well up to high jet multiplicities, while MC@NLO+HERWIG predicts fewer events with large number of jets. The gap fraction is measured in dilepton events as a function of the pT of the
leading additional jet and the scalar sum of the pTof the additional jets, and is also compared
to different theoretical predictions. No significant deviations are observed between data and simulation. TheMC@NLO+HERWIGmodel seems to more accurately describe the gap fraction for all values of the thresholds compared to MADGRAPH+PYTHIAandPOWHEG+PYTHIA.
Acknowledgements
We congratulate our colleagues in the CERN accelerator departments for the excellent perfor-mance of the LHC and thank the technical and administrative staffs at CERN and at other CMS institutes for their contributions to the success of the CMS effort. In addition, we gratefully acknowledge the computing centres and personnel of the Worldwide LHC Computing Grid for delivering so effectively the computing infrastructure essential to our analyses. Finally, we acknowledge the enduring support for the construction and operation of the LHC and the CMS detector provided by the following funding agencies: BMWFW and FWF (Austria); FNRS and FWO (Belgium); CNPq, CAPES, FAPERJ, and FAPESP (Brazil); MES (Bulgaria); CERN; CAS, MoST, and NSFC (China); COLCIENCIAS (Colombia); MSES and CSF (Croatia); RPF (Cyprus); MoER, SF0690030s09 and ERDF (Estonia); Academy of Finland, MEC, and HIP (Finland); CEA and CNRS/IN2P3 (France); BMBF, DFG, and HGF (Germany); GSRT (Greece); OTKA and NIH (Hungary); DAE and DST (India); IPM (Iran); SFI (Ireland); INFN (Italy); NRF and WCU (Re-public of Korea); LAS (Lithuania); MOE and UM (Malaysia); CINVESTAV, CONACYT, SEP, and UASLP-FAI (Mexico); MBIE (New Zealand); PAEC (Pakistan); MSHE and NSC (Poland); FCT (Portugal); JINR (Dubna); MON, RosAtom, RAS and RFBR (Russia); MESTD (Serbia); SEIDI and CPAN (Spain); Swiss Funding Agencies (Switzerland); MST (Taipei); ThEPCenter, IPST, STAR and NSTDA (Thailand); TUBITAK and TAEK (Turkey); NASU and SFFR (Ukraine);
50 100 150 200 250 300 350 400 Gap fraction 0.6 0.65 0.7 0.75 0.8 0.85 0.9 0.95 1 1.05 = 7 TeV s at -1 CMS, L = 5.0 fb Dilepton Combined Data Syst+Stat error MadGraph+Pythia POWHEG+Pythia MC@NLO+Herwig Data Syst+Stat error MadGraph+Pythia POWHEG+Pythia MC@NLO+Herwig Data Syst+Stat error MadGraph+Pythia POWHEG+Pythia MC@NLO+Herwig [GeV] T additional jet p st 1 50 100 150 200 250 300 350 400 Data/MC 0.9 1 1.1 50 100 150 200 250 300 350 400 Gap fraction 0.6 0.65 0.7 0.75 0.8 0.85 0.9 0.95 1 1.05 = 7 TeV s at -1 CMS, L = 5.0 fb Dilepton Combined Data Syst+Stat error MadGraph+Pythia POWHEG+Pythia MC@NLO+Herwig Data Syst+Stat error MadGraph+Pythia POWHEG+Pythia MC@NLO+Herwig Data Syst+Stat error MadGraph+Pythia POWHEG+Pythia MC@NLO+Herwig [GeV] T H 50 100 150 200 250 300 350 400 Data/MC 0.9 1 1.1 50 100 150 200 250 300 350 400 Gap fraction 0.6 0.65 0.7 0.75 0.8 0.85 0.9 0.95 1 1.05 = 7 TeV s at -1 CMS, L = 5.0 fb Dilepton Combined Data Syst+Stat error MadGraph+Pythia 2 = 4*Q 2 F µ = 2 R µ MadGraph /4 2 = Q 2 F µ = 2 R µ MadGraph MadGraph matching up MadGraph matching down Data Syst+Stat error MadGraph+Pythia 2 = 4*Q 2 F µ = 2 R µ MadGraph /4 2 = Q 2 F µ = 2 R µ MadGraph MadGraph matching up MadGraph matching down Data Syst+Stat error MadGraph+Pythia 2 = 4*Q 2 F µ = 2 R µ MadGraph /4 2 = Q 2 F µ = 2 R µ MadGraph MadGraph matching up MadGraph matching down Data Syst+Stat error MadGraph+Pythia 2 = 4*Q 2 F µ = 2 R µ MadGraph /4 2 = Q 2 F µ = 2 R µ MadGraph MadGraph matching up MadGraph matching down Data Syst+Stat error MadGraph+Pythia 2 = 4*Q 2 F µ = 2 R µ MadGraph /4 2 = Q 2 F µ = 2 R µ MadGraph MadGraph matching up MadGraph matching down
[GeV] T additional jet p st 1 50 100 150 200 250 300 350 400 Data/MC 0.9 1 1.1 50 100 150 200 250 300 350 400 Gap fraction 0.6 0.65 0.7 0.75 0.8 0.85 0.9 0.95 1 1.05 = 7 TeV s at -1 CMS, L = 5.0 fb Dilepton Combined Data Syst+Stat error MadGraph+Pythia 2 = 4*Q 2 F µ = 2 R µ MadGraph /4 2 = Q 2 F µ = 2 R µ MadGraph MadGraph matching up MadGraph matching down Data Syst+Stat error MadGraph+Pythia 2 = 4*Q 2 F µ = 2 R µ MadGraph /4 2 = Q 2 F µ = 2 R µ MadGraph MadGraph matching up MadGraph matching down Data Syst+Stat error MadGraph+Pythia 2 = 4*Q 2 F µ = 2 R µ MadGraph /4 2 = Q 2 F µ = 2 R µ MadGraph MadGraph matching up MadGraph matching down Data Syst+Stat error MadGraph+Pythia 2 = 4*Q 2 F µ = 2 R µ MadGraph /4 2 = Q 2 F µ = 2 R µ MadGraph MadGraph matching up MadGraph matching down Data Syst+Stat error MadGraph+Pythia 2 = 4*Q 2 F µ = 2 R µ MadGraph /4 2 = Q 2 F µ = 2 R µ MadGraph MadGraph matching up MadGraph matching down
[GeV] T H 50 100 150 200 250 300 350 400 Data/MC 0.9 1 1.1
Figure 8: Measured gap fraction as a function of the additional jet pT (left) and of HT =
∑ padd. jetsT (right) in the dilepton channels. Data are compared to predictions from MAD
-GRAPH+PYTHIA, POWHEG+PYTHIA, and MC@NLO+HERWIG (top), as well as from MAD
-GRAPHwith varied renormalisation and factorisation scales, and jet-parton matching threshold (bottom). The error bars on the data points indicate the statistical uncertainty. The shaded band corresponds to the combined statistical and total systematic uncertainty (added in quadrature). STFC (United Kingdom); DOE and NSF (USA).
Individuals have received support from the Marie-Curie programme and the European Re-search Council and EPLANET (European Union); the Leventis Foundation; the A. P. Sloan Foundation; the Alexander von Humboldt Foundation; the Belgian Federal Science Policy Of-fice; the Fonds pour la Formation `a la Recherche dans l’Industrie et dans l’Agriculture (FRIA-Belgium); the Agentschap voor Innovatie door Wetenschap en Technologie (IWT-(FRIA-Belgium); the Ministry of Education, Youth and Sports (MEYS) of Czech Republic; the Council of Science and Industrial Research, India; the Compagnia di San Paolo (Torino); the HOMING PLUS pro-gramme of Foundation for Polish Science, cofinanced by EU, Regional Development Fund; and the Thalis and Aristeia programmes cofinanced by EU-ESF and the Greek NSRF.
20 References
References
[1] S. Dittmaier, P. Uwer, and S. Weinzierl, “NLO QCD corrections to t¯t + jet production at hadron colliders”, Phys. Rev. Lett. 98 (2007) 262002,
doi:10.1103/PhysRevLett.98.262002, arXiv:hep-ph/0703120.
[2] G. Bevilacqua, M. Czakon, C. G. Papadopoulos, and M. Worek, “Hadronic top-quark pair production in association with two jets at Next-to-Leading Order QCD”, Phys. Rev. D 84 (2011) 114017, doi:10.1103/PhysRevD.84.114017, arXiv:1108.2851.
[3] M. I. Gresham, I.-W. Kim, and K. M. Zurek, “Searching for top flavor violating
resonances”, Phys. Rev. D 84 (2011) 034025, doi:10.1103/PhysRevD.84.034025, arXiv:1102.0018.
[4] CMS Collaboration, “The CMS experiment at the CERN LHC”, JINST 3 (2008) S08004, doi:10.1088/1748-0221/3/08/S08004.
[5] CMS Collaboration, “Measurement of differential top-quark-pair production cross sections in pp collisions at√s =7 TeV”, Eur. Phys. J. C 73 (2013) 2339,
doi:10.1140/epjc/s10052-013-2339-4, arXiv:hep-ex/1211.2220.
[6] ATLAS Collaboration, “Measurement of t¯t production with a veto on additional central jet activity in pp collisions at√s = 7 TeV using the ATLAS detector”, Eur. Phys. J. C 72 (2012) 2043, doi:10.1140/epjc/s10052-012-2043-9, arXiv:1203.5015. [7] J. Alwall et al., “MadGraph 5: going beyond”, JHEP 06 (2011) 128,
doi:10.1007/JHEP06(2011)128, arXiv:1106.0522.
[8] T. Sj ¨ostrand, S. Mrenna, and P. Z. Skands, “PYTHIA 6.4 physics and manual”, JHEP 05 (2006) 026, doi:10.1088/1126-6708/2006/05/026, arXiv:hep-ph/0603175. [9] M. L. Mangano, M. Moretti, F. Piccinini, and M. Treccani, “Matching matrix elements and
shower evolution for top-quark production in hadronic collisions”, JHEP 01 (2007) 013, doi:10.1088/1126-6708/2007/01/013, arXiv:hep-ph/0611129.
[10] CMS Collaboration, “Measurement of the underlying event activity at the LHC with√ s =7 TeV and comparison with√s =0.9 TeV”, JHEP 09 (2011) 109,
doi:10.1007/JHEP09(2011)109, arXiv:1107.0330.
[11] J. Pumplin et al., “New generation of parton distributions with uncertainties from global QCD analysis”, JHEP 07 (2002) 012, doi:10.1088/1126-6708/2002/07/012, arXiv:hep-ph/0201195.
[12] P. Nason, “A New method for combining NLO QCD with shower Monte Carlo algorithms”, JHEP 11 (2004) 040, doi:10.1088/1126-6708/2004/11/040, arXiv:hep-ph/0409146.
[13] S. Frixione, P. Nason, and C. Oleari, “Matching NLO QCD computations with Parton Shower simulations: the POWHEG method”, JHEP 11 (2007) 070,
doi:10.1088/1126-6708/2007/11/070, arXiv:0709.2092.
[14] S. Alioli, P. Nason, C. Oleari, and E. Re, “NLO single-top production matched with shower in POWHEG: s- and t-channel contributions”, JHEP 09 (2009) 111,
doi:10.1088/1126-6708/2009/09/111, arXiv:0907.4076. [Erratum doi:10.1007/JHEP02(2010)011].
[15] E. Re, “Single-top Wt-channel production matched with parton showers using the
POWHEGmethod”, Eur. Phys. J. C 71 (2011) 1547,
doi:10.1140/epjc/s10052-011-1547-z, arXiv:1009.2450.
[16] S. Frixione and B. R. Webber, “Matching NLO QCD computations and parton shower simulations”, JHEP 06 (2002) 29, doi:10.1088/1126-6708/2002/06/029, arXiv:hep-ph/0204244.
[17] G. Corcella et al., “HERWIG 6: An event generator for hadron emission reactions with interfering gluons (including supersymmetric processes)”, JHEP 01 (2001) 010, doi:10.1088/1126-6708/2001/01/010, arXiv:hep-ph/0011363.
[18] N. Kidonakis, “NNLL resummation for s-channel single top quark production”, Phys. Rev. D 81 (2010) 054028, doi:10.1103/PhysRevD.81.054028, arXiv:1001.5034. [19] N. Kidonakis, “Next-to-next-to-leading-order collinear and soft gluon corrections for
t-channel single top quark production”, Phys. Rev. D 83 (2011) 091503, doi:10.1103/PhysRevD.83.091503, arXiv:1103.2792.
[20] N. Kidonakis, “Two-loop soft anomalous dimensions for single top quark associated production with W−or H−”, Phys. Rev. D 82 (2010) 054018,
doi:10.1103/PhysRevD.82.054018, arXiv:hep-ph/1005.4451.
[21] J. M. Campbell, R. K. Ellis, and C. Williams, “Vector boson pair production at the LHC”, JHEP 07 (2011) 018, doi:10.1007/JHEP07(2011)018, arXiv:1105.0020.
[22] M. Czakon and A. Mitov, “Top++: a program for the calculation of the top-pair cross-section at hadron colliders”, (2011). arXiv:1112.5675.
[23] S. Alekhin et al., “The PDF4LHC Working Group Interim Report”, (2011). arXiv:1101.0536.
[24] M. Botje et al., “The PDF4LHC Working Group Interim Recommendations”, (2011). arXiv:1101.0538.
[25] A. D. Martin, W. J. Stirling, R. S. Thorne, and G. Watt, “Parton distributions for the LHC”, Eur. Phys. J. C 63 (2009) 189, doi:10.1140/epjc/s10052-009-1072-5,
arXiv:0901.0002.
[26] H.-L. Lai et al., “New parton distributions for collider physics”, Phys. Rev. D 82 (2010) 074024, doi:10.1103/PhysRevD.82.074024, arXiv:1007.2241.
[27] J. Gao et al., “CT10 next-to-next-to-leading order global analysis of QCD”, Phys. Rev. D
89(2014) 033009, doi:10.1103/PhysRevD.89.033009, arXiv:1302.6246. [28] NNPDF Collaboration, “Parton distributions with LHC data”, Nucl. Phys. B 867 (2013)
244, doi:10.1016/j.nuclphysb.2012.10.003, arXiv:1207.1303.
[29] GEANT4 Collaboration, “GEANT4—a simulation toolkit”, Nucl. Instrum. Meth. A 506
(2003) 250, doi:10.1016/S0168-9002(03)01368-8.
[30] CMS Collaboration, “Particle–Flow Event Reconstruction in CMS and Performance for Jets, Taus, and EmissT ”, CMS Physics Analysis Summary CMS-PAS-PFT-09-001, 2009.
22 References
[31] CMS Collaboration, “Commissioning of the Particle-Flow Reconstruction in Minimum-Bias and Jet Events from pp Collisions at 7 TeV”, CMS Physics Analysis Summary CMS-PAS-PFT-10-002, 2010.
[32] M. Cacciari, G. P. Salam, and G. Soyez, “The catchment area of jets”, JHEP 04 (2008) 005, doi:10.1088/1126-6708/2008/04/005, arXiv:0802.1188.
[33] CMS Collaboration, “Electron Reconstruction and Identification at√s=7 TeV”, CMS Physics Analysis Summary CMS-PAS-EGM-10-004, 2010.
[34] CMS Collaboration, “Performance of CMS muon reconstruction in pp collision events at√ s =7 TeV”, JINST 7 (2012) P10002, doi:10.1088/1748-0221/7/10/P10002, arXiv:1206.4071.
[35] CMS Collaboration, “Determination of jet energy calibration and transverse momentum resolution in CMS”, JINST 6 (2011) P11002,
doi:10.1088/1748-0221/6/11/P11002, arXiv:1107.4277.
[36] M. Cacciari and G. P. Salam, “Dispelling the N3myth for the ktjet-finder”, Phys. Lett. B 641(2006) 57, doi:10.1016/j.physletb.2006.08.037,
arXiv:hep-ph/0512210.
[37] M. Cacciari, G. P. Salam, and G. Soyez, “The anti-ktjet clustering algorithm”, JHEP 04
(2008) 063, doi:10.1088/1126-6708/2008/04/063, arXiv:0802.1189. [38] M. Cacciari, G. P. Salam, and G. Soyez, “FastJet user manual”, (2011).
arXiv:1111.6097.
[39] CMS Collaboration, “Identification of b-quark jets with the CMS experiment”, JINST 08 (2013) P04013, doi:10.1088/1748-0221/8/04/P04013, arXiv:1211.4462. [40] Particle Data Group, J. Beringer et al., “Review of Particle Physics”, Phys. Rev. D 86
(2012) 010001, doi:10.1103/PhysRevD.86.010001.
[41] CMS Collaboration, “Measurement of the t¯t production cross section and the top quark mass in the dilepton channel in pp collisions at√s =7 TeV”, JHEP 07 (2011) 049, doi:10.1007/JHEP07(2011)049, arXiv:1105.5661.
[42] CMS Collaboration, “Measurement of the electron charge asymmetry in inclusive W production in pp collisions at√s =7 TeV”, Phys. Rev. Lett. 109 (2012) 111806, doi:10.1103/PhysRevLett.109.111806, arXiv:1206.2598.
[43] CMS Collaboration, “Measurement of the t¯t production cross section in pp collisions at√ s =7 TeV with lepton + jets final states”, Phys. Lett. B 720 (2013) 83,
doi:10.1016/j.physletb.2013.02.021, arXiv:1212.6682.
[44] CMS Collaboration, “Jet Energy Resolution in CMS at√s=7 TeV”, CMS Physics Analysis Summary CMS-PAS-JME-10-014, 2010.
[45] P. Z. Skands and D. Wicke, “Non-perturbative QCD effects and the top mass at the Tevatron”, Eur. Phys. J. C 52 (2007) 133, doi:10.1140/epjc/s10052-007-0352-1, arXiv:hep-ph/0703081.
[46] P. Z. Skands, “Tuning Monte Carlo generators: The Perugia tunes”, Phys. Rev. D 82 (2010) 074018, doi:10.1103/PhysRevD.82.074018, arXiv:1005.3457.
[47] CMS Collaboration, “Measurement of the tt production cross section in pp collisions at√ s =7 TeV using the kinematic properties of events with leptons and jets”, Eur. Phys. J. C 71 (2011) 1721, doi:10.1140/epjc/s10052-011-1721-3, arXiv:1106.0902. [48] CMS Collaboration, “Measurement of the t¯t production cross section in the dilepton
channel in pp collisions at√s =7 TeV”, JHEP 11 (2012) 067, doi:10.1007/JHEP11(2012)067, arXiv:1208.2671.
[49] CMS Collaboration, “Absolute Calibration of the Luminosity Measurement at CMS: Winter 2012 Update”, CMS Physics Analysis Summary CMS-PAS-SMP-12-008, 2012. [50] A. H ¨ocker and V. Kartvelishvili, “SVD approach to data unfolding”, Nucl. Instrum. Meth.
A 372 (1996) 469, doi:10.1016/0168-9002(95)01478-0, arXiv:hep-ph/9509307.
[51] V. Blobel, “An unfolding method for high energy physics experiments”, (2002). arXiv:hep-ex/0208022.
[52] F. James, “Statistical methods in experimental physics, 2nd edition”. World Scientific, (2006).