M
ASTER
E
CONOMICS
M
ASTER
’
S
F
INAL
W
ORK
D
ISSERTATION
P
ROFITABILITY AND
L
IABILITY OF SIZE
:
E
VIDENCE OF
P
ORTUGAL
S
OFIA
A
LEXANDRA
M
ELIM
F
ONSECA
M
ASTER
E
CONOMICS
M
ASTER
’
S
F
INAL
W
ORK
D
ISSERTATION
P
ROFITABILITY AND
L
IABILITY OF SIZE
:
E
VIDENCE OF
P
ORTUGAL
S
OFIA
A
LEXANDRA
M
ELIM
F
ONSECA
S
UPERVISION
:
P
ROFESSORA
M
ARIA
J
OÃO
G
UEDES
i
Profitability and Liability of size: Evidence of Portugal
Abstract
This thesis provides a comprehensive study on the effects of size on profitability for new venture firms, covering a period of 8 years, between 2010 and 2018.
Overall, the results obtained indicate that size has a positive impact on the profitability of new venture firms. In particular, increases in the number of employees will cause positive effect on the return on assets, in all the three estimated models, thus suggesting the existence of the liability of smallness in the new firms.
Furthermore, this study accounts for both linear and non-linear effects, as well as for the inclusion of age as a moderator. Additionally, this study confirms the robustness of the results using different size and profitability measures.
Keywords: Liability of size, Size, Profitability, Liability of smallness, New Ventures.
ii
Profitability and Liability of size: Evidence of Portugal
Resumo
A presente tese apresenta um estudo do efeito do tamanho na rendibilidade das empresas recém-criadas, cobrindo um período de 8 anos, entre 2010 e 2018.
No geral, os resultados obtidos indicam que o tamanho tem um impacto positivo na rendibilidade de novas empresas. Em particular, aumentos no número de empregados têm uma relação positiva com a rendibilidade dos ativos sugerindo a existência de ”liability of smalless”.
Adicionalmente, a análise efetuada considera efeitos lineares e não lineares, assim como a inclusão da idade das empresas como moderador. este Os resultados obtidos são robustos a diferentes medidas de tamanho e rendibilidade.
Palavras-chave: Fragilidades associadas ao tamanho, Tamanho, Rendibilidade, Fragilidades de pequenas empresas, Novas Empresas.
iii
Acknowledgements
I am beyond grateful to my supervisor, professor Maria João Guedes, for all the support and for always pushing me further. This work would not have been possible without her.
I would also like to thank ISEG, for providing me the best 5 years of my life and for being a university of excellence, of which I will always be proud to have been part of.
To my co-workers in Caixa Geral de Depósitos, for all that they have taught me throughout this year, for all the understanding and for being my friends above all else.
To all my friends that have gone through the same process as I, for always having each other’s back, for being an outstanding motivation driver and for never complaining about the lack of time that has marked this last month.
To my family, most importantly my parents, for being an example of determination and hard work, for all the opportunities that they have provided me and that have allowed me to be where I am today, and for all the love that I have received in my life. I will never have words to thank you enough.
To Nico, for always being there to hear and to support me, for taking care of me, for never letting me give up and for being the amazing person that I have the luck to have by my side.
Finally, I would like to thank my grandparents, for being such an enormous contribution to the person I am today, and for always seeing my dreams as if it were their own. This work is dedicated to you.
iv
Contents
I. Introduction ... 1
II. Theoretical background and hypothesis ... 4
2.1. Size and profitability ... 4
2.1.1. Positive relation between size and profitability ... 4
2.1.2. Negative relation between size and profitability ... 6
2.1.3. Evidence and Hypothesis ... 8
III. Econometric Data and Methodology ... 10
3.1. Sample ... 10
3.2. Variables description ... 11
IV. Estimation Results ... 14
4.1. Linear Effects ... 14
4.2. Non-Linear Effects ... 16
4.3. Age as a moderator effect ... 18
V. Robustness estimations ... 20
5.1. Sales ... 20
5.2. Assets ... 21
5.3. Return on Sales ... 22
5.4. Manufacturing and non-manufacturing firms ... 24
VI. Discussion of results ... 27
VII. Conclusion ... 28
VIII. Limitations and future research ... 30
References ... 31
v
List of Tables
Table I –Operationalization of the variables of the study ... 11
Table II - Sample description. Mean, SD, and pairwise correlations ... 13
Table III - Linear OLS regressions results ... 15
Table IV - Non-linear OLS regressions results ... 17
Table V - Age moderator effect OLS regressions results ... 18
Table VI - Linear OLS regressions results with Sales... 21
Table VII - Linear OLS regressions results with Assets ... 22
Table VIII - Comparison between ROA and ROS regression results ... 23
Table IX - Comparison between estimation results for manufacturing and non-manufacturing firms ... 26
vi
Glossary
ATR – Asset Turnover Ratio
CAE – Código das Atividades Empresariais DR – Debt Ratio
Emp – Employees
FAR – Fixed Assets Ratio FLR – Financial Leverage Ratio ROA – Return on Assets
1
I. Introduction
The discussion on whether profitability contributes to economic growth has been of considerable importance to many researchers. According to a Schumpeterian perspective, firms will tend to increase their capital equipment and conduct more research, investing a higher share in order to reinforce their innovation rate, if there is a perspective of an increase in their profitability by doing so (Papadogonas, 2007).
According to Ilaboya & Ohiokha (2016), profitability can be defined as a measure of the level of profits in comparison to the volume of activities. The concepts of profit and profitability are related, but differences can be observed between them. While profit is the difference between revenues and costs, profitability is a relative measure, reflecting both the efficiency and the performance of a firm (Ilaboya & Ohiokha, 2016). Additionally, according to Tulsian (2014), it is possible to state that the level of profits cannot be used to compare the efficiency between firms, since a higher level of profits is not necessarily associated with a strong efficiency and, on the other hand, a low level of profits might not always imply a deterioration of the firms’ activity. In this way, profitability reveals to be the most adequate measure in order to analyse whether or not the firm is operating in an efficient way (Tulsian, 2014).
To date, the understanding on the determinants of profitability has focused mainly on established firms and, existing an imperfect understanding on the determinants of profitability for new ventures. In order to advance the knowledge in the area, the present study focuses on new ventures as they are key contributors to economic growth and job creation and, therefore, its success or failure is a concern that must be held by policy makers (Patel, Guedes & Pearce, 2017).
There are important factors that influence a firm’s profitability. One of the most important factors is size. From small to large firms, it is possible to detect strengths and liabilities associated with their size, with a wide range of arguments that have been explored over the years (Kipesha, 2013). Size plays an important role on firms’ profitability. On one hand, small firms may not be able to access resources, funding and markets ad they lack critical mass to do so. This is known as the liability of smallness, which translates into the hazards that smaller firms face and that may threaten their survival (Kale & Arditi, 1998). On the other hand, larger firms, who benefit from
2
economies of scale and scope, which represents a reduction in firms’ costs due to an increase in the production scale (Becker-Blease, Kaen, Eterabi & Baumann, 2010) may overcome this liability.
Nevertheless, firms’ size might also reflect disadvantages, such as the principal-agent concept, which occurs when managers make decisions that will ultimately benefit them, such as in terms of reputation and wealth, and not necessarily the firm (Jensen & Meckling, 1976), such as “empire building” actions. Growing “too big” is a concern that firms need to avoid as it represents a reduction in the firms’ value, a misappropriation of the assets and, ultimately, the threat to failure (Jensen & Meckling, 1976). In addition, larger firms may face additional costs, associated with diseconomies of scale, which are translated into a larger need for control layers due to the complexity of the organization process, the lack of understanding and motivation held by its employees and the losses in efficiency that may arise from performance bonuses that are usually attributed by larger firms and that may conduct employees to perform under their most efficient level (Williamson, 1975).
In what new ventures are concerned, these may face liabilities of smallness due to their newly established status. Nevertheless, they may achieve improvements in their profitability through the investment in incentives to their employees, in order to allow for further learning and motivation, which will in turn increase employees’ performance and productivity (Patel et al, 2017). Additionally, it’s possible that new ventures start their activity with an already larger size, which also contributes to the need to understand the effects of size on its profitability levels.
In view of the importance that has been given concerning the influence of profitability on economic growth, and considering the variety of theories that were summarized in the paragraphs above, the present study aims to investigate the impact of size on profitability, exploring if new ventures profitability is positively or negatively impacted as a consequence of increases in their size.
The empirical evidence in terms of the relationship between size and profitability is mixed and inconclusive. So far, the studies focus mainly on large, listed and US firms. Still, there is an imperfect understanding of the relationship between size on firms’ profitability. The present study advances the knowledge of the related literature by investigating a sample of Portuguese non listed new venture firms and makes several
3
contributions. First, to the best of my knowledge, it is the first study that investigates new ventures, recently established and that are non-listed in the stock markets. The dimension, resources, capabilities and challenges of new ventures and/or non-listed firms are quite different from those that are listed in the stock market, for example, the access to capital and means of financing, the challenges of investor protection or the ownership type constitutes a completely different setting. Second, the study covers a very large sample of firms, with several dimensions: from micro firms to large firms. This enables a decent understanding of the Portuguese enterprise sector. Excluding the listed firms is not demeaning for the study in any way as there are only 46 listed firms, and they can hardly give a total picture of the overall Portuguese enterprise sector reality. Third, this study goes beyond the simple analysis of the linear effects of size and also accounts for non-linear effects, as well as additional robustness measures, allowing to further complete and solidify the conclusions obtained.
This paper is organized as follows. Chapter 2 presents the theoretical background regarding the positive and the negative relation between size and profitability. Chapter 3 describes the sample and the variables used in the models’ estimation. Chapter 4 demonstrates the estimation results regarding both the linear and the non-linear estimations, as well as the results of the estimations in which age was used as a moderator effect. Chapter 5 accounts for the robustness estimation, presenting the results obtained by using different measures and scenarios. Chapter 6 presents the discussion of the results obtained in the two prior chapters. Chapter 7 describes the conclusions that were reached. Finally, Chapter 8 presents the limitations of this work as well as recommendations for future research.
4
II. Theoretical background and hypothesis
2.1. Size and profitability
Does size matters for firms and is there the need to be large to be profitable? In particular, what are the effects that size may have on the firms’ profitability? The evidence in terms of the relationship between size and profitability is mixed and depends upon several aspects that I will review now.
2.1.1. Positive relation between size and profitability
Size matters when it comes to the access of resources and funds. The most commonly known factor that one can use to endorse the positive relation between size and profitability is the notion of economies of scale. It can be defined as a reduction in costs through an increase in the level of production, since the fixed costs that a firm faces are dissipated through higher volumes of production, hence increasing its efficiency (Becker-Blease et al., 2010).
Economies of scale can be translated into financial, organizational and technical frameworks. Regarding the first, as firms grow bigger, the interest and the discount rates at which they are subject tend to be more beneficial, since the amounts of products and loans acquired also tend to be higher. As for the second, larger firms have the easiness of being capable to generate specialized tasks and improved mechanisms, allowing a mass production and an increase in the levels of productivity. Additionally, firms that display higher volumes of production benefit from discounts from their suppliers, since they establish a regular and trustworthy relationship accompanied by a large volume of orders. Lastly, in what respects the technical aspect, bigger organizations have the ability to disperse their fixed costs as their size increases and even use more innovative methods of production, developing more R&D and decreasing their overall costs (Pervan & Višić, 2012).
In addition to the economies of scale theory, larger firms also benefit from economies of scope, that is, the saving in costs that arise from the joint production of two different products instead of manufacturing them separately. When firms reach a certain
5
dimension, it may become more advantageous to internalize the production of, per example, a primary good, instead of paying another firm to do so. When the increase in the costs that arise from the joint production of the goods is less than the cost that was originally assumed by buying one of them to another company, then we are in the presence of economies of scope (Marques & Witte, 2011).
Notwithstanding, there are other factors beyond the economies of scale and scope that also corroborate the positive relation between size and profitability. As such, the lack for a certain size may cause firms to face difficulties, known as the liability of smallness. Usually, smaller businesses suffer from weakness in both management and organizational decisions, which translates into rigidity, discrimination, reluctance to transfer responsibilities, inadequate reporting and insufficient view of the market (Kale & Arditi, 1998). Moreover, larger firms have the advantage of enjoying from a higher market power, which allows them to practice superior prices and, thereby, collect higher profits. In addition, the probability for larger firms of having better control over the market fluctuations is higher, thus having more ability to overcome and tone down possible losses (Pervan & Višić, 2012). Furthermore, these firms also benefit from a larger scope of qualified resources, as well as a reduced price relative to the capital they use in their production, since they have a lower risk premium when compared to smaller firms (Yang & Chen, 2009).
Firms’ size is also an advantage from the point of view of entry barriers, since it allows larger firm to benefit from entry constraints that incoming firms will possibly need to face. New entrants may suffer from major fixed costs in order to enter in the business that can go from obtaining and preserving machineries and tools to the construction or rental of buildings, which are fundamental to expand their activity in order to achieve and keep up with the level of production of the market. The higher these fixed costs, the higher the entry barriers that larger firms can benefit from, and as a consequence less competition and more profits will exist (Ramasamy, Ong & Yeung, 2005).
The scarcity of wherewithal and financial support from investors are part of the difficulties that smaller firms face and that may jeopardize their continuity in the business. Firms with lower levels of financial support may find themselves “stuck” in their daily activity, without being able to further invest, whether it is in new products or in improvements in the operational process, therefore finding themselves unable to increase
6
their efficiency and effectiveness and, as a result, their profitability. Additionally, smaller firms lack the ability to protect themselves against market restrictions and usually suffer from managerial weakness (Kale & Arditi, 1998). In this manner, smaller firms have to deal with more constraints in their activity, which confines the amount and quality of tactics that they can endorse in order to remain competitive in terms of effectiveness, which directly translated into lower levels of profitability when compared to firms that are more able to overcome these constraints.
Regarding new ventures, they need to deal with a great number of competitive adversities, since they face high levels of uncertainty, with lower recognition and acceptability. A way in which these firms may overcome the liability of smallness is to employ a higher number of qualified workers, which will contribute to increases in the firms’ efficiency and profitability (Moser, Tumasjan & Welpe, 2017). In this way, by employing a higher number of workers that already have experience in the business and that may bring know-how to the ones that are about to start, the firm will benefit in starting its activity with a higher size, since it will allow for increases in its productivity and efficiency, therefore positively impacting its profitability.
2.1.2. Negative relation between size and profitability
Notwithstanding the arguments held in the previous section, one may ask why firms do not expand to new businesses or why does a great majority of large firms only employ few employees rather than thousands or hundreds of them. If size represents such an advantage why there is not only one big firm that conducts all the production in the market? As seen previously, as the quantity produced increases, the average costs tend do decrease as a consequence of the economies of scale. Nevertheless, at a certain point, these economies of scale are exhausted, and, after a stability period, diseconomies of scale start to surge, leading to increases in costs as a consequence of increases in the output level (Canbäck, Samouel & Price, 2006).
Williamson (1975) describes four categories of diseconomies of scale: Atmospheric, bureaucratic, incentive limits of the employment relation and communication distortion due to bounded rationality. The first is related with the lack of commitment by the employees, since they tend to have difficulties to comprehend the
7
intent of business activities developed by the firm and begin to question the extent to which they are a positive contribution to the larger picture. As for the second, as firms increase in size, senior managers tend to become less accountable to the lower echelons and to the shareholders, beginning to fall under their own interests. This is mostly known as the principal-agent concept. It can be defined as an agreement in which one individual, the principal, attributes some authority to another individual, the agent, to accomplish some service on his behalf. Since it is assumed that both agents seek to maximize their own utility, it is expected that the agent will tend to act accordingly to its own interest and not to the principal’s one (Jensen & Meckling, 1976). In this way, as firms increase in size, they might get under the control of administrators that will potentially pursue objectives that, ultimately, benefit them, leading to a replacement of the firm’s goal from profit maximization to the maximization of their own utility function (Jónsson, 2007). So, the segregation between the company’s ownership and control might generate management decisions that were not made considering the best interest of the firm but, instead, the interest of the managers themselves, with the goal to generate higher income and reputation. (Pervan & Višić, 2012). Regarding the third category presented, Williamson states that the incentives that the firms give to their employees are limited by some factors. As firms pay higher bonus to their employees, senior managers may begin to feel threaten. Additionally, if bonuses are payed considering the employee’ performance it may result in an underperformance, since workers will only have the objective to reach the performance level that grants them the bonus, which may be under their most efficient capacity. Considering the final category, it is possible to state that, as firms increase in size, more bureaucratic and hierarchical layers will be required, since the original number of managers will not be able to conduct a much more compound activity. With this increase in the number of layers, the information flows that exists between them may contain distortions, constraining the capacity of managers to take actions based on reality.
As mentioned above, as firms get larger, they also tend to accumulate more costs, such as, transaction, agency and organizational. Transaction costs can be defined as the costs of preparing, adjusting and controlling the conclusion of the tasks and the behaviour of the organization, also including the costs associated with sells, negotiations and discordances that might generate results that were not planned (You, 1995). Agency costs
8
are related with the disagreements that exist between the stakeholders of the organization, arising from the persecution of self-interest and from asymmetric information, as mentioned in the previous paragraph, and resulting in investments that do not fully compensate the cost of capital that it’s associated to them. In the case of the control costs, they are related with the fact that, the larger the firm, the greater will be the need for skilled workers and for the monitoring of the processes inherent to the coordination of a larger scale of production. This is accompanied by an accumulation of management layers and bureaucracies, which will lead to a point where the firm in no longer capable to react promptly to competitive variations at the same time that is caught in bureaucratic arrangements (Becker-Blease et al. 2010).
Considering the stated above, the increase in costs will overtake the gains that arise from the economies of scale and scope, leading to a decrease in the firms’ profitability.
In what concerns new ventures, even though owning more resources, such as tangible and intangible assets, which also represents the firms’ size, allows the firm to choose from a higher number of reasonable strategies and shield itself from more capable rivals, it does not imply inevitably a higher profitability. Although the survival changes of a new venture are directly related to its resources, they are not directly connected with its effective growth. These resources do not deliver a mechanism for generating competitive benefits due to the fact that they are easy to commercialise, copy or replace. So, even though starting with a larger number of resources, and therefore with a larger size, may increase their survival changes, new ventures profitability may not benefit from it in the future (Chrisman, Bauerschidt & Hofer, 1999).
2.1.3. Evidence and Hypothesis
As shown, the underlying theories regarding the relationship between size and profitability are inconclusive and, to that end, the empirical evidence is also mixed, with some studies providing evidence for positive relations (e.g. Papadogonas, 2007; Ilaboya and Ohiokha, 2016; Pervan and Višić, 2012), others for negative relations (e.g. Kipesha, 2013; Ramasamy et al., 2005) and some for even insignificant ones (e.g. Jónsson, 2007; Becker-Blease et al., 2010).
9
Despite mixed evidence, the proposed hypothesis is that there is a positive relation between size and profitability.
10
III. Econometric Data and Methodology
3.1. Sample
The data was retrieved from the IES (Informação Empresarial Simplificada (IES)) form, which contains both firms’ financial and performance information, obtained from the INFORMA D&B database. This document is certified by a public accountant and is a mandatory fulfilment for all Portuguese firms on an annual basis.
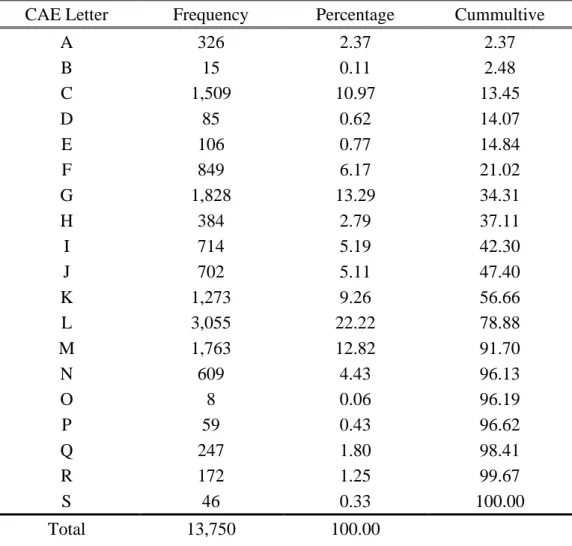
The data available covers the firms that have started their activity between 2010 and 2018, covering 19 industries (CAE [Código das Atividades Empresariais] letter), which allows the coverage of the activity of a wide range of new venture firms from multiple sectors. Initially, there were identified 32,718 firms. In order to eliminate any inconsistencies that might arise, observations whose values were errors, such as negative values for assets or cash were eliminated.
Moreover, and according to Patel, Pearce and Guedes (2019) it was eliminated firms that were acquired, reported no activity (firms that had no sales) and that have a suspended activity, with the final sample only accounting for firms with an active status. Furthermore, firms with zero employees were also withdrawn from this study, once they could cause an inappropriate insight into the firms’ size and performance (Pervan & Višić, 2012). After these adjustments, the finals sample of this study consists of 13,750 observations, with a total of 3,818 firms being under assessment.
Amongst the total number of observations, the industry with the higher number of observations is the real estate industry (CAE letter L) representing 22% of the total sample, followed by the wholesale and retail trade, repair of motor vehicles and motorcycles industry (CAE letter G), accounting for 13% of the sample, and by the professional, scientific and technical activities (CAE letter M), also accounting for 13% of the total sample. The industry with the lowest share is the public administration and defence, compulsory social security (CAE letter O), with 0.06% of the total sample. The detailed concentration of firms per industry is further presented in the appendix section.
11 3.2. Variables description
Table I presents the description of the variables used in this study.
Table I – Operationalization of the variables of the study
Variable Operationalization
Return on Assets (profitability)
Net Income Total Assets
Size ln(Number of employees)
Age ln(measure in months between the day the firm was created
and the last day of 2018)
Fixed Assets Ratio Fixed Assets
Total Assets
Debt Ratio Total Debt
Total Assets
Financial Leverage Ratio Total Debt
Total Equity
Asset Turnover Ratio Sales
Total Assets Status
Dummy variable that equals 1 if the firm was active until 2018 and equals 0 if the firm is permanent or temporarily inactive.
Year dummies Reference year = 2010
Industrie dummies Reference industry = CAE letter A (Agriculture, forestry
and fishing)
The Return on Assets (ROA) is the profitability indicator, measuring the level of a firm’s profitability. It is calculated as the ratio between the net income and total assets, allowing to obtain a measure of how the firm is able to create profits as a consequence of the efficient use of resources and of correct management (Burja, 2011). A higher ROA ratio implies that the firm is more effective in the generation of net income through its assets, allowing the firm to achieve a higher rate of return that will enhance the company’s attractiveness towards its investors. Furthermore, this will lead to a higher capacity of the firm to generate benefits for its investors, increasing the investors demand even further (Saragih, 2018).
12
One of the advantages of ROA is that it’s less sensitive to the leverage than the Return on Equity (ROE), which is calculated by comparing the firms’ return to the investment that it has made over the years (Berk & DeMarzo, 2014). If a firms’ financial statements contain a negative equity and also a negative net income, then the ROE would assume a positive value, therefore indicating that the firm was performing satisfactorily. However, negative net income and equity values reveal that the firm is underperforming, thus, not being profitable. In this situation, the interpretation suggested by merely observing the ROE values will not reflect the real circumstances of the firm.
Regarding firms’ size it will be measured by the natural logarithm of the number of employees.
The study uses several control variables. Age is the natural logarithm of the difference, in months, between the final day of the most recent year with available information (2018) and the day on which the firms was created.
The Fixed Assets ratio (FAR) is the ratio of the fixed assets to total assets. The ratio measures the proportion of assets that the firm holds on a long-term basis in relation to its activities, detailing the amount of capital allocated to technic and productive infrastructures. A high fixed assets ratio denotes a strong investment state, notwithstanding, if it reaches values up to a higher level, it could provoke restrictions on the capacity of the firm to invest in further activities (Burja, 2011)
The Debt Ratio (DR) is defined as the ratio of the total debt to total assets and it indicates the level at which a firm’s total assets are financed through debt, which usually is reflected into loans. In the present paper, the Debt Ratio is computed as a measure of the amount of assets in relation to the total liabilities of each firm. An increasing indebtedness grants the firms a higher sum of financing resources, however it is most likely to also compromise firms’ independence and creditworthiness, increasing the inherent risk and, thus, the risk that is considered by creditors that might potentially lend funds to the firm (Burja, 2011).
The Financial Leverage Ratio (FLR) is calculated as the ratio between total debt and total equity. Both debt and equity can be described as the two main firms’ funding sources, with the ratio providing a notion of how much capital is financed through debt, in contrast to equity. The higher the ratio, the greater the share of debt in the firms’
13
financing structure. Obtaining a sound and efficient financing structure can increase the prospect of financial developments in the long run for the firm’s investors (Rayan, 2008).
The Asset Turnover Ratio (ATR) is the ratio between sales and the total assets of a firm. It accounts for the firms’ capacity to engender sales, in an efficient way, from its assets (Berk & DeMarzo, 2014). A variation in the asset turnover implies an alteration in the efficiency of the firms’ assets and should, as a consequence, be used to forecast possible changes in the profitability levels (Fairfield & Yohn, 2001).
Lastly, there were also considered year and industry dummies in order to account for the effects of different years and different industries in the final results.
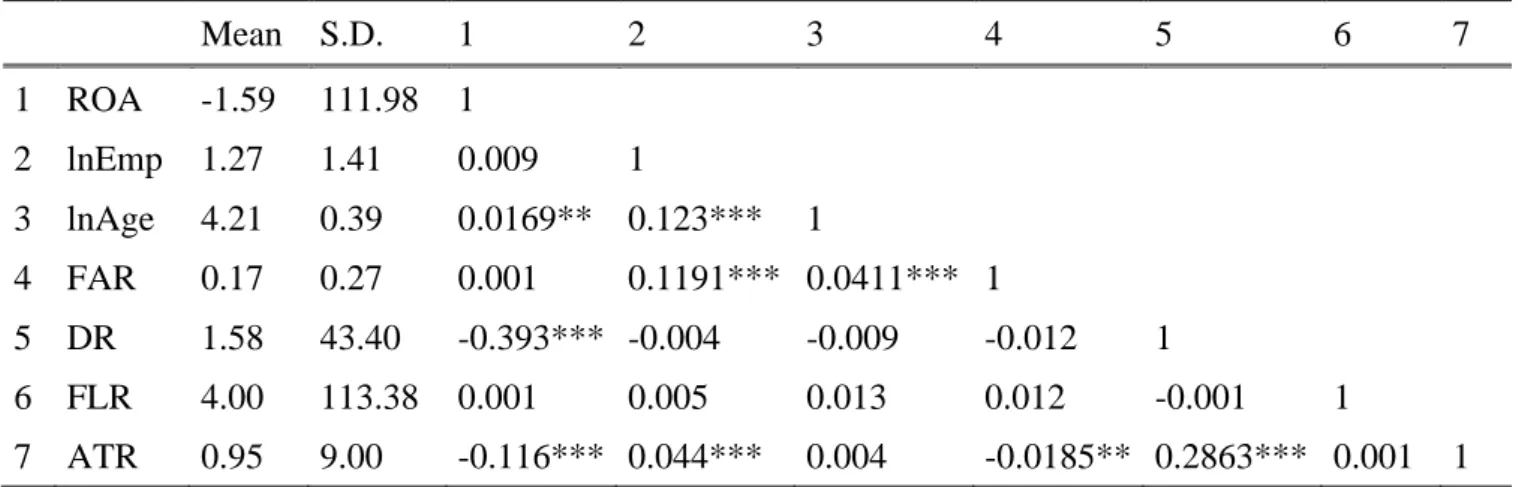
Table II presents the summary statistics and the correlations.
Table II - Sample description. Mean, SD, and pairwise correlations
Notes: N=13,750 observations followed between 2010 and 2018
* ρ < .10.; ** ρ < .05.; *** ρ < .01. Mean S.D. 1 2 3 4 5 6 7 1 ROA -1.59 111.98 1 2 lnEmp 1.27 1.41 0.009 1 3 lnAge 4.21 0.39 0.0169** 0.123*** 1 4 FAR 0.17 0.27 0.001 0.1191*** 0.0411*** 1 5 DR 1.58 43.40 -0.393*** -0.004 -0.009 -0.012 1 6 FLR 4.00 113.38 0.001 0.005 0.013 0.012 -0.001 1 7 ATR 0.95 9.00 -0.116*** 0.044*** 0.004 -0.0185** 0.2863*** 0.001 1
14
IV. Estimation Results
The proposed hypotheses were tested using the models presented in Equations (1) to (3). (1) 𝑅𝑂𝐴𝑖𝑡 = 𝛽0 𝑖,𝑡+ 𝛽1𝑙𝑛(𝐸𝑚𝑝)𝑖,𝑡 + 𝜀𝑟𝑒𝑠𝑖𝑑𝑢𝑎𝑙1,𝑖𝑡 (2) 𝑅𝑂𝐴𝑖𝑡 = 𝛽0+ 𝛽1𝑙𝑛(𝐸𝑚𝑝)𝑖𝑡+ 𝛽𝐶∑ 𝐶𝑜𝑛𝑡𝑟𝑜𝑙𝑠𝐶 𝐶 𝑖=0 (𝑡) + 𝜀𝑟𝑒𝑠𝑖𝑑𝑢𝑎𝑙1,𝑖𝑡 (3) 𝑅𝑂𝐴𝑖𝑡 = 𝛽0+ 𝛽1𝑙𝑛(𝐸𝑚𝑝)𝑖𝑡+ 𝛽𝐶∑𝐶 𝐶𝑜𝑛𝑡𝑟𝑜𝑙𝑠𝑐(𝑡) + 𝑖=0 𝛽𝐼𝑛𝑑∑𝐼𝑛𝑑𝑖=0𝐼𝑛𝑑𝑢𝑠𝑡𝑟𝑦𝑖𝑛𝑑+ 𝛽𝑦∑𝑦𝑖=0𝑌𝑒𝑎𝑟𝑖𝑛𝑑+ 𝜀𝑟𝑒𝑠𝑖𝑑𝑢𝑎𝑙1,𝑖𝑡#
The models were estimated in the STATA software, using the Ordinary Least Square (OLS). In order to test for possible multicollinearity of the data, the Variance Inflation Factor (VIF) was analysed, presenting evidence that there are no multicollinearity problems in the variables of the model.
Additionally, in order to deal with possible heteroscedasticity, the previous models were estimated using the robust option for the standard errors.
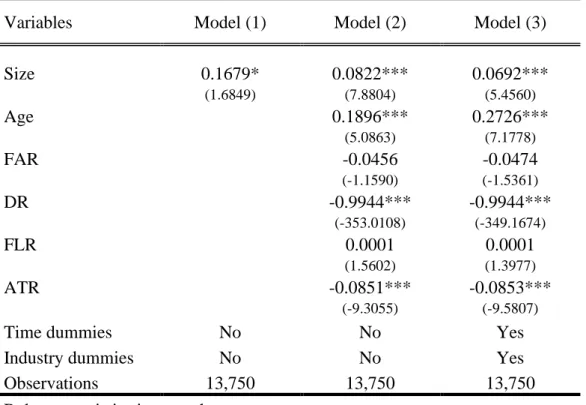
4.1. Linear Effects
Table III presents the regression results. The control variables were included when estimating both model 2 and model 3 in order to allow for a deeper comprehension of the triggers behind profitability variations that may not be entirely explained trough shifts in firms’ size. Furthermore, in model 3 there were additionally included year and industry dummies. The results are consistent for the three models.
According to the table, Size is positive and statistically significant in all three models, therefore being a highly substantial driver for the profitability of firms. Hence, the hypothesis established is validated. Therefore, the number of employees has a positive linear effect on the firms’ profitability.
This result is in line with the arguments of the liability of smallness, which state that larger firms are more likely to achieve higher levels of profitability. This occurs trough the scale and scope economies and trough the sound market position and stability
15
that benefits larger firms (Pervan & Višić, 2012). So, considering the sample of new venture firms under study, the results suggest that it is more beneficial for these firms to start with a larger size, in order to benefit from higher levels of profitability.
Table III - Linear OLS regressions results
Variables Model (1) Model (2) Model (3)
Size 0.1679* 0.0822*** 0.0692*** (1.6849) (7.8804) (5.4560) Age 0.1896*** 0.2726*** (5.0863) (7.1778) FAR -0.0456 -0.0474 (-1.1590) (-1.5361) DR -0.9944*** -0.9944*** (-353.0108) (-349.1674) FLR 0.0001 0.0001 (1.5602) (1.3977) ATR -0.0851*** -0.0853*** (-9.3055) (-9.5807)
Time dummies No No Yes
Industry dummies No No Yes
Observations 13,750 13,750 13,750
Robust t-statistics in parentheses *** p<0.01, ** p<0.05, * p<0.1
Regarding the coefficients obtained for the control variables, it’s possible to observe, both in models 2 and 3, that age has a positive and statistically significant impact of the profitability of new ventures. This positive effect can be justified by considering the existence of the liabilities of newness, reflecting the greater likelihood of failure that is faced by younger firms, the higher need to establish a sound reputation and trustworthy relationships with other agents that is faced by newly established firms, and the learning by doing that occurs as firms age (Stinchcombe, 1965).
Considering the Fixed Assets Ratio and the Financial Leverage Ratio, both proved to have a low level of statistical significance, with the two holding small coefficients, suggesting that a variation in the investment or in the funding structure of a firm will not impact significantly the profitability, when their effect is considered among the remaining
16
variables. These effects hold for both model 2 and 3, with no major variations occurring between the two.
The Debt and the Asset Turnover ratio were verified to be statistical significance. Thus, if a firm opts to finance its assets through debt it will imply higher losses in profitability. This outcome is in line with the stated previously, possibly representing the lack of trust and the increase in the risk that new investors will consider when evaluation whether or not to invest in the firm.
The Asset Turnover Ratio is negative, thus suggesting that there is a negative relation with profitability. Therefore, even when there is an increase in the efficient generation of sales through assets, the firm will still have lower profitability levels regarding its total assets, not exploiting them in such a way that it results on a higher net income. This might occur if a firm charges a lower price for its good and services, therefore obtaining an elevated number of sales, but at a lower margin. However, since there is a higher quantity of sales, despite the fact that they are obtained at a lower value, the firms’ turnover will be optimized. So, notwithstanding the fact that this strategy leads to an increase in the efficient generation of sales through assets, it will also imply a lower margin, resulting in a lower net income and, therefore, in a lower ROA (Fairfield & Yohn, 2001).
4.2. Non-Linear Effects
Table IV shows the results of the models, now accounting for non-linear effects According to the table, size maintains its statistical significance, at the same time that it still holds its positive coefficient. In this way, the liability of smallness theory is once again verified. There is no evidence of non-linear effects, as the squared value of size is not significant.
Although not being statistically significant, the non-linear term coefficient is negative. In this way, additional increases in the employees’ number could only produce increases in the profitability levels up until some point, from which the effects start to be negative. So, even though new ventures may benefit from a higher profitability if starting their activity with a higher number of employees, they need to account for the negative effect that may arise as the number of employees increase as these firms become further
17
developed and integrated in the market. This inverted u-shape evolution can be explained by the constrains that firms start to experience when reaching a certain size level, such as the principal-agent problem and the diseconomies of scale (Jensen & Meckling, 1976).
Table IV - Non-linear OLS regressions results
Variables Model (1) Model (2)
Size 0.1078*** 0.0805** (3.6456) (2.2142) Squared Size -0.0061 -0.0026 (-1.0392) (-0.3788) Age 0.1876*** 0.2714*** (4.9024) (6.9099) FAR -0.0480 -0.0483 (-1.2168) (-1.5703) DR -0.9944*** -0.9944*** (-352.6362) (-349.1103) FLR 0.0001 0.0001 (1.5098) (1.3843) ATR -0.0851*** -0.0853*** (-9.3240) (-9.5827)
Time dummies No Yes
Industry dummies No Yes
Observations 13,750 13,750
Robust t-statistics in parentheses *** p<0.01, ** p<0.05, * p<0.1
In what concerns the control variables, the results are in line with the obtained in the previously, in both models presented. Age maintained its positive and significant coefficient, proving once again that the liability of newness is consistent in the new venture sample under study. Regarding the remaining control variables, both the Debt Ratio and the Asset Turnover Ratio held its negative and significant coefficients, with values very similar to the ones observed in the first section of this chapter.
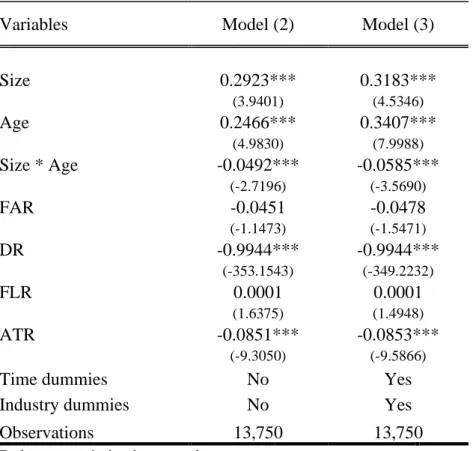
18 4.3. Age as a moderator effect
Further than explaining the linear and the non-linear effects regarding the effect of size on profitability, one may additionally considerer important to understand the evolution of models 2 and 3 when including age as a moderator. The estimation results of the models presented in the previous chapter under this assumption are now presented in Table V.
Table V - Age moderator effect OLS regressions results
Variables Model (2) Model (3)
Size 0.2923*** 0.3183*** (3.9401) (4.5346) Age 0.2466*** 0.3407*** (4.9830) (7.9988) Size * Age -0.0492*** -0.0585*** (-2.7196) (-3.5690) FAR -0.0451 -0.0478 (-1.1473) (-1.5471) DR -0.9944*** -0.9944*** (-353.1543) (-349.2232) FLR 0.0001 0.0001 (1.6375) (1.4948) ATR -0.0851*** -0.0853*** (-9.3050) (-9.5866)
Time dummies No Yes
Industry dummies No Yes
Observations 13,750 13,750
Robust t-statistics in parentheses *** p<0.01, ** p<0.05, * p<0.1
Size is still positive and significant. Nevertheless, its coefficient has become significantly larger than the previous, suggesting that the inclusion of the moderator effect of age results in a larger impact of increases in the number of employees on the firms’ profitability.
When considering the moderator effect of age, it is possible to observe that additional increases in the number of employees will produce negative effects when firms
19
reach a certain age level, since the coefficient presented is negative, having a strong statistical significance. This result suggests that, after a certain amount of time in the business, firms may start to face diseconomies of scale, which may even happen at an earlier stage of their life, since this study only focuses on new venture firms.
This situation may occur due to the liability of obsolescence and senescence that firms start to face as they age. The liability of obsolescence is characterized by the lack of ability of firms to adapt their internal organization procedures to the developments in the environment in which they operate. This mismatch tends to increase overtime, especially if the technological progresses involve more advanced capital, knowledge and skills that those retained by the firm (Sørensen & Stuart, 1999). The liability of senescence is related to the internal inefficiency as a consequence of the aging process. If the structure of a firm is influenced by inertial forces, then it will become trapped in the tactics and procedures implemented in the beginning. As firms accumulate persistent characteristics, they became more likely to suffer from impregnated internal frictions, obstructing them to increase efficiency in collective actions, also leading to a decline in competence and performance (Hannan, Carroll, Dobrev & Han, 1998).
In this way, older firms will face challenges related to the difficulties to adapt to the external environment at the same time that they deal with internal inertia, tending to accumulate rules, procedures and structures, which might generate additional costs, further reducing firms’ profitability (Canbäck et al, 2006).
By adding an additional employee to the firms’ structure, with similar capacities as the ones already existing in the firms’ labour force, the level of costs associated with this decision may overshadow the benefits arising from the increase in the output, as the inertial forces that the firm is facing will not allow for an increase in the efficient generation of profits. So, even though newly established firms experience positive effects in their profitability through increases in size, they will reach an age in which these positive effects will shift. If firms do not develop technical progress and more efficient procedures and rules, further increases in firms’ employees will only contribute to increases in the firms’ complexity, by adding an additional layer in an already complex structure, constraining the increases in the profitability that once occurred.
Regarding the control variables, it is possible to observe that, once again, the results obtained are similar to the previous ones.
20
V. Robustness estimations
To perform a deeper analysis regarding the effect of size on profitability, one must also seek to understand whether the results obtained initially will remain similar when choosing different ways to measure size and profitability. Thus, the models were estimated once again, using alternative measures for size, now proxied by total assets and sales. Regarding profitability, the alternative measure is the Return on Sales.
Lastly, it was considered that the distinction between manufacturing and non-manufacturing firms may also give rise to disturbances in the results obtained previously.
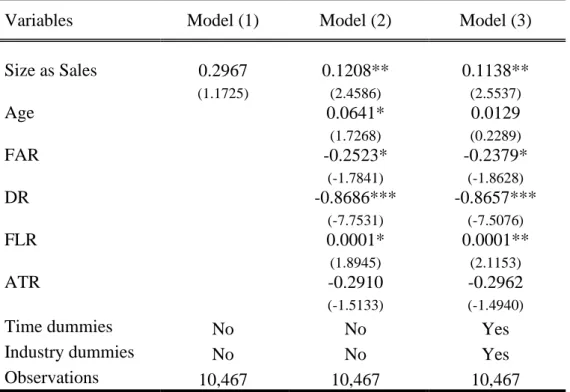
5.1. Sales
Sales is an alternative way to proxy for firm size. According, to the technological theories of the firms, which are more focused on the economies of scale analysis and on the way that they are obtained from capital inputs, the sales level would be more appropriate to measure the effect of size (Becker-Blease et al. 2010).
The results are presented in Table VI. Regarding the effect of size on profitability, it is possible to observe that the results are in line with the previously obtained, although some small differences may be pointed out. The coefficient obtained in model 1 has lost its statistical significance, suggesting that the isolated effect of sales does not have as much impact on profitability as the employees’ level does. In what concerns models 2 and 3, the size coefficient remained statistically significant, registering positive coefficients, which revealed to be higher than the ones obtained initially.
Thus, the results suggest that, even though the level of sales alone does not produce a significant impact on profitability, when considering its effect alongside the remaining control variables, its impact on profitability reveals to be higher than the one obtained when considering the employees level as a variable. So, an increase in the level of sales tends to produce higher levels of profitability than increases in the level of employees, which is in line with the economies of scale argument presented earlier on this paper, since a higher level of production, that usually is allocated to a higher level of sales, will result in a higher level of profitability.
21
Table VI - Linear OLS regressions results with Sales
Regarding the remaining control variables, the results are in line with the previous ones.
5.2. Assets
The level of assets held by the firm can also be used to measure the impact of size on profitability, from a perspective of technological theories of the firm, which are more focused on the economies of scale perspective (Becker-Blease et al. 2010).
In this way, models 1, 2 and 3 were once again estimated but now considering the level of assets as the variables that accounts for the effect of size on profitability. The results obtained are presented in table VII.
Table VII shows that the effect of size on profitability is statistically significant, although only for model 1. In this way, and considering models 2 and 3, there is limited evidence that increases in the level of assets held by the firm will produce increases in profitability. Notwithstanding, when considered alone, a higher level of assets will
Variables Model (1) Model (2) Model (3)
Size as Sales 0.2967 0.1208** 0.1138** (1.1725) (2.4586) (2.5537) Age 0.0641* 0.0129 (1.7268) (0.2289) FAR -0.2523* -0.2379* (-1.7841) (-1.8628) DR -0.8686*** -0.8657*** (-7.7531) (-7.5076) FLR 0.0001* 0.0001** (1.8945) (2.1153) ATR -0.2910 -0.2962 (-1.5133) (-1.4940)
Time dummies No No Yes
Industry dummies No No Yes
Observations 10,467 10,467 10,467
Robust t-statistics in parentheses *** p<0.01, ** p<0.05, * p<0.1
22
produce increases in profitability, which suggests that the firm is exploiting their assets in such an efficient way that it increases the also efficient generation of profits.
Table VII - Linear OLS regressions results with Assets
Variables Model (1) Model (2) Model (3)
Size as Assets 0.8090* 0.0321 0.0206 (1.8089) (1.5155) (0.7906) Age 0.1818*** 0.2692*** (4.6595) (6.2644) FAR 0.0202 0.0086 (0.6795) (0.2647) DR -0.9936*** -0.9936*** (-286.9443) (-287.9041) FLR 0.0000 0.0000 (1.5450) (1.3372) ATR 0.0295 0.0244 (0.9120) (0.7713)
Time dummies No No Yes
Industry dummies No No Yes
Observations 13,748 13,748 13,748
Robust t-statistics in parentheses *** p<0.01, ** p<0.05, * p<0.1
This is in line with the coefficient obtained for the Asset Turnover ratio, being also positive, which implies that the firm is being able to generate sales from its assets in such an efficient way that it is simultaneously able to produce a higher level of net income and therefore, ROA (Fairfield & Yohn, 2001).
The results of the remaining control variables are in line with the previous results.
5.3. Return on Sales
The Return on Sales ratio can be described as a measure of how efficiently a firm is able to convert sales into profit gains. It is calculated by dividing the earnings before income and taxes (EBIT) by the total amount of sales and services. EBIT is used in the obtention of ROS, since it allows to remove the consequence from the existence of several
23
capital structures and, perchance, from different taxation levels (Myšková & Hájek, 2017).
Despite representing a profitability measure, it is important to ponder that, though a higher ROS is considered to be positive, it can be obtained in such a way that does not imply necessarily a strict benefit for the firm. This might occur if a firm charges a higher price for its good and services, therefore obtaining an elevated return from each sale that is made. However, since there are fewer sales but with a higher value, the amount of assets does not benefit from this decision, with the firms’ turnover being restricted (Brigham & Houston, 2009).
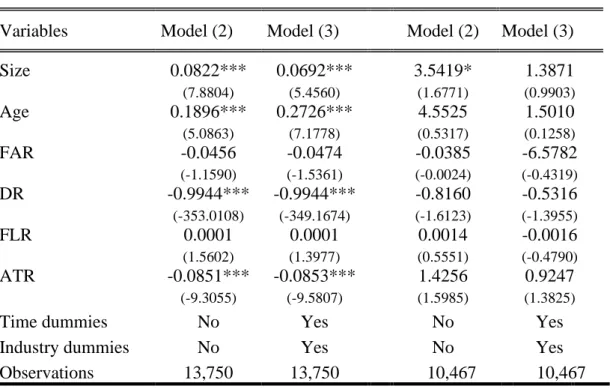
Table VIII - Comparison between ROA and ROS regression results
ROA Estimation ROS Estimation
Variables Model (2) Model (3) Model (2) Model (3)
Size 0.0822*** 0.0692*** 3.5419* 1.3871 (7.8804) (5.4560) (1.6771) (0.9903) Age 0.1896*** 0.2726*** 4.5525 1.5010 (5.0863) (7.1778) (0.5317) (0.1258) FAR -0.0456 -0.0474 -0.0385 -6.5782 (-1.1590) (-1.5361) (-0.0024) (-0.4319) DR -0.9944*** -0.9944*** -0.8160 -0.5316 (-353.0108) (-349.1674) (-1.6123) (-1.3955) FLR 0.0001 0.0001 0.0014 -0.0016 (1.5602) (1.3977) (0.5551) (-0.4790) ATR -0.0851*** -0.0853*** 1.4256 0.9247 (-9.3055) (-9.5807) (1.5985) (1.3825)
Time dummies No Yes No Yes
Industry dummies No Yes No Yes
Observations 13,750 13,750 10,467 10,467
Robust t-statistics in parentheses *** p<0.01, ** p<0.05, * p<0.1
Table VIII presents the results considering the ROS. As it is possible to observe, the models in which the profitability was measured trough the Return on Sales present a lower number of observations than the original models. This occurred since some firms registered null values for sales and services, therefore leading to an error when computing the Return on Sales in those specific observations. As a consequence of this error, the software estimated the models by not considering these observations.
24
According to the table and regarding model 2, one can observe that the size coefficient has partially lost its significance. Nevertheless, the coefficient grew significantly, implying that increases in the firms’ employees will produce a stronger effect in profitability when considering ROS instead of the ROA. Therefore, firms with a higher volume of employees will be more capable of efficiently turning sales into profits. As for model 3, the size variable lost its statistical significance, nevertheless maintaining the positive coefficient.
In what concerns age, for both models 2 and 3, the respective coefficient has lost its statistical significance, therefore implying that age no longer has a meaningful impact when analysing a firms’ profitability through ROS. So, firms can obtain both a lower or a higher profitability level, independently of their newness or oldness status. In this way, it is more likely for fluctuations in profitability to be more correlated with changes in size and in other factors.
In what respects the control variables, the results are aligned with the previous ones, with some exceptions. The Fixed Assets Ratio coefficient observed in model 3 registered a high increase, which, even though not being statistically significant, suggests that if firms increase the capital allocated to technic and productive infrastructures, it will cause a reduction in the profitability levels (Burja, 2011).
The Debt Ratio lost its statistical significance. Since the ROS only considers the total volume of sales and not of assets, as the ROA does, this result was already expected.
The Asset Turnover Ratio lost its statistical significance, however registering a positive coefficient both in model 2 and in model 3. In this way, firms’ will be able to increase both its turnover ratio and its profitability, by generating sales that contribute positively to the net income at the same time that an efficient turnover is granted (Berk & DeMarzo, 2014).
5.4. Manufacturing and non-manufacturing firms
The distinction between manufacturing and non-manufacturing firms also provides an additional degree of understanding regarding the effects size on profitability. In this way, the previously models, were estimated accounting for the distinction between manufacturing and non-manufacturing firms, separately.
25
According to Scallan (2003), manufacturing firms are those that produce its products from raw resources by using multiple procedures, equipment, processes and manpower, following a previously designed and detailed plan. This activity includes the production of consumer, intermediate and investment goods. On the other hand, non-manufacturing firms focuses on activities that do not imply a production of a physical product, such as health, construction and financial activities.
To distinguish between manufacturing and non-manufacturing firms it was considered the NACE statistical classification, which, as defined by Eurostat, is used to designate the multiple statistical classifications of economic activities developed since 1970 in the European Union. Nevertheless, each country may submit a direct equivalent to the NACE classification, which, in the Portuguese scenario, is denominated CAE (Classificação Portuguesa das Atividades Económicas). According to the CAE classification, the manufacturing firms are described with the C letter, whereas the non-manufacturing are distributed over the remaining classifications. In the sample considered in this study, the manufacturing firms account for approximately 11% of the total number of observations considered. The concentration of firms in the remaining industry may be observed in the appendix.
Table IX shows the results for the manufacturing and non-manufacturing split. Once more, the coefficient of size is positive and statistically significant, regardless of the economic activity of the firms. Thus, the results do not vary with the split, suggesting that the type of activity does not play a pivotal role in terms of profitability.
Nevertheless, the coefficient proofed to be larger for non-manufacturing firms, which may occur since manufacturing firms are usually characterized by having routinize processes that are normally performed by machinery, allowing the production process to be slightly independent from human resources. In the case of non-manufacturing firms, their activity is more related with services, that are usually personalized and adapted to each situation, being more developed by the firms’ employees rather than by the existing machines.
In what respects the effect of age on profitability, it is only statistically significant when considering non-manufacturing firms. This might happen since the positive effects that arise from the ageing process, such as the learning by doing, do not reveal to be significant for firms that have routinized production processes, which is likely to occur in
26
the manufacturing industry, where the production is usually characterized by having a larger scale of production, with similar machines and employees’ ability.
Table IX - Comparison between estimation results for manufacturing and non-manufacturing firms
Manufacturing Non-Manufacturing
Variables Model (2) Model (3) Model (2) Model (3)
Size 0.0363*** 0.0363*** 0.0873*** 0.0731*** (4.8972) (4.8972) (7.1262) (4.9340) Age 0.0439 0.0440 0.1985*** 0.2826*** (1.4434) (1.4434) (4.8615) (6.8381) FAR 0.2582*** 0.2582*** -0.0492 -0.0660* (4.6182) (4.6182) (-1.1724) (-1.9322) DR -0.4828*** -0.4828*** -0.9944*** -0.9944*** (-2.8475) (-2.8475) (-352.0935) (-348.8044) FLR 0.0001 0.0002 0.0001 0.0000 (1.4312) (1.4312) (1.3434) (1.1411) ATR 0.0830*** 0.0830*** -0.0854*** -0.0855***
Time dummies No Yes No Yes
Industry dummies No Yes No Yes
Observations 1,509 1,510 12,241 12,241
Robust t-statistics in parentheses
*** p<0.01, ** p<0.05, * p<0.1
Regarding the Asset Turnover ratio, it revealed to be statistically significant both for manufacturing and non-manufacturing firms, although displaying opposite effects in the two groups. When considering the manufacturing activity, the Asset Turnover ratio displayed a positive coefficient, revealing that firms are generating sales from its assets in such an efficient way that increases their net income and, as a consequence, their profitability levels. In what concerns the non-manufacturing firms, the opposite happens, with the coefficient displaying a negative value, which implies that the firm may be generating a high turnover of assets, by an increase in its sales, but is doing so at the expense of a lower margin, which will in turn result in a lower ROA (Fairfield & Yohn, 2001).
27
VI. Discussion of results
The results obtained are in line with those of Papadogonas (2007), Ilaboya & Ohiokha (2016) and Pervan and Višić (2012), suggesting the existence of liability of smallness. Thus, as firms grow, they will become stronger competitors, benefiting from an increasing market power, which allows them to collect a higher market share and practice higher prices, therefore, benefiting from a higher amount of profits (Pervan & Višić, 2012). Furthermore, it is also expected that, as firms increase their size, they will also benefit from economies of scale and scope, gaining from the efficiency that arises as firms become more expert in the decision-making process. In this way, firms develop their production capacity in such an efficient way that allows them to sell more quantities at a higher price at the same time that they benefit from a reduction in their costs.
Regarding the approach in which age was used as a moderator factor, the conclusions obtained suggest that firms will start to face diseconomies of scale after a certain amount of years in the business. Considering that this study focused on new venture firms, this may even occur in the earlier years of their activity. This outcome is supported by the liability of obsolescence and senescence arguments, that state that, as firms age, they will have difficulties in adapting to the external environment and will face internal inertia forces. This will eventually generate additional costs, further reducing firms’ profitability. So, even though new venture firms will benefit from starting their activity with more employees, they will reach a point in their age in which additional increases in the employees’ level will not produce benefits towards the firms’ profitability.
28
VII. Conclusion
This thesis provides evidence of the liability of smallness for new ventures, established between 2010 and 2018 and followed until 2018.
Although a majority of studies provide evidence regarding why some firms are more profitable than others, analysing a wide set of variables of firm success continues to be of great interest. Differently from the already existent studies with a similar research question, this thesis encompassed two profitability measures and three distinct size indicators, covering a wide range of Portuguese non-listed new venture firms during an eight-year period. Furthermore, this study also covers an additional set of other variables, namely age, the fixed assets ratio, the debt ratio, the financial leverage ratio and the asset turnover ratio, which allowed for a more comprehensive analysis regarding profitability variations.
Although the non-linear estimation revealed that there was no evidence of the existence of non-linear effects of size on the firms’ profitability, the results show that size has a positive and significant impact on new ventures’ profitability, when using both the linear estimation and the estimation with age as a moderator. This conclusion adds to the previous literature on the liability of smallness, that is, revealing that smaller firms face a higher number of hazards which may threaten their survival. On the other hand, this result also suggests the presence of scale and scope economies, translating into a reduction in the firms’ costs due to a higher production scale. In this way, the results obtained suggest that newly established firms should begin their activity with a higher number of employees.
By starting off with a higher employee’s number, new ventures may invest in the development of their performance, by stimulating learning and motivation and, in this way, increasing their survival chances. Even though firms may need to increase their costs due to additional staff expenses, they will also benefit from a higher attractiveness towards employees, being able to “hold” them and therefore reducing employee turnover. For new ventures, this reduction in the employee turnover allows a higher initial learning and a preservation of the firms’ particular know-how, at the same time that it ensures the continuity of the service. Additionally, a higher salary may incentive the employees to be more focused, striving to create strong relationships with the customers and being more oriented towards their needs and demands. This strong and positive relationships with the
29
customers lead new venture firms to distinguish themselves from their competitors, benefiting from customer’ loyalty and allowing to create a sound reputation from the beginning (Patel et al, 2017).
Nevertheless, when considering the results obtained by using age as a moderator factor, it’s possible to state that, from a certain age, increases in the firms’ size will not produce positive profitability shifts. So, despite the benefits that new ventures will obtain by beginning their activity with a higher share of employees, the additional costs that are associated with further increases in staff, either by increases in the employees’ number of by additional expenses, will cease to provide increases in profitability from a certain age. In this way, there is evidence of the presence of diseconomies of scale, supporting the liability of obsolescence and senescence arguments.
By conduction a robustness analysis, through the use of the level of sales and assets as measures of size and of the return of sales as a measure of profitability, it was possible to conclude that none of them revealed sounder results that the ones obtained initially, thus allowing to conclude with more certainty that the number of employees and the return on assets were robust measurements for size and profitability. In addition, the analysis of the results obtained through the separation between manufacturing and non-manufacturing firms did not reveal any major differences between industries, thus suggesting that the results obtained initially are not biased towards a specific industry and, therefore, also reassuring the robustness of the conclusion reached initially.
30
VIII. Limitations and future research
As in any study, this thesis has some limitations. First, it only allowed for the study of new ventures established between 2010 and 2018. The availability of data from a higher scope of time would lead to a deeper understanding regarding the evolution of firms’ profitability. Additionally, it would have been possible to study both the liability of smallness and newness arguments. Even though there is evidence regarding the presence of the latter for new venture firms, it would have been of great interest to analyse a larger scope of years and understand if increases in age could indeed produce positive effects on profitability.
Second, an additional limitation of this thesis is that it is only focused on the Portuguese reality, not considering additional countries in the analysis. The growth pattern of firms may vary accordingly to the economic reality that is faced by specific countries, which could also lead to profitability shifts independently from whether or not the firm size has varied. Moreover, this study does not account for market imperfections, such as the existence of monopolies or oligopolies, that may constraint newly established firms to success and to prosper, or even stop them from existing at all. These monopolies and oligopolies will benefit from an extremely large profitability, mainly due to their market power and not necessarily to their size variations.
In order to account for both these situations, future studies may include a cross-country analysis, as well as an additional variable that accounts for the existence of monopolies and oligopolies in the market, allowing to separate markets that are “perfect” from markets in which imperfections exist.
Lastly, the study of the relation between the liability of smallness, newness and volatility may be of great interest for the analysis of new venture success and profitability. The liability of volatility may increase the exit probability of new venture firms, due to the difficulty to plan forward, to the increase in the risk premium associated with uncertainty and to the costs that are needed to constantly adapt to the changes produced by volatility (Lundmark, Coad, Frankish & Storey, 2019). In this way, considering all of these liabilities in the same study and analysing the differences and the similarities between them would allow to obtain a much more detailed perspective on the reasons behind profitability shifts and new ventures success.
31
References
Becker-Blease, J., Kaen, F., Eterabi, A. and Baumann, H. (2010). Employees, firm size and profitability in U.S. manufacturing industries. Investment Management and Financial
Innovations 7 (2), 119-132.
Berk, J. and DeMarzo, P. (2014). Corporate Finance, 3rd edn. Boston: Pearson.
Brigham, E. and Houston, J. (2009). Fundamentals of Financial Management, 12th edn.
Mason: South-Western.
Burja, C. (2011). Factors influencing the companies’ profitability. Annales Universitatis
Apulensis Series Oeconomica 13 (2), 215-224.
Canbäck, S., Samouel, P. and Price, D. (2006). Do diseconomies of scale impact firm size and performance? A theoretical and empirical overview. Journal of Managerial
Economics 4 (1), 27-70.
Chrisman, J., Bauerschmidt, A. and Hofer, C. (1998). The Determinants of New Venture Performance: An Extended Model. Entrepreneurship Theory and Practice 23 (1), 5-29.
Eurostat (2008). NACE Rev. 2: Statistical classification of economic activities in the
European Community [Online]. Available from:
https://ec.europa.eu/eurostat/documents/3859598/5902521/KS-RA-07-015-EN.PDF [Accessed: 15/08/2019].
Fairfield, P. and Yohn, T. (2001). Using Asset Turnover and Profit Margin to Forecast Changes in Profitability. Review of Accounting Studies 6 (4), 371-385.
Hannan, M., Carrol, G., Dobrev, S. and Han, J. (1998). Organizational Mortality in European and American Automobile Industries - Part I: Revisiting the Effects of Age and Size. European Sociological Review 14 (3), 279-302.