www.atmos-chem-phys.net/15/5047/2015/ doi:10.5194/acp-15-5047-2015
© Author(s) 2015. CC Attribution 3.0 License.
Molecular characterization of free tropospheric aerosol collected at
the Pico Mountain Observatory: a case study with a long-range
transported biomass burning plume
K. Dzepina1,2,*, C. Mazzoleni2,3, P. Fialho4, S. China2,3, B. Zhang2,5, R. C. Owen2,**, D. Helmig6, J. Hueber6, S. Kumar2,3,***, J. A. Perlinger2,5, L. J. Kramer2,7, M. P. Dziobak7, M. T. Ampadu1, S. Olsen8,****, D. J. Wuebbles8, and L. R. Mazzoleni1,2,7
1Department of Chemistry, Michigan Technological University, Houghton, MI, USA 2Atmospheric Science Program, Michigan Technological University, Houghton, MI, USA 3Department of Physics, Michigan Technological University, Houghton, MI, USA 4Department of Agricultural Sciences, Azores University, Angra do Heroísmo, Portugal
5Department of Civil and Environmental Engineering, Michigan Technological University, Houghton, MI, USA 6Institute of Arctic and Alpine Research (INSTAAR), University of Colorado, Boulder, CO, USA
7Department of Geological and Mining Engineering and Sciences, Michigan Technological University, Houghton, MI, USA 8Department of Atmospheric Science, University of Illinois, Urbana Champaign, IL, USA
*now at: Department of Biotechnology, University of Rijeka, Rijeka, Croatia **now at: US EPA, Research Triangle Park, NC, USA
***now at: National Center for Medium Range Weather Forecasting, Noida, India ****now at: Xyratex International Ltd, Sacramento, CA, USA
Correspondence to: K. Dzepina ([email protected]) and L. R. Mazzoleni ([email protected])
Received: 15 August 2014 – Published in Atmos. Chem. Phys. Discuss.: 25 September 2014 Revised: 2 April 2015 – Accepted: 7 April 2015 – Published: 5 May 2015
Abstract. Free tropospheric aerosol was sampled at the Pico Mountain Observatory located at 2225 m above mean sea level on Pico Island of the Azores archipelago in the North Atlantic. The observatory is located ∼ 3900 km east and downwind of North America, which enables studies of free tropospheric air transported over long distances. Aerosol samples collected on filters from June to October 2012 were analyzed to characterize organic carbon, elemen-tal carbon, and inorganic ions. The average ambient con-centration of aerosol was 0.9 ± 0.7 µg m−3. On average, or-ganic aerosol components represent the largest mass frac-tion of the total measured aerosol (60 ± 51 %), followed by sulfate (23 ± 28 %), nitrate (13 ± 10 %), chloride (2 ± 3 %), and elemental carbon (2 ± 2 %). Water-soluble organic mat-ter (WSOM) extracted from two aerosol samples (9/24 and 9/25) collected consecutively during a pollution event were analyzed using ultrahigh-resolution electrospray ionization Fourier transform ion cyclotron resonance mass
spectrom-etry. Approximately 4000 molecular formulas were assigned to each of the mass spectra in the range of m/z 100–1000. The majority of the assigned molecular formulas had unsat-urated structures with CHO and CHNO elemental composi-tions. FLEXPART retroplume analyses showed the sampled air masses were very aged (average plume age > 12 days). These aged aerosol WSOM compounds had an average O / C ratio of ∼ 0.45, which is relatively low compared to O / C ratios of other aged aerosol. The increase in aerosol load-ing durload-ing the measurement period of 9/24 was linked to biomass burning emissions from North America by FLEX-PART retroplume analysis and Moderate Resolution Imag-ing Spectroradiometer (MODIS) fire counts. This was con-firmed with biomass burning markers detected in the WSOM and with the morphology and mixing state of particles as determined by scanning electron microscopy. The presence of markers characteristic of aqueous-phase reactions of phe-nolic species suggests that the aerosol collected at the Pico
Mountain Observatory had undergone cloud processing be-fore reaching the site. Finally, the air masses of 9/25 were more aged and influenced by marine emissions, as indicated by the presence of organosulfates and other species charac-teristic of marine aerosol. The change in the air masses for the two samples was corroborated by the changes in ethane, propane, and ozone, morphology of particles, as well as by the FLEXPART retroplume simulations. This paper presents the first detailed molecular characterization of free tropo-spheric aged aerosol intercepted at a lower free troposphere remote location and provides evidence of low oxygenation after long-range transport. We hypothesize this is a result of the selective removal of highly aged and polar species dur-ing long-range transport, because the aerosol underwent a combination of atmospheric processes during transport facil-itating aqueous-phase removal (e.g., clouds processing) and fragmentation (e.g., photolysis) of components.
1 Introduction
The low scientific understanding of the properties and trans-formations of atmospheric aerosol is a key source of un-certainty in determining the anthropogenic climate forcing through the aerosol direct, semi-direct, and indirect effects (IPCC, 2013). Organic aerosol (OA) comprises 20–90 % of the atmospheric aerosol mass (Kanakidou et al., 2005; Zhang et al., 2007), and are the least understood component. Atmo-spheric OA include both primary and secondary OA (POA and SOA, respectively). POA are emitted directly into the atmosphere, while SOA are produced by homogeneous nu-cleation, oxidative reactions of gaseous organic precursors and condensation of their products onto pre-existing parti-cles, and aqueous phase reactions in cloud, fog, and particu-late water (Hallquist et al., 2009). The properties of aerosol in regions downwind of emission sources are impacted by the outflow of pollutants, their chemical transformation, and sinks. In particular, remote locations can be dominated by SOA (Zhang et al., 2007). Highly aged and processed long-range transported ambient aerosol are of particular inter-est and have chemical composition characteristic of global aerosol (Ramanathan et al., 2001). The long-range transport of aerosol from Asia to North America has received con-siderable attention (Ramanathan et al., 2001, 2007; Dunlea et al., 2009), but less attention has been placed on aerosol transported from North America to Europe. Ambient water-soluble organic matter (WSOM) is estimated to account for up to 80 % of the OA mass (Saxena and Hildemann, 1996; Sun et al., 2011), but these species are still not well char-acterized on a molecular level (Reemtsma, 2009). A signif-icant fraction of the WSOM is comprised of higher molec-ular weight (MW) humic-like substances (HULIS) (Graber and Rudich, 2006) and biogenic SOA (Schmitt-Kopplin et al., 2010; Mazzoleni et al., 2012). Identification of the WSOM composition is challenging. There are thousands of
species present with a wide range of elemental composi-tions and molecular weights containing multiple functional groups such as carboxyl, hydroxyl, carbonyl, nitro, nitrate, and sulfate. Molecular characterization of WSOM is impor-tant for understanding its role in fundamental processes such as aerosol light absorption and scattering (Dinar et al., 2006; Shapiro et al., 2009; Nguyen et al., 2013), chemical reduc-tion / oxidareduc-tion mediareduc-tion (Kundu et al., 2012), and water uptake and reactivity (Ervens and Volkamer, 2010; Ervens et al., 2011). Furthermore, aqueous SOA formation in clouds might explain the under-predictions of OA concentrations, especially at high altitudes (Carlton et al., 2008). Analytical methods capable of characterizing OA at the molecular level are necessary to tackle these problems.
To date, the Fourier transform ion cyclotron resonance mass spectrometer (FT-ICR MS; Kim et al., 2006) provides the highest mass resolution and accuracy. Typically, the FT-ICR MS mass resolving power and accuracy used for am-bient aerosol analysis are 200 000–400 000 and < 2 ppm, re-spectively (Mazzoleni et al., 2010). When combined with an appropriate ionization technique, FT-ICR MS is capable of resolving thousands of chemically different species in a sin-gle mass spectrum, and is ideally suited for the analysis of complex mixtures of ambient OA. Electrospray ionization (ESI) is a soft ionization technique that leaves the sample molecules intact and minimizes their fragmentation, and thus is ideal for coupling with FT-ICR MS for detailed molecular level OA characterization (Nizkorodov et al., 2011). Nega-tive mode ESI is especially useful for the ionization of mul-tifunctional oxidized compounds such as carboxyl groups. FT-ICR MS was successfully used for the analysis of ambi-ent OA (Wozniak et al., 2008; Schmitt-Kopplin et al., 2010; Mazzoleni et al., 2012), dissolved organic matter in rain (Al-tieri et al., 2009a, b, 2012; Mead et al., 2013; Zhao et al., 2013), fog water (Mazzoleni et al., 2010), and sea spray aerosol (Schmitt-Kopplin et al., 2012).
The Pico Mountain Observatory (PMO) is an ideal site for observations of free tropospheric air masses and pollutants from North America after transatlantic transport (Val Mar-tin et al., 2006, 2008a). The observatory is located at 2225 m above mean sea level (a.m.s.l.) in the summit caldera of a dormant volcano on Pico Island in the Azores archipelago in the North Atlantic (38◦2801500N; 28◦2401400W; Fig. S1 in the Supplement). The observatory is typically above the marine boundary layer height of 850–1100 m a.m.s.l. during summer (Kleissl et al., 2007), and is rarely affected by local emis-sions. Deeper marine boundary conditions with heights up to 1700 m a.m.s.l. have been reported for colder months (Kleissl et al., 2007) and of about 1500 m a.m.s.l. for other islands of the Azores archipelago (Remillard et al., 2012), although these are below the altitude of PMO. Measurements at the PMO began in July 2001 with a focus on gaseous species, black carbon, and meteorological parameters. Previous mea-surements at PMO (e.g., Val Martin et al., 2008a, b) and dis-persion model simulations (e.g., Owen et al., 2006) indicated
that North American outflow of tropospheric ozone and its precursors are frequently encountered at the site. These re-sults were crucial in explaining the evolution of North Amer-ican gaseous pollution and identified the signifAmer-icant impact of CO, O3, NOx, and NOy from boreal biomass burning
pollution on background air composition over the North At-lantic (Honrath et al., 2004; Lapina et al., 2006; Val Martin et al., 2006; Owen et al., 2006; Pfister et al., 2006), and en-hanced the understanding of the oxidation of non-methane hydrocarbons (NMHCs) (Helmig et al., 2008; Honrath et al., 2008). Previous research at PMO has shown several-fold in-creases of NMHCs in anthropogenic and biomass burning plumes. Furthermore, it has been demonstrated that isoprene and ratios of selected NMHC pairs have characteristic signa-tures that were used for identification of upslope flow con-ditions (Kleissl et al., 2006) and pollution plume charac-terization (Helmig et al., 2008). A recent analysis of per-oxyacetic nitric anhydride (PAN) showed that higher levels are transported to the PMO during colder, spring months, but not in warmer summer months due to thermal instability (K. Dzepina, J. Roberts, and the Pico Mountain Observatory team, personal communication, 2014; Fischer et al., 2014), consistent with previous estimates (Val Martin et al., 2008b). Until 2010, the only type of aerosol measured at the PMO was black carbon (BC). Fialho et al. (2005, 2006) developed a method to determine the contribution of BC and dust from multiwavelength aethalometer measurements. Although typ-ically average free tropospheric aerosol concentrations are low, the long-range transport events bring elevated levels of BC and dust mass concentrations to PMO. To study these events, new on- and off-line aerosol instrumentation was in-stalled in 2012, as described below.
This paper reports the first detailed chemical character-ization of free tropospheric aged aerosol sampled at the PMO during the summer of 2012. Detailed analysis of the WSOM molecular composition using ultrahigh resolution FT-ICR MS was performed for two aerosol samples collected during 24–26 September when a pollution event was ob-served. Molecular composition of the WSOM, on-line mea-surements, and laboratory analysis of aerosol are used to-gether with the simulations of a particle dispersion model and satellite data to deduce the emission sources and transforma-tional processes of the fine particles sampled at the PMO.
2 Measurements and methods
2.1 Aerosol measurements at the Pico Mountain Observatory
New aerosol instrumentation was installed at PMO in 2012, including an optical particle counter (MetOne GT-521, Grants Pass, OR, USA) for sizes in the range between 0.3 and 5 µm, a nephelometer (EcoTech Aurora 3000, Warren, RI, USA) to measure aerosol light scattering and
backscat-tering fraction at three wavelengths (450, 525 and 635 nm), an aerosol sample collector (custom-made at Michigan Tech) for scanning and transmission electron microscopy analysis, and four high-volume air samplers (Hi-Vols; EcoTech HiVol 3000, Warren, RI, USA). The four Hi-Vols were installed at ∼ 50 m from the PMO, and they collected samples from June through October 2012. They were operated at an aver-age volumetric flow rate of 84 m3h−1for 24 h. Cascade im-pactors (Tisch Environmental, TE-231 single stage High Vol-ume Cascade Impactor, Cleves, OH, USA) were used for size selection. PM2.5 (particulate matter with aerodynamic di-ameters ≤ 2.5 µm) was collected on quartz filters (Whatman, 20.3×25.4 cm Quartz Microfibre Filters, CAT No. 1851-865, Cleves, OH, USA), and particles > PM2.5 were captured on a separate filter (Tisch Environmental, 14.3×13.7 cm Quartz Filters, part no. TE-230 QZ, Cleves, OH, USA); the results reported here refer only to the PM2.5samples. Quartz filters were wrapped in aluminum foil, baked for 12 h at 550◦C,
then inserted into antistatic bags (Uline 22.9 × 30.5 cm Re-closable Static Shielding Bags, Pleasant Prairie, WI, USA), and stored at room temperature until use. Typically, filters were inserted in all four Hi-Vols during one visit to the site, and the Hi-Vols were programmed to sample consecutively for 24 h each. This was done because the site is reachable only via a strenuous hike on rugged terrain (Honrath et al., 2004). Sampled filters were refrigerated locally, transported cold to the US, and kept in a freezer until analysis. A total of 18 filters collected during the 2012 field campaign were se-lected for further laboratory analysis (Table 1). In 2012, we were unable to collect suitable field blanks due to seasonally above average wet conditions. Thus, a laboratory blank was used to evaluate artifacts. All measurement times reported in this paper are given in local time, which is the same as UTC. A seven wavelength aethalometer (Magee Scientific, model AE31, λ = 370, 470, 520, 590, 660, 880 and 950 nm) equipped with a “high sensitivity” circular spot size chamber was used to measure the aerosol attenuation coefficient at a flow rate of 7.7 dm3min−1 without size cut-off. Particulate matter was accumulated on a quartz fibre filter tape (Q250F from Pallflex©). The instrument was set up to automatically advance the tape every 24 h with a measurement interval of 5 min.
2.2 Laboratory aerosol measurements
2.2.1 Measurements of OC, EC, and inorganic ions Aerosol quartz filter samples were analyzed for organic and elemental carbon (OC and EC) with an OC-EC analyzer (Sunset Laboratory Inc., Model 4, Tigard, OR, USA), which uses the thermo-optical transmittance method (Birch and Cary, 1996). The reported results are an average of at least three measurements. OC and EC measurements were also performed for the blanks and subtracted from the aerosol samples. The blank OC values were 13 % (SD = 8 %) of the
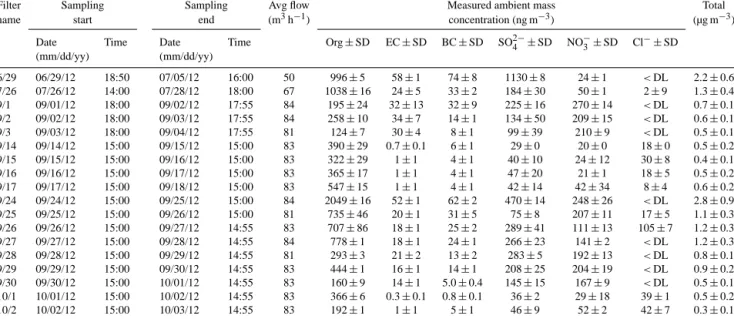
Table 1. Filters collected during the 2012 field campaign at the Pico Mountain Observatory. Collection times for all filter samples are 24 h,
except 6/29 (142 h) and 7/26 (52 h). Sampling times are given in local time (UTC). Average ambient concentrations of filter-collected PM2.5
species are given, as well as BC mass concentrations measured with the aethalometer at seven wavelengths averaged to the filters collection periods. All measurements are given with their respective standard deviations (1σ ). Note BC is not included in the calculated total.
Filter Sampling Sampling Avg flow Measured ambient mass Total
name start end (m3h−1) concentration (ng m−3) (µg m−3)
Date Time Date Time Org ± SD EC ± SD BC ± SD SO2−4 ±SD NO−3±SD Cl−±SD (mm/dd/yy) (mm/dd/yy) 6/29 06/29/12 18:50 07/05/12 16:00 50 996 ± 5 58 ± 1 74 ± 8 1130 ± 8 24 ± 1 <DL 2.2 ± 0.6 7/26 07/26/12 14:00 07/28/12 18:00 67 1038 ± 16 24 ± 5 33 ± 2 184 ± 30 50 ± 1 2 ± 9 1.3 ± 0.4 9/1 09/01/12 18:00 09/02/12 17:55 84 195 ± 24 32 ± 13 32 ± 9 225 ± 16 270 ± 14 <DL 0.7 ± 0.1 9/2 09/02/12 18:00 09/03/12 17:55 84 258 ± 10 34 ± 7 14 ± 1 134 ± 50 209 ± 15 <DL 0.6 ± 0.1 9/3 09/03/12 18:00 09/04/12 17:55 81 124 ± 7 30 ± 4 8 ± 1 99 ± 39 210 ± 9 <DL 0.5 ± 0.1 9/14 09/14/12 15:00 09/15/12 15:00 83 390 ± 29 0.7 ± 0.1 6 ± 1 29 ± 0 20 ± 0 18 ± 0 0.5 ± 0.2 9/15 09/15/12 15:00 09/16/12 15:00 83 322 ± 29 1 ± 1 4 ± 1 40 ± 10 24 ± 12 30 ± 8 0.4 ± 0.1 9/16 09/16/12 15:00 09/17/12 15:00 83 365 ± 17 1 ± 1 4 ± 1 47 ± 20 21 ± 1 18 ± 5 0.5 ± 0.2 9/17 09/17/12 15:00 09/18/12 15:00 83 547 ± 15 1 ± 1 4 ± 1 42 ± 14 42 ± 34 8 ± 4 0.6 ± 0.2 9/24 09/24/12 15:00 09/25/12 15:00 84 2049 ± 16 52 ± 1 62 ± 2 470 ± 14 248 ± 26 <DL 2.8 ± 0.9 9/25 09/25/12 15:00 09/26/12 15:00 81 735 ± 46 20 ± 1 31 ± 5 75 ± 8 207 ± 11 17 ± 5 1.1 ± 0.3 9/26 09/26/12 15:00 09/27/12 14:55 83 707 ± 86 18 ± 1 25 ± 2 289 ± 41 111 ± 13 105 ± 7 1.2 ± 0.3 9/27 09/27/12 15:00 09/28/12 14:55 84 778 ± 1 18 ± 1 24 ± 1 266 ± 23 141 ± 2 <DL 1.2 ± 0.3 9/28 09/28/12 15:00 09/29/12 14:55 81 293 ± 3 21 ± 2 13 ± 2 283 ± 5 192 ± 13 <DL 0.8 ± 0.1 9/29 09/29/12 15:00 09/30/12 14:55 83 444 ± 1 16 ± 1 14 ± 1 208 ± 25 204 ± 19 <DL 0.9 ± 0.2 9/30 09/30/12 15:00 10/01/12 14:55 83 160 ± 9 14 ± 1 5.0 ± 0.4 145 ± 15 167 ± 9 <DL 0.5 ± 0.1 10/1 10/01/12 15:00 10/02/12 14:55 83 366 ± 6 0.3 ± 0.1 0.8 ± 0.1 36 ± 2 29 ± 18 39 ± 1 0.5 ± 0.2 10/2 10/02/12 15:00 10/03/12 14:55 83 192 ± 1 1 ± 1 5 ± 1 46 ± 9 52 ± 2 42 ± 7 0.3 ± 0.1
average ambient OC mass. The blank EC values were be-low the detection limit and thus no EC blank subtraction was done.
Samples were analyzed for NO−3, SO2−4 , and Cl−with ion chromatography (ICS–2000 ion chromatograph with an Ion-Pac AS11 separator column (Dionex Corporation, Bannock-burn, IL, USA)). Samples were prepared for anion analysis by placing seven punches of 1.7 cm diameter into 12 mL of nanopure water and sonicating them twice for 30 min at room temperature. We report averages of the two measurements, blank subtracted for Cl−only; the Cl−in the blank was 48 % (SD = 21 %) of the Cl−in aerosol samples. The blank NO−3 and SO2−4 values were below the detection limit.
2.2.2 Ultrahigh resolution ESI FT-ICR MS analysis of WSOM
We selected two samples named 9/24 and 9/25 (filter-collection periods were 24 September at 15:00 to 25 Septem-ber at 15:00 and 25 SeptemSeptem-ber at 15:00 to 26 SeptemSeptem-ber at 15:00) for detailed chemical characterization by ultrahigh resolution mass spectrometry (Table 2). In this paper, unless noted otherwise, “9/24” and “9/25” always refer to the filter samples collected during these time periods.
A detailed description of the sample preparation, ESI FT-ICR MS measurements, and data processing is given in the Supplement. Briefly, WSOM samples for FT-ICR MS anal-ysis were prepared using reversed-phase solid-phase extrac-tion (Mazzoleni et al., 2010, 2012; Zhao et al., 2013). The analysis was performed at the Woods Hole Oceanographic Institution (Woods Hole, MA) Fourier Transform Mass
Spec-trometry facility with the ultrahigh-resolution hybrid linear ion trap and FT-ICR (7 tesla) mass spectrometer (LTQ FT Ultra, Thermo Scientific, San Jose, CA) with an ESI source. Three replicate measurements were done for each sample in the negative ion mode. The mass resolving power was set at 400 000 and the mass accuracy was < 2 ppm. Transient co-addition and molecular formula assignment were performed with Composer software (Sierra Analytics, Modesto, CA ver-sion 1.0.5) (Mazzoleni et al., 2012). The molecular formula calculator, which uses a Kendrick mass defect (KMD) analy-sis (Hughey et al., 2001) to sort ions into user-defined homol-ogous series, was set to allow up to 100 carbon, 400 hydro-gen, 100 oxyhydro-gen, 3 nitrohydro-gen, and 1 sulfur atom per molecular formula. All molecular formula assignments presented in this paper were assigned using CH2homologous series consistent with the PREDATOR algorithm (Blakney et al., 2011). The final data set for all samples is composed of the results of two methods for formula assignments: method A, with a de novo cutoff of m/z 500 and C, H, N, O, S elemental composition; and method B, with a de novo cutoff of m/z 1000 and C, H, O elemental composition (details are given in the Supplement). 2.2.3 Single particle morphology using scanning
electron microscopy
Quartz filter samples from 9/24 and 9/25 were further ana-lyzed with scanning electron microscopy (SEM) to investi-gate the morphology of particles and their possible sources. Four portions (5 mm × 5 mm) were used from different areas of each quartz filter, to obtain representative sample statistics. The samples were coated with a 1.8 nm thick platinum layer
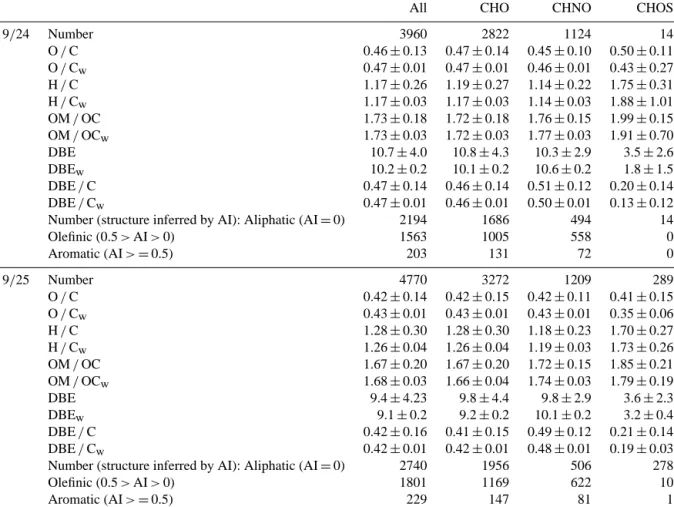
Table 2. Chemical characterization of the molecular assignments detected in WSOM for 9/24 and 9/25. Averages of three replicate analyses
(O / C, H / C, OM / OC, DBE and DBE / C) with calculated standard deviation (1σ ) of each data subset are given. Subscript “w” denotes values weighted by relative abundance, which have propagated standard error computed using the standard deviations for each subset (as described in Mazzoleni et al., 2012; Zhao et al., 2013).
All CHO CHNO CHOS
9/24 Number 3960 2822 1124 14 O / C 0.46 ± 0.13 0.47 ± 0.14 0.45 ± 0.10 0.50 ± 0.11 O / Cw 0.47 ± 0.01 0.47 ± 0.01 0.46 ± 0.01 0.43 ± 0.27 H / C 1.17 ± 0.26 1.19 ± 0.27 1.14 ± 0.22 1.75 ± 0.31 H / Cw 1.17 ± 0.03 1.17 ± 0.03 1.14 ± 0.03 1.88 ± 1.01 OM / OC 1.73 ± 0.18 1.72 ± 0.18 1.76 ± 0.15 1.99 ± 0.15 OM / OCw 1.73 ± 0.03 1.72 ± 0.03 1.77 ± 0.03 1.91 ± 0.70 DBE 10.7 ± 4.0 10.8 ± 4.3 10.3 ± 2.9 3.5 ± 2.6 DBEw 10.2 ± 0.2 10.1 ± 0.2 10.6 ± 0.2 1.8 ± 1.5 DBE / C 0.47 ± 0.14 0.46 ± 0.14 0.51 ± 0.12 0.20 ± 0.14 DBE / Cw 0.47 ± 0.01 0.46 ± 0.01 0.50 ± 0.01 0.13 ± 0.12
Number (structure inferred by AI): Aliphatic (AI = 0) 2194 1686 494 14
Olefinic (0.5 > AI > 0) 1563 1005 558 0 Aromatic (AI > = 0.5) 203 131 72 0 9/25 Number 4770 3272 1209 289 O / C 0.42 ± 0.14 0.42 ± 0.15 0.42 ± 0.11 0.41 ± 0.15 O / Cw 0.43 ± 0.01 0.43 ± 0.01 0.43 ± 0.01 0.35 ± 0.06 H / C 1.28 ± 0.30 1.28 ± 0.30 1.18 ± 0.23 1.70 ± 0.27 H / Cw 1.26 ± 0.04 1.26 ± 0.04 1.19 ± 0.03 1.73 ± 0.26 OM / OC 1.67 ± 0.20 1.67 ± 0.20 1.72 ± 0.15 1.85 ± 0.21 OM / OCw 1.68 ± 0.03 1.66 ± 0.04 1.74 ± 0.03 1.79 ± 0.19 DBE 9.4 ± 4.23 9.8 ± 4.4 9.8 ± 2.9 3.6 ± 2.3 DBEw 9.1 ± 0.2 9.2 ± 0.2 10.1 ± 0.2 3.2 ± 0.4 DBE / C 0.42 ± 0.16 0.41 ± 0.15 0.49 ± 0.12 0.21 ± 0.14 DBE / Cw 0.42 ± 0.01 0.42 ± 0.01 0.48 ± 0.01 0.19 ± 0.03
Number (structure inferred by AI): Aliphatic (AI = 0) 2740 1956 506 278
Olefinic (0.5 > AI > 0) 1801 1169 622 10
Aromatic (AI > = 0.5) 229 147 81 1
using a sputter coater (Hummer 6.2) and then imaged using a Hitachi S-4700 field emission SEM (FE-SEM). Over 2000 individual particles from each sample were classified to in-vestigate the relative abundance of spherical, near spherical, soot, and other irregularly shaped particles. Furthermore, we visually classified the soot particles (N = 433 and 550 for 9/24 and 9/25, respectively) into four classes: (1) heavily coated (embedded soot), (2) partly coated, (3) bare or thinly coated, and (4) attached with other material (partially en-capsulated) to investigate the degree of internal mixing after long-range transport (China et al., 2013, 2015). Elemental compositions of individual particles were investigated using energy-dispersive X-Ray spectroscopy (EDS).
2.3 Gas-phase measurements at the Pico Mountain Observatory
Nonmethane hydrocarbons were measured at PMO with a cryogen-free, custom-built inlet system interfaced to a gas
chromatograph with flame ionization detection (Tanner et al., 2006; Helmig et al., 2008, 2015).
Continuous surface ozone measurements were made by a Thermo-Scientific 49I UV absorption ozone analyzer us-ing ultraviolet absorption of ozone at 254 nm and the Beer-Lambert Law to relate the attenuation of light in sample cells to ozone concentration; an inlet was located 4 m above the ground level. This instrument has been calibrated to a US National Institute of Standards and Technology (NIST) trace-able standard, maintained at NOAA Global Monitoring Di-vision in Boulder, Colorado (McClure-Begley et al., 2014). 2.4 FLEXPART particle dispersion model
Air mass history was determined using the Lagrangian par-ticle dispersion model FLEXPART (version 8.2; Stohl et al., 1998). FLEXPART simulates the release of thousands of pas-sive tracer air parcels at the PMO location, advecting them backwards in time, providing a representation of the spatial distribution of the air mass at an upwind time referred to as
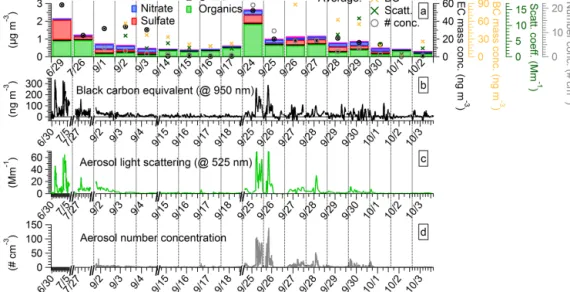
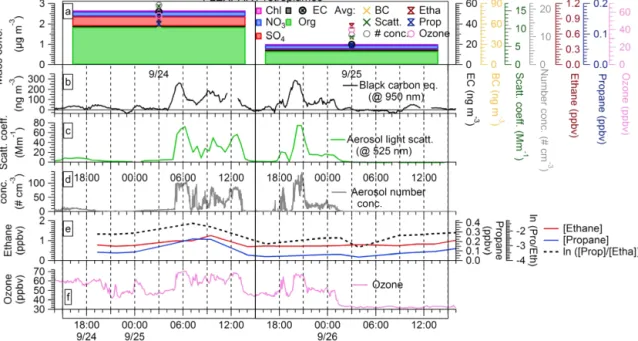
Figure 1. Time series of filter-collected aerosol species during the 2012 field campaign (a). The name of each filter measurement labeled
on the x axis is defined as the start date of measurement. Also shown are the time series of the collocated black carbon (b), aerosol light scattering (c), and particle number concentration measurements (d) for the periods overlapping with filter collection. On-line measurements are shown for all overlapping periods and each filter-collection period in (a) matches the continuous measurements in (b–d). Black dashed lines denote the start and end times of filter sampling. The on-line aerosol measurements were averaged for the filter-sampling periods and are represented by symbols in (a); these averages represent a simultaneous comparison with filter-collected species.
a “retroplume”. The meteorology data set was a combination of 6 h meteorological Final Analysis data at 00:00, 06:00, 12:00, and 18:00 UTC, and 6 h Global Forecast System data at 03:00, 09:00, 15:00, and 21:00 UTC. All other model set-tings matched those used in Owen et al. (2006). For each up-wind period, the portion of each retroplume in the 0–300 m layer was multiplied with anthropogenic and fire CO emis-sion inventories to predict plume sources and ages (Owen and Honrath, 2009).
3 Results and discussion
3.1 Chemical characterization of the Pico Mountain Observatory samples
The analysis of the bulk chemical composition showed that organic compounds often comprised the largest mass fraction of total aerosol (Table 1). Measured OC was converted to or-ganic matter (OM) using the OM / OC ratio of 1.8 adopted from Pitchford et al. (2007), representing the literature con-sensus for remote areas. The average ambient mass concen-tration (± standard deviation, 1σ ) of OM + EC + SO2−4 +
NO−3+Cl− at the PMO was 0.9 ± 0.7 µg m−3. On average, OM represents the largest mass fraction (60 ± 51 %), fol-lowed by sulfate (23 ± 28 %), nitrate (13 ± 10 %), chloride (2 ± 3 %), and EC (2 ± 2 %). An overview of the aerosol chemical composition is provided in Fig. 1a. The OM / OC ratio of 1.8 adopted in our analysis is slightly higher than the OM / OC ratio of ∼ 1.7 (Table 2) calculated from FT-ICR
MS analysis of WSOM elemental compositions (Mazzoleni et al., 2010). The measured value of 1.7 is expected to be lower than the total, because of the low sample recovery of highly oxygenated, low molecular weight species (Hallar et al., 2013).
Figure 1b–d show the continuous measurements of BC mass concentration, aerosol light scattering coefficient, and number concentration for time periods overlapping with the filter-collection. The average BC mass concentration over the filter-collection sampling periods (Fig. 1a) varied be-tween 0.82 and 74 ng m−3 (Table 1), the light scattering coefficient between 0.2 and 16.3 Mm−1, and the particle number between 0.3 and 21 particles m−3. Correlations be-tween total filter-collected aerosol mass and on-line aerosol measurements were very good, as shown in Fig. S2 (with an r2 of 0.80, 0.90, and 0.93 for BC mass concentration, the scattering coefficient, and the number concentration, re-spectively). This indicates that the measurements of filter-collected aerosol captured the major trends observed by the continuous aerosol measurements (Fig. 1).
3.2 Characterization of the air masses during 24–26 September 2012
This section describes the two sampling periods selected for this case study and provides evidences that the aerosol is representative of the described sources. An increase in the measured aerosol mass concentration and light scatter-ing was observed durscatter-ing September. The highest loadscatter-ing of filter-collected aerosol was observed on 9/24, followed by
a
b
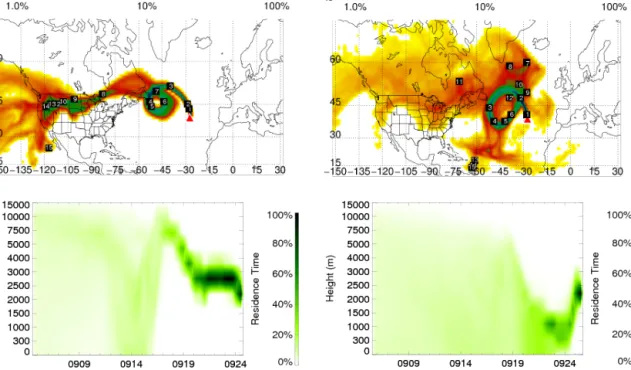
Figure 2. Examples of representative FLEXPART retroplumes for the 9/24 (a) and 9/25 (b) with the upwind time labeled by white numbers
in days at each location of the plume. In (a) the retroplume simulation is for 25 September at 06:00 (peak aerosol values (Fig. 1)). In (b) the retroplume simulation is for 26 September at 06:00 (low aerosol values (Fig. 1)). Times are in UTC (local time). FLEXPART retroplumes for the entire periods are given in Figs. S4 and S5. Residence times of retroplumes are normalized by each vertical interval in the lower plots to better visualize the distribution along an irregular height scale.
decreased mass concentrations on 9/25 (Fig. 1a). Similar trends were also observed in the continuous measurements (Fig. 1b–d). The event of interest started on 25 September at approximately 04:00 and lasted until the 26 at approx-imately 02:00 (Fig. 1b–d). The observed elevated aerosol concentrations are explained by the arrival of biomass burn-ing smoke from North America. September was a dry month and several US states were experiencing an intense drought (NOAA National Climatic Data Center, 2012). Con-sequently, widespread wildfires were observed in the US northwest and northern Rockies. The wildfire activity is cor-roborated by the Moderate Resolution Imaging Spectrora-diometer (MODIS) satellite daily fire counts (NASA and University of Maryland, 2002), showing the most intense wildfire activity in the northwestern US (Fig. S3 in the Sup-plement). Additionally, the Level 3 aerosol optical depth (AOD) dark target (Levy et al., 2007) product (1◦×1◦) re-trieved by MODIS Terra/Aqua at 550 nm (http://disc.sci.gsfc. nasa.gov/giovanni, accessed on 22 July 2014) indicated a large increase from mid to late September over the north-western US (data not shown).
The FLEXPART retroplumes show that the transport pat-terns changed significantly within 48 h, resulting in the ar-rival of air masses with different chemical signatures to the PMO (retroplumes for 9/24 and 9/25 are given in Figs. 2, S4 and S5). During the 9/24 period, the average modeled
CO age was 12.4 days. A large portion of the retroplumes intersected the northwestern US regions of intense wildfires activity during 13–15 September (Figs. 2 and S3). A few retroplumes (Fig. S4e–g) were lifted to the free troposphere within the next day and encountered a high pressure system before arriving at PMO. Retroplumes during the 9/25 pe-riod had a CO tracer age of 14.7 days and were character-ized by gradual shift of the transport heights from the mid-dle free troposphere to the marine boundary layer with re-duced influence from the US. Retroplumes subsided and en-tered the marine boundary for 2 days before arriving at PMO (Fig. S5e–h). Therefore, the air masses arriving at PMO dur-ing 24–26 September were influenced by the US biomass burning, while those that arrived during 9/25 were also influ-enced by the marine boundary layer. Simulated contributions of FLEXPART CO from various sources for September are given in Fig. S6.
We also examined the occurrence of upslope flow due to mechanical lifting (Zhang et al., 2014). No occurrence of up-slope flow was observed for the period of 24–26 September. This suggests that measurements during those dates were not affected by local emissions.
3.2.1 Non-methane hydrocarbon measurements NMHCs have been widely used as tracers for anthro-pogenic and biomass burning emissions (Helmig et al.,
Figure 3. Comparison of aerosol measurements (a–d) during the 24–26 September case study with gas-phase measurements of ethane,
propane (e) and ozone (f). On-line measurements are also averaged during the filter-sampling periods (a). Marked within the figure are the times of filter-collection periods (black rectangular shapes, as given in Table 1) and FLEXPART retroplume simulations (dashed lines, as shown in Figs. 2, S4 and S5). Times and dates are shown in the x axis of (d) and (f).
2008). Due to their different oxidation rates, mole frac-tions of different NMHCs exponentially decline at differ-ent rates during atmospheric transport allowing the natural log of NMHC1/NMHC2(e.g., ln([propane]/[ethane])) to be used as a linear measure of photooxidation and transport time. ln([propane]/[ethane]) has been demonstrated to be a sensitive indicator for identifying pollution signatures and transport time to PMO (Helmig et al., 2008, 2015). Mea-sured ethane and propane are shown together with the filter-measured species and continuous aerosol measurements for comparison in Fig. 3a–e. The mixing ratios of ethane and propane increased from 0.78 and 0.09 ppbv at 19:20 in the evening of 24 September to a maximum of 1.25 and 0.22 ppbv at 09:30 in the morning of 25 September. This was followed by a clear decrease in ethane and propane to average mixing ratios of 0.76 and 0.06. Decreases in NMHC mixing ratios were also evident from the decrease of ln([propane]/[ethane]) (Fig. 3e). The same trend was ob-served in the ozone mixing ratios during the case study pe-riod (Fig. 3f). The decreases in ethane, propane and ozone mixing ratios, as well as in ln([propane]/[ethane]), suggest a significant change in the air masses transport and history, from less aged and more polluted air masses during measure-ment period of 9/24 to more aged and cleaner during mea-surement period of 9/25, in agreement with the FLEXPART findings. The full record of gas-phase species measured dur-ing periods overlappdur-ing with Hi-Vols sampldur-ing is shown in Fig. S7.
3.2.2 Scanning electron microscopy single particle analysis
Representative SEM images for 9/24 and 9/25 are shown in Fig. 4a and b, respectively. A higher fraction of spheri-cal particles was observed on 9/24 (43 %) compared to 9/25 (18 %). However, the fraction of near spherical particles was lower on 9/24 (23 %) compared to 9/25 (29 %). Spherical particles observed on 9/24 and 9/25 were likely tar balls (TBs) with diameters in the range of 70–1800 nm (Fig. 4c-d). TBs are spherical, organic amorphous particles composed of carbon and oxygen abundant in biomass burning aerosol (Adachi and Buseck, 2011; China et al., 2013; Pósfai et al., 2003, 2004; Tivanski et al., 2007). The EDS analysis of spherical and near spherical particles shows that they were mostly composed of C and O, consistent with the hypoth-esized identification. As described by China et al. (2013), soot particles emitted from biomass burning are often heav-ily coated (embedded) with other material. Thus, we visually classified the soot particles and found that for the 9/24 event, 46 % of the soot particles (with respect to the total number of classified soot particles) were heavily coated (Fig. 4e– h), compared to only 17 % on 9/25. The higher fraction of heavily coated soot particles observed for 9/24 is consistent with the air mass being most likely influenced by biomass burning. Finally, 34 and 58 % of soot was partly coated, 11 and 17 % thinly coated, and 7 and 8 % partially encapsulated, for 9/24 and 9/25, respectively. Note that tar balls are likely not water-soluble and therefore, the ultrahigh resolution mass
spectrometry analysis of WSOM presented below probably does not probe them.
3.3 Molecular characterization of the 9/24 and 9/25 samples
3.3.1 Mass spectra and molecular formula assignments The exact mass measurements of the ultrahigh resolution FT-ICR MS allow for unequivocal molecular formula assign-ments of WSOM in the form of CcHhNnOoSs, where c, h, n, o, and s are integer numbers of C, H, N, O, and S atoms. Molecular formulas were assigned to 68–78 % of the total ion current depending on the sample and whether the assignment of molecular formulas was performed by method A or B. The three replicate measurements of 9/24 and 9/25 analyzed by method A with C, H, N, O, and S resulted in 72 and 78 % as-signments of total ion current. Additional molecular formu-las at the higher m/z values were assigned with method B for species containing C, H, and O only. When methods A and B were combined, the assignments yielded a total of 3960 and 4770 monoisotopic molecular formulas for 9/24 and 9/25 (Table 2). Polyisotopic formula assignments containing nat-urally occurring 13C and34S were also detected in aerosol samples. The vast majority of all assigned monoisotopic for-mulas contained corresponding13C assignments (91–95 %), while 69–100 % of 32S-containing monoisotopic ions also contained formula assignments with34S, consistent with pre-vious findings (e.g., Mazzoleni et al., 2012).
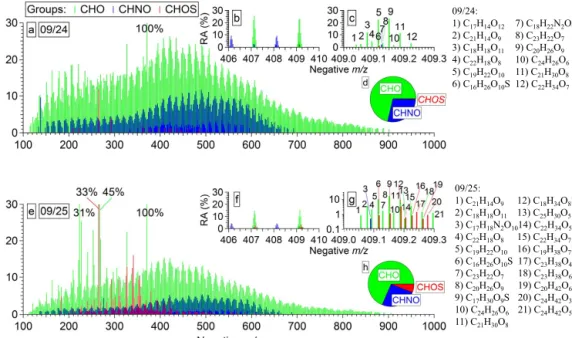
The reconstructed mass spectra of molecular formulas as-signed to 9/24 and 9/25 (Fig. 5) indicate a high isobaric complexity due to the large number of monoisotopic anions (Table 2). Examples of the isobaric complexity are illustrated for the range of m/z 409.0–409.3 (Fig. 5c and g) with 12 and 21 molecular assignments for 9/24 and 9/25. Mass spectra of both samples are characterized by high m/z values with a maximum relative abundance of the detected ions in the range of m/z 400–500. Approximately 2/3 of the molecular assignments are for anions with m/z > 400. This is a unique feature of the WSOM compounds at PMO that has not been observed in other samples analyzed using similar FT-ICR MS methods. Previously, the maximum relative abundance of molecular assignments detected in aerosol (Wozniak et al., 2008; Schmitt-Kopplin et al., 2010; Mazzoleni et al., 2012) and cloud water (Zhao et al., 2013) was observed between
m/z200 and 400. Moreover, aerosol collected at various lo-cations typically does not have a significant number of com-pounds detected > m/z 400 (e.g., Wozniak et al., 2008; Maz-zoleni et al., 2010). The higher molecular weight ranges ob-served in the PMO WSOM are likely a consequence of the combined oxidative aging and aqueous-phase oligomers for-mation during the long-range transport.
The assigned molecular formulas were divided into four groups based on their elemental composition and named af-ter the atoms included: CHO, CHNO, CHOS, and CHNOS.
The highest number of molecular assignments were CHO group species, which account for ∼ 70 % of the total num-ber (Table 2). CHO species had the highest observed rela-tive abundances with a maximum in the range of m/z 400– 500 (Fig. 5). The second most abundant group of species was CHNO, representing ∼ 26 % of the molecular assign-ments (Table 2). The maximum relative abundance of the CHNO group was at slightly higher m/z values compared to the CHO compounds. We observed a surprisingly small num-ber of S-containing species. There were 14 and 289 CHOS molecular formulas in 9/24 and 9/25, representing 0.4 and 6 % of the assignments. The CHOS species detected in 9/24 had low relative abundances; only two ions had relative abun-dances > 1.5 % (C12H26SO4and C14H30SO4). Most of the CHOS assignments in 9/25 also had low relative abundances (< 2 %), but 12 have relative abundances > 5 %. Finally, a very small number of low relative abundance CHNOS com-pounds was detected in 9/24 and 9/25 (N = 7 and 28). Due to their high water solubility, it is not likely that nitrooxy organosulfates will be observed after long-range transport because they are likely removed by cloud processing. This observation is also consistent with the low number of sulfur-containing species. Thus, the CHNOS molecular formula as-signments are not presented here.
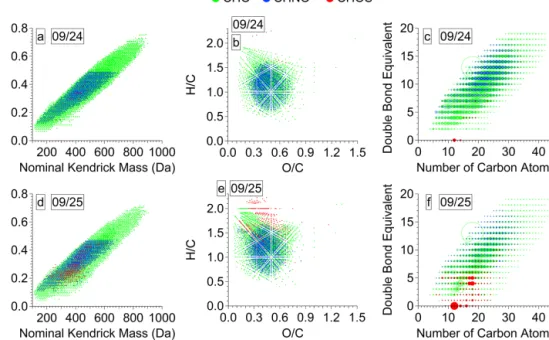
Overall, the Kendrick plots of the molecular assignments for the two samples (Fig. 6a and d) have higher KMD and nominal Kendrick mass (NKM) values with a narrow range and an overall more uniform distribution compared to pre-vious measurements with similar ESI FT-ICR MS measure-ment parameters. For example, in comparison with the cloud water WSOM reported by Zhao et al. (2013), the free tropo-spheric aerosol WSOM studied here had a narrower spread in the NKM over the observed mass ranges. This narrow and uniform distribution has not been observed in other Kendrick plots of aerosol WSOM (e.g., Kourtchev et al., 2013) and may indicate highly processed aerosol. Ultrahigh-resolution FT-ICR MS measurements of a Suwannee River Fulvic Acid standard, a model for HULIS, yield very similar distribution in the Kendrick plot (Stenson et al., 2003).
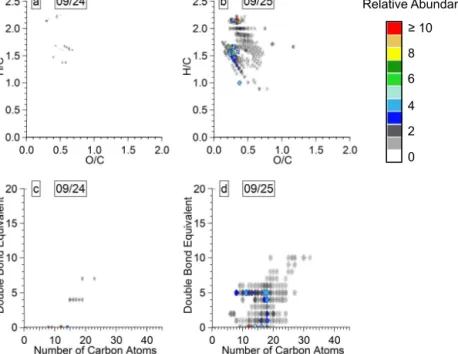
The van Krevelen diagrams for the 9/24 and 9/25 in Fig. 6b and e show a narrow and homogeneous distribution with aliphatic and olefinic species (Table 2). For example, the range of values of O / C ratio for aerosol WSOM collected at the PMO vs. the Storm Peak Laboratory (Mazzoleni et al., 2012) is 0.13–1.48 vs. 0.07–1.80 (Table 3). Mass resolved H / C diagrams are given in Fig. S8 to indicate the quality of the molecular assignments of the ultrahigh-resolution FT-ICR mass spectra. The similarity in the distribution of species in the mass resolved H / C diagram to those reported previ-ously (Schmitt-Kopplin et al., 2010) is further discussed in the sections below.
Structural information for the assigned molecular formu-las is inferred from the double bond equivalent (DBE) val-ues; the calculation of DBE is given in the Supplement. A wide range of DBE values were observed for 9/24 and 9/25
500 nm 500 nm 500 nm 500 nm 500 nm 500 nm a) b) c) d) e) f) g) h)
Figure 4. Representative SEM images of particles collected on 9/24 (a) and 9/25 (b). Also shown are examples of spherical (43 and 18 %
in 9/24 and 9/25, respectively) (c), near spherical particles (23 and 29 % in 9/24 and 9/25, respectively) (d), and embedded soot particles (46 and 17 % in 9/24 and 9/25, respectively) (e–h).
10 1 0.1 09/24: 1) C17H14O12 7) C18H22N2O9 2) C21H14O9 8) C23H22O7 3) C18H18O11 9) C20H26O9 4) C22H18O8 10) C24H26O6 5) C19H22O10 11) C21H30O8 6) C16H26O10S 12) C22H34O7 09/25: 1) C21H14O9 12) C18H34O8S 2) C18H18O11 13) C25H30O5 3) C17H18N2O1014) C22H34O5S 4) C22H18O8 15) C22H34O7 5) C19H22O10 16) C19H38O7S 6) C16H26O10S 17) C23H38O4S 7) C23H22O7 18) C23H38O6 8) C20H26O9 19) C20H42O6S 9) C17H30O9S 20) C24H42O3S 10) C24H26O6 21) C24H42O5 11) C21H30O8
Figure 5. Reconstructed mass spectra of the assigned monoisotopic ions for PMO WSOM on 9/24 (a–d) and 9/25 (e–h) with CHO, CHNO
and CHOS groups of compounds. Number fractions of detected monoisotopic formula assignments in all groups are given as the pie charts in (d) and (h). An illustration of the isobaric complexity is shown as an excerpt of mass spectra in the ranges of m/z 406—410 (b and f) and
m/z409.0–409.3 (c and g). All identified molecular formulas between m/z 409.0 and 409.3 are listed in the order of appearance.
(Fig. 6c and f) consistent with the molecular complexity of the samples described above. Aromaticity index (AI) analy-sis of PMO WSOM supports the observations from the el-emental ratios and DBE values (AI calculation is described in the Supplement). In both samples, most of the species had aliphatic (∼ 55 %) and olefinic (∼ 40 %) character with only a small contribution from aromatic species (∼ 5 %) (Table 2). This finding is in agreement with previous studies of ambient aerosol (Schmitt-Kopplin et al., 2010; Mazzoleni et al., 2010, 2012; LeClair et al., 2012), which also found that the
major-ity of species has aliphatic and olefinic character. Examples which illustrate the chemical composition complexity avail-able with FT-ICR MS analysis are given in the Supplement (Fig. S9).
3.3.2 Characteristics of the CHO molecular formulas The CHO species presented in the isoabundance van Kreve-len diagram (Fig. 7a–b) for 9/24 and 9/25 had average O / C ratios of 0.47 and 0.42 and average H / C ratios of 1.19 and 1.28 (Table 2). Isoabundance is defined as the total relative
Figure 6. Characterization of all monoisotopic molecular assignments detected in WSOM of 9/24 (top panels) and 9/25 (bottom panels).
Kendrick mass defect vs. nominal Kendrick mass for 9/24 (a) and 9/25 (d). van Krevelen diagrams for 9/24 (b) and 9/25 (e). Double bond equivalents vs. number of carbon atoms for 9/24 (c) and 9/25 (f). The size of markers in (c) and (f) denotes relative abundance. Examples of details in all three types of graphical representations are given in the Supplement (Fig. S9).
Table 3. Chemical characterization of the molecular assignments detected in selected studies. All values are average (arithmetic mean).
Sample name Sample type Measurement site O / C H / C OM / OC DBE DBE / C MW Reference
Pico 9/24 Aerosol Free troposphere 0.46 1.17 1.73 10.7 0.47 478 This study
Pico 9/25 Aerosol Free troposphere 0.42 1.28 1.67 9.4 0.42 462
Storm Peak Lab S4SXA Aerosol Remote 0.53 1.48 1.91 6.2 0.34 414 Mazzoleni et al. (2012)
Millbrook, NY1 Aerosol Rural 0.32 1.46 1.60 6.30 0.33 366 Wozniak et al. (2008)
Harcum, VA1 Aerosol Rural 0.28 1.37 1.54 7.45 0.38 360
K-Puszta 2004 (KP2004)2
Aerosol Rural 0.48 1.40 1.84 7.36 0.37 408 Schmitt-Kopplin et
al. (2010) K-Puszta 2005
(KP2005)2
Aerosol Rural 0.39 1.22 1.69 10.1 0.46 430
Pearl River Delta, China Aerosol Urban, Suburban, Ru-ral, Regional
0.46 1.34 1.85 5.3 0.45 265 Lin et al. (2012a)
Atlantic Ocean3 Aerosol Marine boundary layer
0.35 1.59 1.67 4.37 0.28 317 Schmitt-Kopplin et al. (2012) North Atlantic Ocean –
All4
Aerosol Marine boundary layer
0.42 1.49 1.74 6.76 0.32 445 Wozniak et al. (2014) North Atlantic Ocean –
Aged Marine4
Aerosol Marine boundary layer
0.36 1.56 1.70 5.88 0.28 423
Storm Peak Lab CW1 Cloud water Remote 0.62 1.46 2.08 6.3 0.38 402 Zhao et al. (2013)
Storm Peak Lab CW2 Cloud water Remote 0.61 1.46 2.06 6.3 0.38 400
Fresno fog Fog water Rural 0.43 1.39 1.77 5.6 0.40 289 Mazzoleni et al. (2010)
Camden and Pinelands, NJ5
Rainwater Urban impacted 1.02 1.49 2.73 3.24 0.44 220 Altieri et al. (2009a, b) Values were calculated:1For each sample presented in Wozniak et al. (2008).2For only two samples (KP2004 and KP2005) presented in Schmitt-Kopplin et al. (2010).3For only one, marine aerosol,
sample presented in Schmitt-Kopplin et al. (2012).4For all samples (and only one PCA group) presented in Wozniak et al. (2014).5By combining the negative mode FT-ICR MS data available in
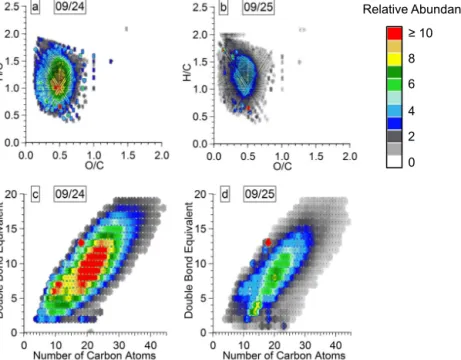
Relative Abundance ≥ 10 0 2 4 8 6
Figure 7. CHO isoabundance van Krevelen diagrams of 9/24 (a) and 9/25 (b) with all detected individual ions shown as dots to facilitate
visualization of CH2homologous series. Also shown are the double bond equivalents vs. the number of carbon atoms of the 9/24 (c) and
9/25 (d) for the CHO group with symbol colour representing the relative abundance.
abundance of the overlapped species in the van Krevelen di-agram depicted with a color scale. Overall, the range of ob-served O / C ratios is 0.1–1.5 and the range for H / C ratios was 0.4–2.2. The highest relative abundance species in 9/24 were near O / C ∼ 0.5 and H / C ∼ 1.1 and those in 9/25 were near O / C ∼ 0.4 and H / C ∼ 1.2. There were eight low relative abundance (< 3 %) molecular assignments with an O / C ≥ 1 in each sample. Both samples had a wide distri-bution of elemental ratios around the maximum in the van Krevelen diagrams (Table 3). The distribution of elemental ratios for the CHO molecular assignments in this study was similar to the aerosol reported by Mazzoleni et al. (2012) and narrower than the cloud water values reported by Zhao et al. (2013), both of which were measured at the Storm Peak Laboratory. This is consistent with the observed lower aver-age values of O / C and H / C in this study (∼ 0.44 and 1.22) compared to that of Mazzoleni et al. (2012) (0.47 and 1.42) and Zhao et al. (2013) (0.54 and ∼ 1.42).
The DBE of the CHO molecular assignments for PMO samples (Fig. 7c–d) spanned a wide range of values (0–19) and increased with the carbon number. The average DBE val-ues for 9/24 and 9/25 were 10.8 and 9.8 and much higher than values of ∼ 6 observed in WSOM studies of continen-tal samples (Mazzoleni et al., 2012; Lin et al., 2012a; Zhao et al., 2013), which indicates they were less saturated (Ta-ble 3). Another indicator of molecular saturation for high molecular weight species, such as those found in the Pico aerosol, is the carbon-normalized DBE (DBE / C) (Hocka-day et al., 2006; detailed explanation is in the Supplement).
The average DBE / C values of the CHO group for 9/24 and 9/25 were 0.46 and 0.41 (Table 2), confirming the lower de-gree of saturation compared to Mazzoleni et al. (2012) and Zhao et al. (2013) (DBE / C values for CHO group assign-ments were 0.37 and 0.35). However, nearly all of the CHO molecular assignments were below the aromaticity criteria of DBE / C ≥ 0.7 (95 and 97 % for 9/24 and 9/25), indi-cating an overall lack of aromaticity. The CHO species were equally distributed among the entire range of DBE values, with the highest relative abundance species in 9/24 and 9/25 found in the ranges of DBE 5–14 and 3–14. The high relative abundance compounds (relative abundance ≥ 10 %) of 9/24 had 7–30 carbon atoms and the highest relative abundance compounds (relative abundance ≥ 20 %) had molecular as-signments with 17–24 carbon atoms (Fig. 7c). DBE values of 9/25 follow a similar pattern (Fig. 7d) and its high relative abundance CHO compounds had 8–31 carbon atoms (rela-tive abundance ≥ 5 %), with the highest rela(rela-tive abundance compounds (relative abundance ≥ 10 %) among molecular assignments having 12–26 carbon atoms. Clearly, the high-est relative abundance CHO species of 9/25 had a wider dis-tribution of DBE values than those on 9/24. The weighted O / C ratios of 0.47 and 0.43 for the CHO groups (Table 2) of 9/24 and 9/25 were similar to those observed for other sam-ples collected at the Storm Peak Laboratory, a high-altitude observatory near Steamboat Springs, CO, USA. Mazzoleni et al. (2012) reported a value of 0.48 for aerosol and Zhao et al. (2013) reported a value of 0.47 for cloud water, both collected at the Storm Peak Laboratory. The weighted H / C
Relative Abundance ≥ 10 0 2 4 8 6
Figure 8. CHNO isoabundance van Krevelen diagrams of 9/24 (a) and 9/25 (b) with all detected individual ions shown as dots to facilitate
visualization of CH2homologous series. Also shown are the double bond equivalents vs. the number of carbon atoms of the 9/24 (c) and
9/25 (d) for the CHNO group with symbol colour representing the relative abundance.
ratios for 9/24 and 9/25 observed in this study were 1.17 and 1.26, which is lower than values of ∼ 1.5 previously reported for WSOM samples of aerosol (Wozniak et al., 2008; Maz-zoleni et al., 2012), cloud water (Zhao et al., 2013), fog water (Mazzoleni et al., 2010), and rainwater (Altieri et al., 2009a) (Table 3). The O / C ratios of PMO aerosol are consistent with those reported for aged biomass burning aerosol mea-sured by an Aerodyne Aerosol Mass Spectrometer (AMS) (Aiken et al., 2008). Ultrahigh resolution MS elemental ra-tios have been found to both agree (Bateman et al., 2012) and disagree (O’Brien et al., 2013) with the ones measured by AMS, although a direct comparison of elemental ratios measured by FT-ICR MS and AMS has not yet been reported. Numerous molecular formulas matching biomass burn-ing markers (Simoneit, 2002) were observed in PMO sam-ples. Burning products of biopolymers such as cellulose, lignin, and lignans can represent major amounts of OA originating from biomass burning. Levoglucosan is one of the main particle-phase markers of cellulose decomposi-tion and its molecular formula (C6H10O5) was observed in 9/24 and 9/25 with relative abundances of 3.4 and 0.6 %. Note this formula could come from other com-pounds with the same molecular formula such as galac-tosan and mannosan (Simoneit et al., 2001). In both sam-ples, we also observed formulas that could be lignin pyrol-ysis products such as vanillic acid (C8H8O4; relative abun-dance = 11.1 and 2.0 %), syringaldehyde (C9H10O4; relative abundance = 9.2 and 2.0 %) and syringic acid (C9H10O5; relative abundance = 7.3 and 1.4 %). In all of the cases,
higher relative abundances were observed in the mass spec-tra of 9/24. Burning of lignin produces phenol (C6H6O), guaiacol (2-methoxyphenol; C7H8O2) and syringol (1,3-dimethoxyphenol; C8H10O3)(Simoneit, 2002). Phenols can also be formed in the atmosphere by oxidation of aromat-ics and HULIS (Graber and Rudich, 2006). These molecu-lar formulas were found in 9/24 and 9/25 with higher rel-ative abundance on 9/24, including phenol (relrel-ative abun-dance = 3.5 and 0.6 %), guaiacol (relative abunabun-dance = 2.8 and 0.7 %), and syringol (relative abundance = 7.0 and 1.5 %). Sun et al. (2010) observed that aqueous-phase oxida-tion of guaiacol and syringol yields a substantial fracoxida-tion of dimers and higher oligomers, with key dimer markers iden-tified as C16H18O6 and C14H14O4. Their results indicated that fog and cloud processing of phenolic species could be an important mechanism for the production of low-volatility SOA. The dimer markers C16H18O6and C14H14O4were also present in PMO WSOM with high relative abundance (for 9/24: relative abundance = 14.1 and 8.1 %; for 9/25: relative abundance = 4.4 and 2.4 %).
3.3.3 Characteristics of the CHNO molecular formulas CHNO species had a narrow distribution of elemental ra-tios in the isoabundance van Krevelen diagram (Fig. 8a–b). For 9/24, O / C and H / C ratios spanned the range of 0.2– 0.75 and 0.6–1.6 with higher relative abundance molecular formulas (relative abundance ≥ 4 %) in the range of 0.3–0.6 and 0.8–1.4. Similar values were observed for 9/25. Aver-age O / C ratios for 9/24 and 9/25 were 0.45 and 0.42 and
average H / C ratios were 1.14 and 1.18. A comparison of the distribution of the CHO and CHNO molecular assignments in the van Krevelen diagrams (Figs. 7 and 8, respectively) shows that they were found in similar ranges. The average elemental ratios for CHO and CHNO species were similar for both samples, which is a possible indication of the same emission sources and transformational processes. The O / C ratios of the CHNO compounds were lower than those pre-viously observed for continental aerosol (0.57; Mazzoleni et al., 2012) and cloud water (0.72; Zhao et al., 2013). Similarly, CHNO molecular species detected in continental rainwater (Altieri et al., 2009a, b) were more oxygenated (O / C = 1.6) and saturated (H / C = 1.9) than PMO aerosol WSOM. Rural aerosol collected at a ground site had elemental ratios sim-ilar to those reported here and might have been influenced by biomass burning as indicated by the detection of marker species such as lignin and nitro-aromatics (Wozniak et al., 2008). Likewise, Schmitt-Kopplin et al. (2010) reported sim-ilar elemental ratios for an aerosol sample collected during a biomass burning event (Table 3). They observed a high abundance of CHNO species attributed to aromatic acids, lignins, and SOA formation. The same work reports mass re-solved H / C diagrams for biomass burning aerosol (Schmitt-Kopplin et al., 2010), which had a strong resemblance to those reported here for both PMO samples (Fig. S8a–b). A significant contribution of CHNO compounds was observed in aerosol collected in the Pearl River Delta region in China and was attributed to biomass burning HULIS and photo-chemically produced SOA (Lin et al., 2012a). The CHNO molecular assignments in their study had similar elemental ratios (O / C = 0.41 and H / C = 1.15) and an OM / OC ra-tio (1.80) as those described here, and their composira-tion was explained by the presence of nitro or nitrate groups. Similar to the findings of Lin et al. (2012a), we observed high O / N ratios (∼ 8 on average) and nearly all CHNO compounds had O / N ≥ 3, indicating that nitrogen was in the form of organic nitrate (-ONO2)or nitro (-NO2)groups with excess oxygen forming additional oxygenated groups.
The DBE values for the CHNO molecular assignments covered a wide range from 4 to 17 for both samples (Fig. 8c– d). This range of DBE values represented CHNO species with carbon numbers up to 35. As expected, the DBE in-creased with the increase in the number of carbon atoms. CHNO molecular assignments with high relative abundance in 9/24 had 16–30 carbon atoms with DBE values in the range of 8–16. The most abundant CHNO species were those with 19–25 carbon atoms and DBE in the range of 10– 12. Similar characteristics were observed in 9/25. Finally, CHNO molecular assignments in 9/24 and 9/25 had average DBE of 10.3 and 9.8, and DBE / C ones of 0.51 and 0.49 (Ta-ble 2), with nearly all molecular formula with DBE / C below the aromaticity criteria of 0.7 (92 and 94 %). Similar to the CHO compounds, the DBE values of CHNO compounds in this study were much higher than those observed for conti-nental WSOM samples in other studies.
In both PMO aerosol WSOM samples, we observed 1 or 2 nitrogen atoms (N1or N2molecular formulas, respec-tively) per CHNO molecular formula, although we allowed up to 3 nitrogen atoms per formula assignment. In both sam-ples, N1molecular formulas make up the majority of CHNO species (91 %), while N2molecular formulas represent only 9 %. In order to better understand this, we divided molecu-lar formulas according to their nitrogen and oxygen content. In this way, a distribution of the subclasses is observed. This distribution was very similar for the two samples (Fig. S10): N1and N2CHNO molecular assignments had up to 14 and 13, respectively, O atoms. For the N1 species, the trend of the sum of relative abundance vs. oxygen number (Fig. S10) uniformly increased to its maximum of ∼ N1O11after which it dropped off sharply. Nearly all molecular formulas in the N1and N2 classes were enriched in oxygen (high O / N ra-tio), indicating the likely presence of organic nitrate or nitro groups.
3.3.4 Characteristics of the CHOS molecular formulas A small number of CHOS molecular assignments (N = 14 and 289 for 9/24 and 9/25) was observed and the major-ity of them had low relative abundance. For 9/24, CHOS molecular assignments had average O / C and H / C tios of 0.5 and 1.75, respectively (Fig. 9a). The H / C ra-tio was significantly higher than those observed for CHO and CHNO compounds, indicating a higher degree of sat-uration. Relatively high saturation of 9/24 CHOS species was confirmed by their significantly lower average DBE (Fig. 9c) and DBE / C value of 0.20 (Table 2). Furthermore, no molecular assignments in 9/24 (as well as in 9/25) were found above the DBE / C aromaticity threshold of 0.7. The range of DBE values for 9/24 is 0–7, with only three dis-crete DBE values (0, 4 and 7). Except for three molecular assignments (C23H34O9S, C19H26O10S, and C19H26O11S), most of the CHOS compounds in 9/24 can be grouped into three CH2 homologous series in the van Krevelen di-agram (C7H16(CH2)1−2,5,7O4S, C14H22(CH2)1−4O10S, and C14H22(CH2)1−2,5O8S). We note the presence of a very low number of CHOS assignments in 9/24.
The 9/25 species had a substantially higher number of CHOS assignments (N = 289). The isoabundance van Krev-elen diagram (Fig. 9b) shows that CHOS species had a similar average O / C ratio and higher H / C ratio than the CHO and CHNO species. The range of O / C ratios for the CHOS species in 9/24 was 0.1–1.2 and the H / C ratio range was 0.9–2.2. The average elemental ratios were O / C = 0.41 and H / C = 1.7. The elemental ratios did not show a nar-row distribution in the van Krevelen diagram (Fig. 9b). Rather, we observed several groups of compounds follow-ing straight lines of CH2homologous series. The highest rel-ative abundance corresponded to a fully saturated formula (C12H26O4S), which is likely an organosulfate species. The higher relative abundance molecular formulas were found
Relative Abundance ≥ 10 0 2 4 8 6
Figure 9. CHOS group species isoabundance van Krevelen diagram for 9/24 (a) and 9/25 (b) with all detected individual ions shown as
dots to facilitate visualization of CH2homologous series. Also shown are the double bond equivalents vs. the number of carbon atoms of the
9/24 (c) and 9/25 (d) for the CHOS group with symbol colour representing the relative abundance.
around the elemental ratios of O / C = 0.25 and H / C = 1.6, indicating a low degree of oxygenation and a high degree of saturation. Much lower DBE and DBE / C values than those observed for CHO and CHNO compounds were consistent with the higher saturation of CHOS species (Fig. 9d and Ta-ble 2). Molecular assignments with the highest relative abun-dance had a DBE of 0 and several species with high relative abundance were clustered around DBE values of 4 and 5. Figure S11 shows that the highest relative abundance species had four oxygen atoms and the relative abundance gradu-ally decreased towards the maximum oxygen content of 13 oxygen atoms. The frequency distribution of the number of CHOS molecular assignments was similar to the oxygen con-tent with a slight shift where the majority of species were found in O5S and O6S subclasses (N = 48 and 52).
Low DBE values and high O / S ratios indicate the pres-ence of organosulfates similar to previous findings in samples of aerosol (Mazzoleni et al., 2012) and cloud water (Zhao et al., 2013). Consistent with Zhao et al. (2013), CHOS species were not narrowly distributed in the van Krevelen diagram (Fig. 9a–b) as observed for CHO (Fig. 7a–b) and CHNO (Fig. 8a–b). Similar to the previous study of Schmitt-Kopplin et al. (2010), we noted the presence of several groups of CHOS species in the regions of the van Krevelen diagram attributed to fatty acids, oxidized terpenoids, and aromatic acids from lignins. Those studies also found a group of CHOS species with low saturation and O / C ratio that was attributed to aromatic moieties, which we did not observe here. The presence of organosulfates in fog water was
con-firmed by tandem mass spectrometry (MS / MS) analysis (LeClair et al., 2012). Lin et al. (2012a) identified CHOS species in biomass burning aerosol with similar DBE values and higher O / C ratios compared to this study and attributed them to HULIS. Another study detected HULIS organosul-fates (Lin et al., 2012b) and noted very few CHOS species in regional background aerosol collected at a mountaintop site. The lack of CHOS species was attributed to biomass burning and anthropogenic aerosol that were not sufficiently acidic to catalyze formation of organosulfates. We found a similar low number of CHOS species in WSOM collected at PMO. Similarly, Schmitt-Kopplin et al. (2010) observed a lower number frequency of CHOS compounds than CHO and CHNO in biomass burning aerosol. Conversely, our find-ing of a low number of sulfur-containfind-ing species in long-range transported aerosol is in contrast to a recent study of urban aerosol in Los Angeles and Shanghai, which was dom-inated by organosulfates (Tao et al., 2014).
Oceanic marine algae produce dimethylsulfoniopropi-onate (DMSP), which is degraded by marine bacteria to dimethylsulfide (DMS). Once DMS is in the atmosphere, it is rapidly oxidized to aerosol sulfate via methanesulfonic acid and sulfur dioxide (Yoch, 2002). It is well documented that organosulfates can originate from the oxidation of marine biomass (O’Dowd et al., 1997; Rinaldi et al., 2010; Fu et al., 2011; Schmale et al., 2013). Non-sea-salt sulfate species in marine aerosol have previously been found and attributed to the degradation of marine primary emissions (e.g., Cavalli et al., 2004). Furthermore, the degradation products of marine
Figure 10. Mass spectra of 9/24 (a) and 9/25 (c) with common ions detected in both samples and ions unique for each sample. Pie charts
indicate number fraction of common and unique molecular assignments detected in 9/24 (b) and 9/25 (d); the exact numbers of common and unique assignment are given. Bottom panels: Comparison of common and unique ions detected in PMO samples in Kendrick plot (e), van Krevelen diagram (f), and double bond equivalents vs. the number of carbon atoms (g).
flora such as methanesulfonic acid have been shown to peak in summer months and produce aliphatic organic species with low oxygenation (Cavalli et al., 2004; Ovadnevaite et al., 2014). Nevertheless, reports of molecular-level specia-tion of organosulfates in marine aerosol are sparse. Recently, Claeys et al. (2010) determined that the members of the C8H16(CH2)1−5O6S homologous series are the organosul-fate markers of marine SOA formed from the oxidation and sulfation of algal and bacterial fatty acids residue. We iden-tified in 9/25 all of those molecular species except one (C9H18O6S). Moreover, the O6S class was the most abundant class in the 9/25 CHOS group and had the longest CHOS homologous series (C7H14(CH2)1,3−17O6S), consistent with Claeys et al. (2010). Many other CHOS group homologous series were observed in 9/25 with long carbon chains (up to C32)and high oxygen content (up to O13), consistent with the oxidation and sulfonation of primary marine biomass and subsequent additional processing during oxidative ag-ing. Recent study of aerosol collected on a research vessel in the North Atlantic Ocean detected 246 CHOS species in aged marine aerosol, a number of CHOS species compara-ble to our study (Wozniak et al., 2014; “Aged marine” PCA group from their study is given in Table 3). Consistent with Claeys et al. (2010), Wozniak et al. (2014) attributed the ob-served CHOS species to organosulfate markers of marine aerosol degradation albeit with longer carbon chains. The CHOS species reported in Wozniak et al. (2014) have similar chemical characteristics to those reported here (magnitude-weighted average O / C = 0.36 and H / C = 1.57).
3.3.5 Comparison of the Pico Mountain Observatory aerosol samples
Overall, the molecular formulas assigned to 9/24 and 9/25 were quite similar. A total of 3426 molecular formulas were common to both of the samples (“common” molecular for-mulas), and they spanned the entire m/z range (Fig. 10a–d). Molecular formulas detected in only one sample (“unique” molecular formulas) were fewer in number (N = 541 and 1372 for 9/24 and 9/25). Most of the unique molecular formulas had low relative abundances. The highest rela-tive abundance species in 9/24 were found in the range of
m/z450–700, while for 9/25 this range was 250–400. Sim-ilarly, the Kendrick plot analysis showed the unique assign-ments in 9/24 had homologous series preferentially extend-ing to lower masses and those in 9/25 tended to form homol-ogous series extending to higher masses (Fig. 10e).
The two WSOM samples were characterized by similar but not identical bulk properties. The average O / C ratio of 9/24 was slightly higher than 9/25 (0.46 vs. 0.42), indicat-ing more oxygenation. In our previous study of a case similar to 9/24 that included substantial plume lofting to the mid-dle free troposphere (Zhang et al., 2014), coupled GEOS-Chem and FLEXPART simulations suggested that similar transport patterns are capable of carrying more PAN in pol-luted plumes than non-lifted transport. The additional PAN is thus able to thermally decompose, resulting in a signifi-cant NOx release and subsequent ozone production during
plume subsidence. This mechanism may have provided a sec-ond opportunity for efficient oxidation of the 9/24 aerosol. In
contrast, NOxand ozone production potential would quickly
diminish in the marine boundary layer as shown by Zhang et al. (2014). In addition, air masses that transported the aerosol collected in 9/25 underwent longer transport times at sub-stantially lower altitudes in cleaner marine atmosphere (the averaged residence time spent over the North Atlantic Ocean for the retroplumes of 9/25 was 9.5 days vs. 7 days for 9/24). Processing of compounds found in primary marine emissions which did not influence 9/24 air masses would also explain the higher number of unique molecular assignments found in 9/25.
The average H / C ratio of 9/24 was slightly lower than that of 9/25 (1.17 vs. 1.28), indicating a lower saturation. The van Krevelen diagram in Fig. 10f that compares the two samples shows that 9/24 molecular assignments had higher oxygenation (i.e., higher O / C) and lower saturation (i.e., lower H / C). A lower degree of saturation in 9/24 is also supported by the higher DBE and DBE / C values (Tables 2 and 3). The same trend in elemental ratios was observed for the CHO, CHNO, and CHOS group species. The exception to this was the higher H / C ratio of the CHOS group on 9/24, which might be due to the very low number of CHOS assignments. Approximately 70 % of the molecular assign-ments in both samples were CHO species, and nearly all of the remaining compounds were CHNO species. Thus, the overall elemental ratio characteristics will be strongly driven by species belonging to these two groups. Note molecular formulas unique to 9/25 were located in the regions of the van Krevelen diagram (Fig. 10f) assigned to fatty acids (Schmitt-Kopplin et al., 2010) consistent with more abundant marine aerosol. An enhancement of several common ions in the range of m/z 200–300 was observed in 9/25 (Fig. 10c). These strong CHO and one CHOS ions have the follow-ing molecular formulas: C11H10O4, C10H10(CH2)1−2O4, C12H20(CH2)1−2O2, C12H20O3, C11H18(CH2)1−2O4, C12H18(CH2)1−3O4, C12H18(CH2)1−2O4, and C12H26O4S. With lower oxygenation and higher saturation than other CHO compounds detected in this study (their average values ± standard deviation were O / C = 0.30 ± 0.08, H / C = 1.49 ± 0.26, DBE = 4.15 ± 1.34, and DBE / C = 0.33 ± 0.14), the enhancement of these species in 9/25 over 9/24 might be an additional indication of species such as fatty acids and thus marine aerosol contribution to 9/25.
The average DBE values (and DBE / C in the parenthesis) of 9/24 and 9/25 were 10.7 (0.47) and 9.4 (0.42) (Fig. 10g), and these values were similar to the average DBE found in the CHO and CHNO groups (Tables 2 and 3). Much lower values were found for the CHOS group, consistent with a higher saturation of these species as noted previously. Fig-ure 10g clearly showed that the unique molecular assign-ments detected in 9/24 had higher DBE values, while those detected during 9/25 had a uniform distribution among all of the observed DBE values.
4 Conclusions
Our findings confirm the dominance of OA in the total aerosol mass fraction of remote atmospheres, followed by sulfate and nitrate aerosol. The molecular characterization of long-range transported aerosol provides novel insights on the aerosol properties in remote regions and at high-altitude ob-servatories. The subtle differences in the composition of the two samples were attributed to the sampling of somewhat different air masses. The FLEXPART simulations indicated that air masses intercepted during the measurements of 9/24 and 9/25 had average plume ages of 12.4 and 14.7 days and were influenced by wildfires in North America. Specifically, the 9/24 air masses were influenced by an intense biomass burning plume, while 9/25 air masses were less polluted with some influence from the North Atlantic Ocean marine bound-ary layer. The air masses of 9/24 had higher transport heights than those of 9/25, which for 9/24 might have allowed for increased production of oxidants such as ozone during their subsidence. The differences in the air masses were confirmed by changes in collocated on-line measurements of ozone, non-methane hydrocarbons (ethane and propane), black car-bon mass concentration, aerosol number concentration and aerosol scattering coefficient.
Ultrahigh resolution FT-ICR MS analysis of WSOM de-tected approximately 4000 and 5000 monoisotopic molec-ular formulas in 9/24 and 9/25. The majority of identified compounds in both samples belong to CHO (∼ 70 %) and CHNO (∼ 25 %) elemental groups, while CHOS group com-pounds represented only a small number fraction. The low average O / C (∼ 0.45) and H / C (∼ 1.20) ratios indicate low oxygenation and saturation. The observed unsaturation of species may be a result of the biomass burning emissions, which include aerosol species more unsaturated than terpene SOA products. Similar low saturation of aged and photo-chemically processed aerosol, as reflected in high DBE and DBE / C values, was previously observed for biomass burn-ing influenced samples collected in Hungary durburn-ing 2005 (Schmitt-Kopplin et al., 2010, as shown in Table 3). The pres-ence of biomass burning markers was observed with higher relative abundance for 9/24, while organosulfate markers of marine aerosol were present only in the 9/25. Similarly, the presence of a higher fraction of spherical particles (possibly tar balls) and a higher fraction of heavily coated soot suggests that 9/24 was more highly influenced by biomass burning. The compounds in 9/25 attributed to fatty acids and prod-ucts of DMS oxidation support the marine origin of these WSOM.
The molecular distributions of the Pico WSOM species yield a remarkable visual uniformity in all of the graphi-cal representations, suggesting a highly aged and processed aerosol. High molecular weight species unique for this study are likely oligomers produced by mechanisms involving aqueous-phase oxidation of biomass burning species, as pre-viously observed in laboratory studies (Holmes and Petrucci,