Annales
Geophysicae
Ozone generation over the Indian Ocean during the South African
biomass-burning period: case study of October 1992.
F. G. Taupin1,2, M. Beekmann3, P. J. Br´emaud1, and T. Randriambelo1
1Laboratoire de physique de l’atmosph`ere, Universit´e de la R´eunion, 97715 Saint-Denis messag cedex 9, France 2Now at LPCE-CNRS, 45071 Orl´eans cedex 2, France
3Service d’A´eronomie du CNRS, Universit´e Pierre et Marie Curie, Paris, 75252 Paris Cedex 05, France
Received: 23 September 1999 – Revised: 19 July 2001 – Accepted: 29 August 2001
Abstract. In this study, we present an estimation of pho-tochemical ozone production during free tropospheric trans-port between the African biomass burning area and Reunion Island (Indian Ocean) by means of trajectory-chemistry model calculations. Indeed, enhanced ozone concentra-tions (80–100 ppbv) between 5 and 8 km height over Re-union Island are encountered during September–October when African biomass burning is active. The measurements performed during flight 10 of the TRACE-A campaign (Oc-tober 6, 1992) have been used to initialise the lagrangian trajectory-chemistry model and several chemical forward tra-jectories, which reach the area of Reunion Island some days later, are calculated. We show that the ozone burden already present in the middle and upper troposphere over South-ern Africa, formed from biomass burning emissions, is fur-ther enhanced by photochemical production over the Indian Ocean at the rate of 2.5-3 ppbv/day. The paper presents sensi-tivity studies of how these photochemical ozone production rates depend on initial conditions. The rates are also com-pared to those obtained by other studies over the Atlantic Ocean. The importance of our results for the regional ozone budget over the Indian Ocean is briefly discussed.
Key words. Atmospheric composition and structure (evolu-tion of the atmosphere; troposphere – composi(evolu-tion and chem-istry); meterorology and atmospheric dynamics (tropical me-teorology)
1 Introduction
Photochemical ozone production, from biomass burning emissions over Africa during the September–November pe-riod, affects large parts of the Southern tropical Indian Ocean as can be seen in TOMS/SBUV daily tropospheric ozone maps (Fishman et al., 1996a). Also, ozone concentrations that we currently measure over Reunion Island during the biomass burning season are about 80–100 ppbv at 5–8 km Correspondence to:F. G. Taupin ([email protected])
height while the background concentrations are about 50– 60 ppbv (Taupin et al., 1999). Backtrajectory analyses from locations of enhanced ozone concentrations have shown an origin over southeastern Africa and Madagascar (Baldy et al., 1996; Diab et al., 1996). The forward trajectory analy-ses of Thompson et al. (1996) from fire locations in southern Africa showed that Reunion Island was within the sphere of influence of southern African biomass burning products. For the period of the TRACE-A campaign (September-October 1992), Garstang et al. (1996) have shown that, south of 18◦S, the easterly transport mode out to the Indian Ocean
comprised 90% of the transport pathways compared with only 4% out to the west. More recently, Randriambelo et al. (2000) presented a detailed climatological investigation of 7 years (1992–1999) of 2-monthly PTU-O3radiosondes.
The ozone contamination from biomass burning was shown to be maximum over Reunion Island during October. How-ever, it is not clear (Baldy et al., 1996) whether the ozone build-up is confined to a region near emission sources, with subsequent transport to Reunion Island (Cook-then-Mix), or whether photochemical ozone production is still active over the Indian Ocean (Mix-then-Cook). Therefore, in the present study, we wish to perform trajectory-chemistry modelling in order:
1. to explain the possible photochemical origin of ozone enriched layers observed at Reunion Island and 2. to test, respectively, the validity of the Mix-then-Cook
or Cook-then-Mix hypotheses.
How-10 20 30 40 50 60 70
jan feb mar apr may jun jul aug sep oct nov dec
Month
T
rop
o
s
p
h
e
ri
c
o
zone
c
on
te
nt
(
D
.U
.)
Fig. 1. Seasonal variation of monthly averaged integrated ozone
content (thick line) between the ground and the tropopause. The standard deviation calculated from all the 73 profiles is also repre-sented as dashed lines.
ever, the presence of biomass burning is not sufficient to gen-erate the ozone maximum observed far away from the trace gas source; relatively small scale convective processes oc-curring on each continent collectively become a necessary contributor to the large-scale observed ozone enhancement (Fishman et al., 1996b).
In this paper, we present a case study of the quantification of the ozone generation during the free tropospheric trans-port between the African biomass burning area and the In-dian Ocean, in order to further explain enhanced ozone data observed at Reunion Island which are presented in Sect. 2.1. The simulations have been conducted by using a simple trajectory-chemistry model that we initialise with airborne trace gas measurements made during the TRACE-A exper-iment conducted in October 1992 over Africa (Fishman et al., 1996b) and presented in Sect. 2.2. The meteorological context of the case study is outlined briefly in Sect. 3. The model is described in Sect. 4. In Sect. 5, the net ozone pro-duction between Africa and Reunion Island is calculated and compared to results from other studies. The relevance of the results obtained for larger scale ozone formation from biomass burning and its transport over the Indian Ocean is then discussed.
2 Experimental data and eastward transport from the African continent
2.1 Tropospheric ozone above Reunion Island
The monthly average from 1992 to 1997 of the seasonal vari-ation of column-integrated tropospheric ozone is presented in Fig. 1 (Taupin, 1998; Taupin et al., 1999). The high am-plitude of the seasonal variation (25 DU; one Dobson unit equals 2.6∗1016molecules/cm2) is due primarily to the high
peak (55DU) appearing in October. Several significant influ-ences on ozone concentration above the south-western Indian Ocean have been highlighted and qualitatively demonstrated,
0 20 40 60 80 100 120 140
2 4 6 8 10 12 14 16 18
Ozone (ppbv)
Height (km)
August September October November December
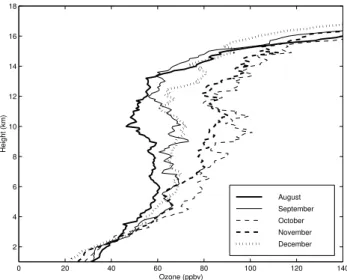
Fig. 2. Mean monthly tropospheric ozone profiles obtained by
ra-diosondes at Reunion Island from August to December (Randri-ambelo et al., 2000).
namely transport from the stratosphere (Baray et al., 1998), and photochemical formation from biomass burning emis-sions (Taupin et al., 1999; Randriambelo et al., 2000). In the study of Randriambelo et al. (2000), recent stratospheric in-trusions have been eliminated from the ozone climatology using an identification method based on considerations of ozone, humidity, vertical stability and meteorological con-ditions. Figure 2, extracted from Randriambelo et al. (2000), presents averaged monthly tropospheric ozone profiles ob-tained by radiosondes at Reunion from August to December 1992 to 1998; these are considered to be representative from the biomass burning source. It clearly shows a maximum of ozone appearing in October that can be explained by the presence of intense fires and of deep convective clouds both in the south-eastern African continent and Madagascar.
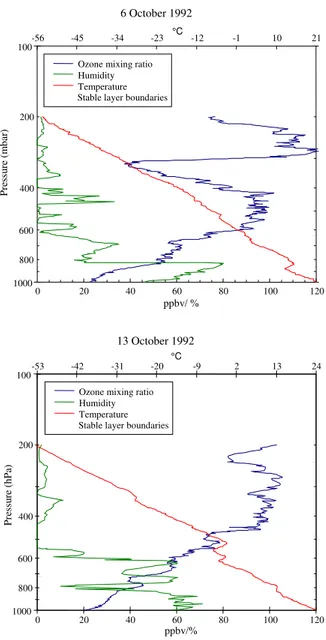
In this study, we will focus on the ozone measurements performed at Reunion Island during the same period as three flights of the TRACE-A campaign on the African continent. Indeed, the large number of species measured during this campaign can provide a unique opportunity to best constrain the initial conditions for modelling the ozone formation dur-ing transport from the African continent to the Indian Ocean. Two Reunion Island measurement dates are concerned, the 6 and 13 October 1992. The Fig. 3 presents the vertical pro-files of relative humidity, temperature and ozone mixing ra-tio recorded from the surface to 12 km (1000 to 150 hPa) for these two dates.
100
1000
0 20 40 60 80 100 120
ppbv/%
Pr
essu
re
(
h
Pa
)
-53 -42 -31 -20 -9 2 13 24
Ozone mixing ratio Humidity Temperature
°C
800 600 400 200
Stable layer boundaries
0 20 40 60 80 100 120
ppbv/ %
P
res
su
re
(
m
b
ar)
-56 -45 -34 -23 °C -12 -1 10 21
100
1000 800 600 400 200
Ozone mixing ratio Humidity Temperature Stable layer boundaries
6 October 1992
13 October 1992
Fig. 3. Altitude profiles of temperature, relative humidity, and
ozone mixing ratio measured at Reunion Island for two dates: 6 Oc-tober(a), and 13 October(b), 1992.
each case study differentiates by the number of stable lay-ers. Concerning the 6 October profiles, one large contam-inated layer can be visualized from 680 to 320 hPa. This corresponds to a large ozone enhancement (35 ppbv) which mixing ratio increases up to 95 ppbv. The 13 October 1992 temperature profile is characterized by at least four inversions from 600 to 340 hPa. An ozone enhancement corresponds to each inversion, the larger mixing ratio observed (95 ppbv) is localized from 450 to 340 hPa. Another ozone enhancement is identified above 300 hPa that reaches 100 and 120 ppbv on the 13 and 6 October 1992, respectively. When regarding at ozone concentration (molec/cm3), the layer localized
be-tween 600 and 400 hPa on 6 October 1992, and from 500 hPa to 300 hPa on 13 October 1992 constitutes the ozone maxi-mum for each profile.
AFRICA
MADAGASCAR
Réunion
6.10.1992
21°S, 55°E 500 hPa
400 hPa
300 hPa 300 hPa
400 hPa
500 hPa AFRICA
MADAGASCAR
Réunion
6.10.1992
21°S, 55°E 800 hPa
700 hPa
600 hPa 600 hPa
700 hPa
800 hPa
Five-days back-trajectories calculated from Reunion Island on 6 October 1992 Five-days back-trajectories calculated from Reunion Island on 6 October 1992
a)
b)
Fig. 4. Five-days backward trajectories ending over Reunion
Is-land the 6 October 1993 for 6 pressure levels.(a)800 hPa, 700 hPa, and 600 hPa. (b)500 hPa, 400 hPa, and 300 hPa. The representa-tion is two 2D projecrepresenta-tions: longitude-latitude in the lower panel, longitude-pressure in the upper panel.
AFRIQUE
MADAGASCAR
Réunion
13.10.1992
21°S, 55°E 500 hPa
400 hPa
300 hPa 300 hPa
400 hPa
500 hPa AFRIQUE
MADAGASCAR
Réunion
13.10.1992
21°S, 55°E 800 hPa
700 hPa
600 hPa 600 hPa
700 hPa
800 hPa
Five days back-trajectories calculated from Reunion Island on 13 October 1992 Five days back-trajectories calculated from Reunion Island on 13 October 1992
a)
b)
Fig. 5.The same as Fig. 4, but for 13 October 1992.
that a recirculation occurs in the Indian Ocean due to the descending branch of the walker cell. This recirculation al-lows contamination of the Reunion Island lower troposphere with biomass burning product just above the trade-inversion. One can note the particular 500 hPa back-trajectories calcu-lated for 13 October 1992. Two remarkable points are to be noted concerning this particular case; the southerly origin of the air mass and the strong subsidence during transport (50 hPa/day). This trajectory corresponds to a thin layer of ozone enhancement on the ozone profile (Fig. 3) and dry air on the relative humidity profile. These features constitute similarities between this trajectory case and those already shown by Baray et al. (1998) and described as stratospheric air intrusions. A tracer study, using potential vorticity, would allow in to classify this ozone enhancement as stratospheric in origin.
Unfortunately, no TRACE-A measurements were avail-able for the days of air mass departure from the African con-tinent. Therefore, the aim of the present study is somewhat limited in the sense that it tends to make a link between the chemical evolution of biomass burning emissions and gen-eral features in ozone observations above Reunion Island. However, as previously noted, using the data obtained dur-ing this campaign provides a unique constraint on the initial
a) 308 mbar b) 360 mbar
c) 426 mbar
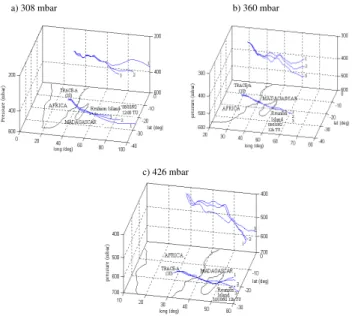
Fig. 6. Forward trajectories calculated from flight 10 of the
TRACE-A campaign. The time resolution of computation is 10 min, and use E. C. M. W. F. data. (a)308 hPa,(b)360 hPa,(c)426 hPa. The graph is 3-Dimensionnal: x-axis is latitude, y-axis is longitude, and z-axis is pressure. Two projections of the trajectories have been represented: longitude-pressure and latitude-longitude.
conditions for modelling the ozone formation during trans-port from the African continent to the Indian Ocean. Con-sequently, the modelling study will be performed from the TRACE-A campaign toward the Indian Ocean. We will also quantify the ozone production that occurs during the upper tropospheric transport of contaminated air masses and tenta-tively explain the role of biomass burning in the ozone en-hancements observed above Reunion Island.
2.2 TRACE-A data
0 200 400 600 800 CO (ppbv) A ltitude ( k m )
1670 1690 1710 1730 1750 1770 CH4(ppbv)
CO CH4
0 100 200 300 400 NO-NO2(pptv) A ltitude ( k m ) NO2 NO
2 3 4 5 6
C2Cl4(pptv) A ltitude ( k m )
600 700 800 900 CH3Cl (pptv)
C2Cl4
CH3Cl
1 2 3 4 5
C2H2/CO (Pptv/Ppbv) A ltitude ( m )
0 0,05 0,1 0,15 C3H8/C2H6(pptv/pptv) C2H2/CO C3H8/C2H6 10 9 8 7 6 5 4 3 2 1 Ppbv,% A ltitude ( k m )
-40 -20 0 20
Degrees
Ozone Temperature
0 20 40 60 80 100 Rel. humidity 10 9 8 7 6 5 4 3 2 1 10 9 8 7 6 5 4 3 2 1 10 9 8 7 6 5 4 3 2 1 10 9 8 7 6 5 4 3 2 1
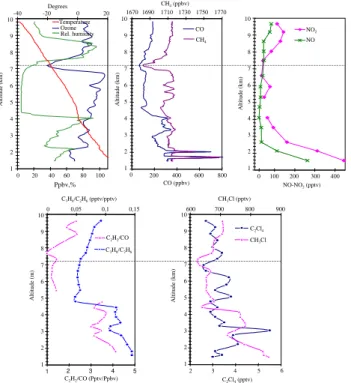
Fig. 7. Chemical data measured during the flight 10 of TRACE-A
campaign over a biomass-burning region of Southern Africa. The layer corresponding to the pressure levels 308 hPa and 360 hPa has been delimited (7–10 km).
Table 1. Trace gas concentrations measured in the layer
corre-sponding to the pressure level 426 hPa and used for the initialisation of the trajectory-chemistry model in this case
Component Measured Values
Ozone (ppbv) 78–81
NOx(pptv) 115–122
CO (ppbv) 128–140
CH3Cl (pptv) 674
C2Cl4(pptv) 4,1
C3H8/C2H6(pptv/pptv) 0,07 C2H2/CO (pptv/ppbv) 1,4
Ethene (pptv) 5
Ethane (pptv) 790
HNO3(pptv) 1400
From this study forward trajectories have been selected which indeed pass in the free troposphere over Reunion Is-land some days later (Fig. 6). These trajectories will be used to study the evolution of ozone and its precursors dur-ing transport in the free troposphere over the Indian Ocean. The first two trajectories correspond to the second descent of flight 10; they have been extracted from an upper tropo-spheric layer ranging from 7 to 9 km and are located at 11◦S, 29E, centred in the vertical around 308 hPa and 360 hPa, re-spectively. The third trajectory corresponds to a longer hori-zontal flight leg of the aircraft at 426 hPa, near 15◦S, 28◦E.
The measurements obtained during the second descent of
a) 308 mbar b) 360 mbar
c) 426 mbar
Fig. 8.Same as Fig. 6, but backward instead of forward trajectories.
flight 10 are presented in Fig. 7; the chemical characteristics of the layer centred on the 426 hPa pressure level are shown in Table 1. The ratios C3H8/C2H6and C2H2/CO have been
calculated from the measurements, in order to roughly esti-mate the age of the air mass relative to a contamination by a pollution event, following a method developed by (Gregory et al., 1996) (relative chemical age).
The relative chemical age of the layers at 308 and 360 hPa is estimated to be 3–5 days (Fig. 7). The layer containing the pressure level 426 hPa has aged by more than 5 days (Ta-ble 1). More recent contact with emissions by layers at 308 and 360 hPa also tends to be confirmed by the abundance of ethylene, a short lifetime hydrocarbon whose mixing ratios are equal to 20 pptv at 308 and 360 pptv against 5 pptv at 426 hPa in the third layer. Measured mixing ratios of CH3Cl
(Fig. 7), a specific tracer for biomass burning (Gregory et al., 1996), show a sensitive increase (from 600 to 670–700 pptv) in all three layers studied as compared to the altitude range located just below (4–6 km), suggesting biomass burn-ing as the origin of the contamination. On the contrary, the mixing ratios of C2Cl4, a tracer for urban pollution, are
al-ways low. Finally, the large relative humidity values recorded from 400 to 300 hPa tend to favour recent contamination by a convective event, that could explain a biomass burning con-tamination in the upper troposphere.
10°E 20°E 30°E 40°E
0°
10°S
20°S
30°S
50°E
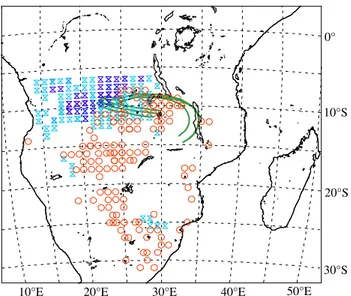
Fig. 9. Map of the southwestern Indian Ocean region, showing
TOVS (http://eosdata.gsfc.nasa.gov) cloud top height and precipi-tations values extracted for the 4 and 5 October 1992. The loca-tions where the cloud top height is higher than 320 mbar, and pre-cipitations larger than 7 mm/day are shown in light blue, locations with cloud top height above 320 hPa and precipitations larger than 15 mmm/days are dark-blue drawn. The locations of intense fires have been added for the 3–4 October period with red circles. The back trajectories cluster, calculated from TRACE-A measurement locations at 308 hPa the 6 October 1992, and described in Fig. 6 is also shown.
This region has also been identified as a strong to deep con-vection zone (cloud top height from 7–10 km to tropopause) by Thompson et al. (1996) and well schematised by Jacob et al. (1996) using the Walker circulation. Also the air mass at 360 hPa (Fig. 8b) originates over the eastern coast of the African continent.
Thus, from all these arguments (trace gas ratios, biomass burning tracers, fire and convection locations, trajectories), a contamination of the layers at 308 and 360 hPa with African biomass burning emissions seems very probable.
On the contrary, the back trajectory for the third layer (426 hPa, Fig. 5c) indicates an origin of the air mass over the Atlantic Ocean, without contamination during the last five days, that agrees well with a 5 to 6 day relative chem-ical age. The ozone mixing-ratio is larger than 75 ppbv in all layers; thus significant ozone build-up has already occurred between the time of emission and measurement. However, as Noxmixing ratios mostly exceed 100 pptv and the CO
mix-ing ratios exceed 100 ppbv, further net photochemical ozone formation may be expected to occur over the Indian Ocean.
3 Meteorological context of the TRACE-A period
Figure 10 shows the ECMWF analysed wind fields at 1000 and 500 hPa for 6 October 1992, the first day of our trajectory-chemistry study. At the 1000 hPa level, winds
a) MAP OF WIND SPEED ON 6.10.1992 AT 12H PRESS=1000 MB
0 10 E 20 E 30 E 40 E 50 E 60 E 20 S
30 S
30 m/s
MAXIMUM VECTOR
b) MAP OF WIND SPEED ON 6.10.1992 AT 12H PRESS=500 MB
20 S
30 S
0 10 E 20 E 30 E 40 E 50 E 60 E
60 m/s
MAXIMUM VECTOR
Fig. 10.Meteorological context of the TRACE-A campaign.
Hori-zontal wind on isobaric surfaces on 6 October 1992, at 12:00 T. U., from ECMWF data. a) Surface, b) 500 hPa.
are weak and variable over Southern Africa north of 20◦S.
South of 20◦S, winds over Southern Africa are confluent and
deviated to a southerly direction. The mid-troposphere at 500 mbar (approximately 5.5 km, Fig. 10b) is characterised by the predominance of the westerly flow over the Indian Ocean. At upper levels (200 hPa, not shown), we note a pre-vailing zonal flow from West to East in the whole region. The circulation patterns observed on 6 October 1992 are gen-erally representative of the whole TRACE-A period (from 21 September to 27 October 1992) (Bachmeier et al., 1996). This allows us to consider the particular period studied here as rather typical for free tropospheric long-range transport of biomass burning emissions and products.
4 Model description
studies in the boundary layer (Lattuati, 1997). The free tro-pospheric model consists of three parts:
1. the calculation of air mass trajectories,
2. the chemical initialisation of the air parcel, and 3. the calculation of the chemical evolution of the species. The advantages of the use of a lagrangian model in this study are its simple set-up and the fact that individual air parcels can be studied. This makes the model initialisation straight-forward and allows a more direct interpretation of the results as compared to a 3D eulerian model study.
The air mass trajectories used by the lagrangian model are those previously used (Fig. 3) to demonstrate the free tropo-spheric transport of air masses between the African biomass burning zones and Reunion Island. The gas phase chemical reaction scheme used in the chemistry module describes the chemical behaviour of 77 gaseous species, through about 150 reactions (Lattuati, 1997). This scheme has been extended and updated from an original continental boundary layer chemistry scheme (Hov, 1985). The hydrocarbon degrada-tion scheme is very similar to the EMEP gas phase chemical mechanism (Simpson, 1992) and is a priori adapted as for biomass burning as well for industrial or traffic emissions. Six hydrocarbon species (ethane, butane, ethene, propene, isoprene and o-xylene) represent alkane, alkene, ketones and aromatic compounds. Their oxidation by OH, O3and NO3
yields eleven oxygenated compounds, including formalde-hyde and higher aldeformalde-hydes, ketones, bicarbonyls, unsaturated carbonyls and alcohols. Adaptations have been made to al-low the simulation of free tropospheric conditions. In par-ticular, pernitrates (HNO4, CH3NO4) have been added and
the pressure dependence of three body reactions has been in-cluded (Troe reactions). RO2and RO2recombination
reac-tions, which may be important for the degradation of VOC emissions in low NOx environment, have also been
explic-itly taken into account. All rate constants have been updated from Atkinson (1994).
Photolysis frequencies J are calculated using a simple re-lationship with the zenith angleζ(J = A.exp(-B/cosζ)). A and B factors are taken from a look-up table which has been previously set-up for different altitudes, total ozone columns and cloud cover scenarios (Flatoy et al., 1996) by using the radiative transfer model of Jonson and Isaksen (1993). For this study, a total ozone column of 297 DU is used consis-tent with measurements from TOMS data and ozone sound-ing performed at Reunion Island (Taupin, 1998). Cloud free conditions are assumed to prevail during this study, which has been shown from satellite pictures (Fuelberg et al., 1996; Bachmeier et al., 1996).
The air mass trajectories are chemically initialised with aircraft measurements (see also Sect. 3). Measured VOC’s, not represented in the gas phase mechanism are replaced by one of the six hydrocarbons and 11 oxygenated hydrocarbons included in the code with the most similar structure and reac-tivity. In particular, acetone and acetylene measured during
96 94 92 90 88 86 84 82 80 78
12 24 36 48 60 72 84 96 108 120 Time since 6 October 1992 00:00 local time
Ozon
e m
ixi
n
g
r
ati
o (ppb
v)
308 hPa
360 hPa 426 hPa
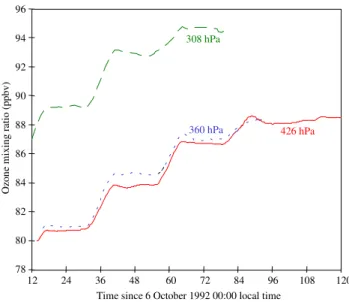
Fig. 11.Ozone generation simulated for 6–10 October 1992, during
transport from TRACE-A flight position to Reunion Island.
the TRACE-A campaign are represented by ethane and the propane has been replaced by n-butane. The aromatic com-pounds chemistry (here benzene and toluene) has been rep-resented by the o-xylene chemical scheme. Mass weighting and a reactivity-weighting factor following the procedure of Middleton et al. (1990) is applied. Nevertheless, in Sect. 4.2, it will be shown that the exact knowledge of the NMHC dis-tribution is not critical for the calculation of net ozone pro-duction rates.
5 Results and discussion
NOx evolution 50 70 90 110 130 150 170 190
12 24 36 48 60 72 84 96 108 120 132
time since 6 October 1992, 00:00 local time.
30 8 a nd 3 60 h P a (pptv ) 0 20 40 60 80 100 120 140 426 hP a (p pt v ) 360 hPa 426 hPa 308 hPa
Carbon monoxide evolution
130 135 140 145 150 155 160 165 170 175
12 24 36 48 60 72 84 96 108 120 132
time since 6 October 1992, 00:00 local time.
30 8 a nd 3 60 h P a (p pb v) 110 115 120 125 130 135 140 426 hP a (p bt v ) 308 hPa 426 hPa 360 hPa
Nitric acid evolution
750 800 850 900 950
12 24 36 48 60 72 84 96 108 120 132
time since 6 October 1992, 00:00 local time.
30 8 h P a (p pbv ) 1150 1200 1250 1300 1350 1400 1450 1500 360 an d 42 6 hP a (pbt v) 426 hPa 308 hPa 360 hPa PAN evolution 900 950 1000 1050 1100
12 24 36 48 60 72 84 96 108 120 132
time since 6 October 1992, 00:00 local time.
30 8 h P a (p pbv ) 350 400 450 500 550 600 360 an d 42 6 hP a (pbt v) 360hPa 308 hPa 426 hPa
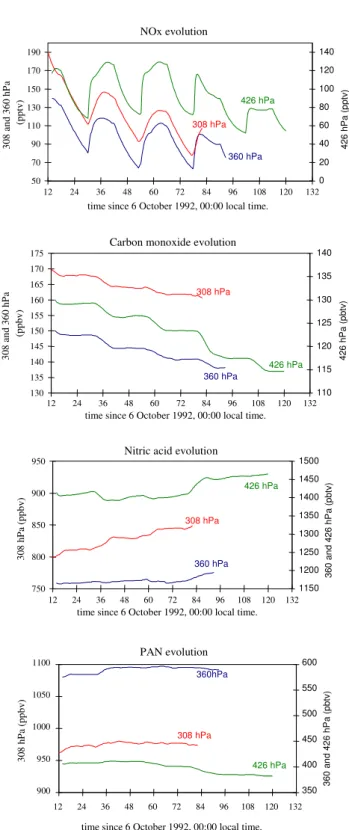
Fig. 12.As Fig. 8, but for NOx, CO, HNO3and PAN.
The evolution of the ozone mixing-ratio for each trajec-tory studied is presented in Fig. 11. The main result is that ozone production during transport to Reunion Island, at all pressure levels studied, is still significant, declining from 3– 4 ppbv/day for the first day to 1–2 ppbv/day for the subse-quent days. On the average, we obtain a net ozone produc-tion rate between 2,5 and 3 ppbv/day during transport from
the African continent to Reunion Island. This ozone pro-duction rate appears to be rather homogeneous, which is ex-plained by the fact that initial concentrations for ozone pre-cursors are comparable (140–190 pptv NOx, ∼2 ppb NOy,
150–170 ppbv CO). The sensitivity of ozone production rates with respect to initial conditions will be analysed in more de-tail in Sect. 5.2.
Also, the chemical evolution of some other important trace gases is similar for the three air masses studied (Fig. 12). NOxspecies are consumed during transport and transformed
into reservoir species HNO3 and PAN. This corresponds to
the largest ozone production on the first day of the simulation and to the lower rates on subsequent days. NOx
concentra-tions on the third day at noon are, respectively, 110, 95 and 100 pptv for the trajectories starting at 308, 360 and 426 hPa, which is still enough to support net photochemical ozone production. Conversely, reservoir species HNO3 and PAN
slightly increase during the simulation, with the exception of PAN for the trajectory at 426 hPa. The carbon monoxide net destruction varies between 3 ppbv/day and 6 ppbv/day which implies that, roughly, between half (for trajectories starting at 308 hPa and at 426 hPa) and one ozone molecule (trajectory 2) are formed per one CO molecule consumed.
We now compare the ozone production rates obtained in our study with other studies. From observations of the ozone content integrated between 1.5 and 7 km, Gregory et al. (1996) studied the effects of ageing as African air moves off the West African coast over the Atlantic Ocean. By com-paring two measured profiles separated by two days of trans-port, these authors derive a net photochemical ozone produc-tion of 6 ppbv/d during transport. Differences with our lower value may be attributed to four reasons,
1. the different region considered (South Atlantic basin vs. Indian ocean,
2. the lower height range in the Gregory et al. 1996 study (1.5–7 km compared to about 5–9 km in our study), 3. the uncertainty inherent in ozone production rates from
small differences between ozone profiles, and
4. the uncertainty in the same estimations from photo-chemical models (see discussion in Sect. 5.3).
By means of a photochemical model (Jacob et al., 1996) have conducted simulations of the instantaneous net ozone production, scaled to a diurnal average, using all measure-ments performed during the TRACE-A period. This ap-proach is similar to ours but note that our net ozone produc-tion rates are calculated by taking into account the decline of ozone precursors and in particular NOx during the days
af-ter the measurements, whereas Jacob et al. (1996) assumed the O3precursors to the constant, except NO, over the
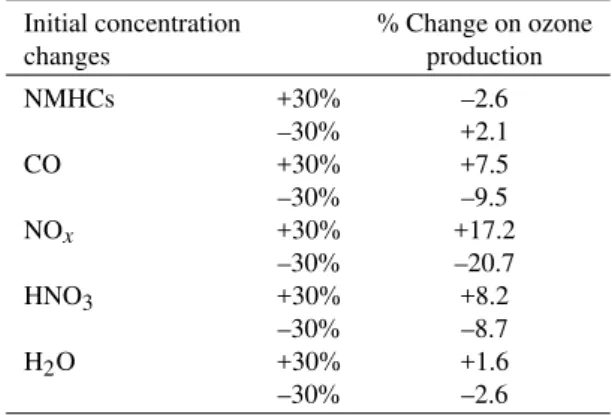
Table 2.Sensitivity of ozone production to modifications in the ini-tial concentrations of some important compounds for the chemical trajectory starting at 308 hPa. Results are presented as percentage change with respect to the net ozone production obtained in the ref-erence case
Initial concentration % Change on ozone
changes production
NMHCs +30% –2.6
–30% +2.1
CO +30% +7.5
–30% –9.5
NOx +30% +17.2
–30% –20.7
HNO3 +30% +8.2
–30% –8.7
H2O +30% +1.6
–30% –2.6
basin, that is several days of transport away from the prob-able source regions, they still estimate a net photochemical ozone production of 2.1 ppb/day in the 8–12 km range and less than 2 ppbv/day in the 4–8 km range. These values are similar to our estimations in the 5–9 km altitude range of about 2.5–3 ppbv/day on the first day (near source regions) and 1–2 ppbv/day after several days of transport. This means that photochemical ozone production over the Indian ocean is probably of the same order of magnitude of as that calcu-lated over the south Atlantic basin.
5.2 Influence of initial concentrations on ozone production In this section, we study the sensibility of net ozone produc-tion with respect to initial concentraproduc-tions of several species in order to study the chemical regime of the biomass burning plume and also to encounter the effect of the uncertainty in-herent in the initial conditions employed. For example, real NMHC’s are represented by model species sometimes with different reaction paths (for example acetylene and acetone represented by ethane). Moreover, NO2concentrations
mea-sured during the TRACE-A campaign have been estimated to be rather uncertain (Jacob et al., 1996). Finally, nitric acid measurements are sparse (2–15 min time resolution com-pared to 3 min for NO) (Jacob et al., 1996); so each measured data corresponds to a larger altitude range than considered for the initialisation of each air parcel. In order to study the sensitivity of ozone production, with respect to these com-pounds and also to other chemically important species such as CO and water vapour, we have applied a 30% variation to the initial concentrations for the trajectory at 308 hPa. The 30% value is not meant to represent the uncertainty of any of these initial concentrations; it is merely chosen to provide a common basis for the comparison of the sensitivities.
The results summarised in Table 2 indicate the strongest sensitivity of NOxinitial concentrations. Indeed, ozone
pro-duction is basically NOx limited. Also, the sensitivity of
nitric acid initial concentration is important as HNO3
pho-tolysis is an important pathway for NOx recycling. CO is
important also as it transforms OH into HO2, which reduces
removal of NOx by OH. On the other hand, water vapour
concentrations are not very sensitive; apparently the avail-ability of OH and subsequently HO2and RO2radicals from
the reaction of O(1D) with water vapour does not much ef-fect the net ozone production. Surprisingly, the sensitivity of NMHC initial concentrations is slightly negative. The rea-son for this is that, first, the largest contribution to OH to HO2conversions stems from CO and, second, an increase in
NMHC’s favours PAN formation which consumes NOx and
thus decreases ozone production.
This study suggests that the strongest uncertainty on the calculated net ozone production rate probably stems from the uncertainty in NOx measurements. Indeed, some
disagree-ments have been found between measured and simulated NO2/NO ratios (Smyth et al., 1996) that we have also
ob-served. Moreover, the determination of NO2was often at or
below the instrument’s limit of detection during the TRACE A campaign and may include contributions from HO2NO2or
N2O5(Smyth et al., 1996; Sandholm et al., 1994). Since we
have used the measured NOx values (NO + NO2), we will
consider them as an upper limit.
5.3 Larger scale relevance of the results
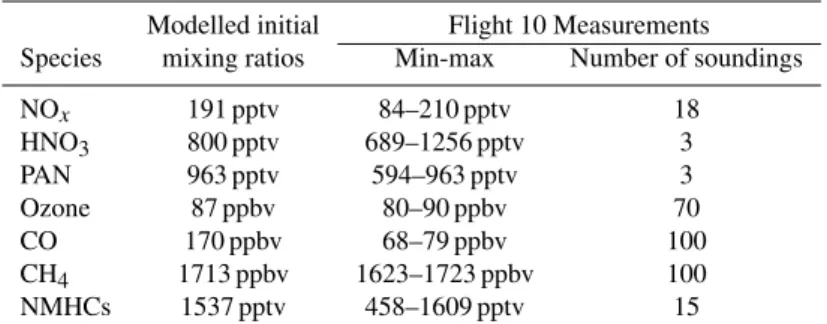
We will now briefly discuss the representativity and the larger scale importance of our results. To this purpose, and as it represents the layer with the largest ozone production among the studied cases (3 ppbv/day), we have compared the ini-tial concentrations used for the trajectory starting at 308 hPa with average mixing ratios measured during the TRACE-A flight 10 at similar altitudes. This layer around 308 hPa is one of the most polluted sampled at this altitude and during this flight (see Table 3). In addition, as previously discussed, the measured NOx concentrations have to be considered as
upper limits. Thus, our value of a 2.5–3 ppbv/day net ozone production probably represents an upper limit for more aver-age conditions over the Western Indian Ocean during Octo-ber.
Also, we may ask, what will be the chemical evolution of the air mass when transported further westward from Re-union Island, over the Indian Ocean. A longer-term sim-ulation of the layer at 308 hPa (not shown) shows that, on day 6, the NOxmixing ratio approaches its steady state
con-centration where loss reactions are balanced by a supply of fresh NOx from reservoir species HNO3 and PAN. This
corresponds to daily maximum NO concentrations of about 30 pptv, allowing no further net ozone production but pre-venting ozone loss. The maps of tropospheric ozone con-tent derived from satellite analyses presented by Fishman et al. (1996a), show that the maximum of ozone increase is reached not far eastward from Reunion Island, as predicted by our study. The satellite analysis also shows a large east-ward extension of the plume (at least to 60◦E, the limit of
Table 3.Main mixing ratios measured during flight 10 of the TRACE-A campaign around the 308 hPa pressure level, as compared with the initial mixing ratios used to initialise the same level simulation
Modelled initial Flight 10 Measurements
Species mixing ratios Min-max Number of soundings
NOx 191 pptv 84–210 pptv 18
HNO3 800 pptv 689–1256 pptv 3
PAN 963 pptv 594–963 pptv 3
Ozone 87 ppbv 80–90 ppbv 70
CO 170 ppbv 68–79 ppbv 100
CH4 1713 ppbv 1623–1723 ppbv 100
NMHCs 1537 pptv 458–1609 pptv 15
near zero photochemical ozone balance after about a week of transport and thus a very large lifetime of ozone in the upper troposphere over the Indian ocean.
At this stage of plume ageing, and in the absence of a fresh supply of NOxsources, for example, from lightning (Smyth
et al., 1996), it is the dilution or heterogeneous removal of the NOx reservoir species which will ultimately drive the
lifetime of the large ozone burden produced from biomass burning emissions and its impact on the global tropospheric ozone budget. After several days of transport, the hypoth-esis of no mixing of the air parcels made for these calcula-tions becomes more and more questionable. However some hypotheses can be driven that are linked to the walker cell circulation:
As the air subsides over the Indian Ocean (Fig. 6), net ozone loss can take place in the lower troposphere. The air masses then reach the Easterly circulation (descending branch of the walker cell) and bring residual ozone pro-duced from biomass burning emissions in Reunion Island lower troposphere, just above the trade-inversion (Fig. 3). This hypothesis can be corroborated with the presence of two ozone concentration (when converting the mixing ratio into molec/cm3) maxima located just above the zonal wind
inver-sion for the larger one, and between the trade-inverinver-sion and the zonal inversion for the second one.
In view of the current findings, one can wonder what is then the role of biomass burning on tropospheric ozone concentration over Reunion Island as compared with strato-spheric intrusion. Ozone produced from biomass burning emissions is displayed in the whole troposphere above the trade-inversion over Reunion Island from August to Decem-ber. Stratospheric intrusions occur at different altitudes over Reunion Island by way of tropopause breaks due to the westerly Jet-stream (Baray et al., 1998) during winter, and near zones of deep convection during summertime (Baray et al., 1999). These events are very strong (up to 200 ppbv of ozone) but time limited (few days); ozone decrease takes place rapidly due to low NOxmixing ratios conditions, and
to subsidence. At present, biomass burning constitutes the main source of ozone in the Mid to upper-troposphere of Re-union island.
We can also compare the contamination that occurs over
the Indian Ocean with the contamination of the South At-lantic basin. Even if the production rates of ozone in the free troposphere are comparable, the tropospheric ozone con-tent appears to be larger above Ascension Island, for exam-ple (Fishman et al., 1996). Indeed, the Atlantic basin tropo-sphere is contaminated by both the American continent and the African continent. The Indian Ocean free troposphere is primarily contaminated by the African continent and sec-ondarily by Madagascar; the lower troposphere, above the trade-inversion at Reunion Island, also appears to be contam-inated due to the recirculation of the upper troposphere air masses over the Indian Ocean due to the descending branch of the Walker cell; this does not constitute a fresh source of biomass burning products.
6 Conclusion
This paper presents a case study of ozone production over the Indian Ocean during the African biomass-burning period. To this purpose, we use a trajectory-chemistry model driven by ECMWF analyses and initialised by TRACE-A data. We show that the net upper tropospheric ozone production be-tween the Southern African East coast and Reunion Island is about 2.5–3 ppbv/day for the three trajectories studied which corresponded to the most polluted upper tropospheric layers of TRACE-A flight 10. Our result also falls in the range of values calculated by Jacob et al. (1996) from all TRACE A data between 4 and 12 km, although Jacob et al. (1996) calcu-late net ozone production rates with fixed precursor concen-trations whereas our study allows for decay of precursors. Indeed, our study has shown that a 30% difference in the initial NMHC concentrations does not sensibly change the averaged net ozone production rate. Consequently, this sen-sitivity study, with varying initial concentrations, reveals that our calculated net ozone production is most sensitive to the uncertainty in NOxconcentrations used for initialisation and
also to HNO3, supplying fresh NOx and CO, but is only a
also explain the maximum in the ozone plume observed from satellite data near Reunion Island (Fishman et al., 1996a) and its large eastward extension over the Indian Ocean. However, several factors are simultaneously needed that contribute to the ozone enhancement observed over Reunion Island: High ozone concentrations observed in the troposphere over Re-union Island are primarily due to biomass burning that occurs on the African continent and Madagascar. The intensity of the ozone peaks observed depends on the intensity of the fires and of the deep convection occurring not far from the source zones. The variability of the ozone mixing ratios with alti-tude depends on the zonal circulation, i.e. the westerlies in the free troposphere (higher than 5 km), and the presence of recirculation on the Indian Ocean with the descending branch of the walker cell.
Acknowledgement. We wish to thank Y. Pointin, and A. M. Lan-quette (LaMP, Clermont-Ferrand, France) for supplying the analysis software of ECMWF data, as well as the TRACE-A Science Team for providing access to the data obtained during the GTE TRACE-a Field Mission on a data archive (http://www-gte.larc.nasa.gov).
Topical Editor D. Murtagh thanks two referees for their help in evaluating this paper.
References
Atkinson, R.: Gas phase tropospheric chemistry of organic com-pounds, J. Phys. Chem. Ref. Data, Monograph 2, 1994. Bachmeier, A. S. and Fuelberg, H. E.: A meteorological overview
of the TRACE-A period, J. Geophys. Res., 101 (D19), 23 881– 23 888, 1996.
Baldy, S., Ancellet, G., Bessafi, M., Badr A., and Lan-Sun-Luk, J. D.: Field observations of the vertical distribution of tropospheric ozone at the island of Reunion (southern tropics), J. Geophys. Res., 101 (D19), 23 835–23 850, 1996.
Baray, J. L., Ancellet, G., Taupin, F. G., Bessafi, M., Baldy, S., and Keckhut, P.: Subtropical tropopause break as a possible strato-spheric source of ozone in the tropical troposphere, J. Atm. Sol.-Terrestr. Phys., 60 (1), 27–36, 1998.
Baray, J. L., Ancellet, G., Randriambelo T., and Baldy,S.: Tropi-cal cyclone Marlene and stratosphere-troposphere exchange, J. Geophys. Res., 104 (D11), 13 953–13 970, 1999.
Diab, R. D., Jury, M. R., Combrink, J. M., and Sokolic, F.: A comparison of anticyclone and trough influences on the verti-cal distribution of ozone and meteorologiverti-cal conditions during SAFARI-92, J. Geophys. Res., 101 (D19), 23 809–23 822, 1996. Fishman, J., Brackett, V. G., Browell E. V., and Grant, W. B.: Tropospheric ozone derived from TOMS/SBUV measurements during TRACE-A, J. Geophys. Res., 101 (D19), 24 069–24.082, 1996a.
Fishman, J., Hoell, Jr., J. M., Bendura, R. D., Mc Neal, R. J., and Kirchhoff, V. W. J. H.: NASA GTE TRACE A Experiment (September–October 1992): Overview, J. Geophys. Res., 101 (D19), 23 865–23 880, 1996b.
Flatoy, F., Hov, O., and Smit H. G. J.: Three dimensional model studies of exchange processes of ozone in the troposphere over Europe, J. Geophys. Res., 100 (D6), 11 465–11 481, 1995. Fuelberg, H. E., Loring, Jr., R. O., Watson, M. V., Sinha, M. C.,
Pickering, K. E., Thompson, A. M., Sachse, G. W., Blake, D. R.,
and Schoerberl, M. R.: TRACE A trajectory intercomparison, 2, Isentropic and kinematic methods, J. Geophys. Res., 101 (D19), 23 927–23 940, 1996.
Garstang, M., Tyson, P. D., Swap, R., Edwards, M., K˚allberg, P., and Lindesay, J. A.: Horizontal and vertical transport of air over southern Africa, J. Geophys. Res., 101 (D19), 23 721–23 736, 1996.
Gregory, G. L., Fuelberg, H. E., Longmore, S. F., Anderson, B. E., Collins, J. E., and Blake, D. R.: Chemical characteristics of tropospheric air over the tropical south Atlantic Ocean: Relation-ship to trajectory history, J. Geophys. Res., 101 (D19), 23 957– 23 972, 1996.
Hov, O., Stordal, F., and Eliassen, A.: Photochemical oxidant con-trol strategies in Europe: A 19 days case study using a lagrangian model with chemistry, NILU TR5/95, 1985.
Jacob, D. J., et al.: Origin of ozone and NOx in the tropical
troposphere: a photochemical analysis of aircraft observations over the southern Atlantic Basin, J. Geophys. Res., 101 (D19), 24 235–24 250, 1996.
Jonson, J. E. and Isaksen, I. S. A.: Tropospheric ozone chemistry. The impact of cloud chemistry, J. Atmos. Chem., 16, 99–122, 1993.
Lattuati, M.: Impact des ´emissions europeennes sur le bilan de l’ozone troposph´erique `a l’interface de l’Europe et de l’Atlantique Nord: apport de la mod´elisation lagrangienne et des mesures en altitude, Ph. D. thesis, Univ. of Paris VI, 1997. Middleton, P., Stockwell, W. R., and Carter, W. P. L.:
Aggrega-tion and analysis of volatile organic compounds emissions for regional modelling, Atmos. Envir., 24a (5), 1107–1133, 1990. Randriambelo, T., Baldy, S., Bessafi, M., and Despinoy, M.: An
im-proved detection and characterization of active fires and smoke plumes in southeastern Africa and Madagascar, Int. J. Rem. Sens., 19 (14), 2623–2638, 1998.
Randriambelo, T., Baray, J.-L., and Baldy, S.: Effect of biomass burning, convective venting, and transport on tropospheric ozone over the Indian Ocean: Reunion Island field observations, J. Geo-phys. Res., 105 (D9), 11 813–11 832, 2000.
Sandholm, S., et al.: Summertime partitioning and budget of NOy compounds in the troposphere over Alaska and Canada: ABLE 3B, J. Geophys. Res., 99, 16 841, 1837–1861, 1994
Simpson, D.: Long period modeling of photochemical oxidants in Europe. Model calculations for July 1985, Atmos. Envir., 25, 1609–1634, 1992.
Smyth, S. B., et al.: Factors influencing the upper tropospheric distribution of reactive nitrogen over South Atlantic during the TRACE-A experiment, J. Geophys. Res., 101 (D19), 24 165– 24 186, 1996.
Taupin, F. G.: Analyse et mod´elisation de la variabilit´e de l’ozone troposph´erique en zone tropicale – Influence du brˆulage de biomasse, Ph. D. thesis, Univ. of Clermont-Ferrand, 1998. Taupin F. G., Bessafi, M., Baldy, S., and Bremaud, P. J.:
Tropo-spheric ozone above southwestern Indian ocean is strongly linked to dynamical conditions prevailing in the tropics, J. Geophys. Res., 104 (D7), 8057–8066, 1999.