A STUDY OF THE FISH COMMUNITY
STRUCTURE IN A TIDAL CREEK
SPACH, H. L., SANTOS, C., GODEFROID, R. S., NARDI, M. and CUNHA, F.
Centro de Estudos do Mar, Universidade Federal do Paraná, C.P. 50002, CEP 83255-000, Pontal do Sul, PR, Brazil
Correspondence to: Henry Louis Spach, Centro de Estudos do Mar, Universidade Federal do Paraná, C.P. 50002, CEP 83255-000, Pontal do Sul, PR, Brazil, e-mail: [email protected] Received September 12, 2002 Accepted January 24, 2003 Distributed May 31, 2004
(With 5 figures)
ABSTRACT
The fish assemblage in a mangrove tidal creek was studied in monthly collections between August 1998 and July 1999 in the quadrature low tide and high tide, using a fyke net of 30 m x 1.5 m and meshes of 8 and 10 mm. Simultaneously with the biological collections, temperature, salinity, pH, water transparency, and current speed data were obtained. The collections resulted in the capture of 36,873 fish representing 22 families and 52 species. Immature individuals abounded (63.8%), and among the adult specimens there was a larger number of females. The species Anchoa parva, Harengula clupeola, Genidens genidens, and Bairdiella ronchus, contributed to 84.9% of the total capture of fish, however the contribution in mass was of 55.2%, indicating a predominance of small individu-als. A smaller number of fish and species seem to occupy the area in the period between August and December, in comparison to the period between February and July, when the larger aggregations appear, mainly of the species Anchoa parva, Harengula clupeola, Opisthonema oglinum, Genidens genidens,
Diapterus rhombeus, and Bairdiella ronchus. The environmental factors, pH, water transparency, and rainfall seem to have an influence in the structure of the observed biological patterns.
Key words: tidal creek, fishes, diversity, abundance, temporal variation.
RESUMO
Um estudo sobre a estrutura da comunidade de peixes de um rio de maré
A comunidade de peixes em um rio de maré de mangue foi estudada em coletas mensais entre agosto de 1998 e julho de 1999 na baixa-mar e preamar de quadratura, utilizando-se uma rede fixa tipo "fyke" com 30 m x 1,5 m e malhas de 8 e 10 mm. Simultaneamente às coletas biológicas, foram registrados
dados de temperatura, salinidade, pH, transparência da água e velocidade da corrente. As coletas resultaram na captura de 36.873 peixes, representando 22 famílias e 52 espécies. Predominaram indivíduos imaturos (63,8%) e as fêmeas, entre os adultos. As espécies Anchoa parva, Harengula clupeola, Genidens genidens
e Bairdiella ronchus constituíram 84,9% da captura total de peixes, no entanto, a participação em peso foi de 55,2%, indicando o predomínio de indivíduos de pequeno porte. Um menor número de peixes e espécies parece ocupar a área no período entre agosto e dezembro, comparado ao período entre fevereiro e julho, quando aparecem os maiores agregados, principalmente das espécies Anchoa parva, Harengula clupeola, Opisthonema oglinum, Genidens genidens, Diapterus rhombeus e Bairdiella ronchus. O pH, a transparência da água e a pluviosidade parecem influenciar a estruturação dos padrões biológicos obser-vados.
INTRODUCTION
In estuaries, several intertidal and subtidal environments such as salt marshes, mangroves, tidal creeks, and tidal flats, offer an abundance and great diversity of food resources, protection against pre-dation, and other favorable environmental conditions for the growth and survival of fish (Paterson & Whitfield, 2000). These conditions favor the presence of large populations of fish in these shallow aquatic environments along the margin of estuaries (Rozas & Zimmerman, 2000; Vidy, 2000).
These populations are dominated by juveniles of marine species and contain few resident species or occasional visitors. They show a wide tempo-ral variation in their species composition due to the environmental dynamics and migratory nature of most of the fish, as well as to the connection between the estuarine habitats because of their proximity and tidal flow (Rozas & Zimmerman, 2000).
The tidal creeks are courses of water that show a meandering route and a reduced self-debit, which drain the restinga formations, mangroves, and salt marshes. Their debit is strongly affected by the tide, and on a smaller scale by the wind, average water level, and coastal circulation.
In spite of the importance of these channels in the life cycle of the fish, most of the information available in the literature refers to the tide channels that connect the surface of the salt marshes with the estuarine waters of the main body (Cattrijsse et al., 1994; Desmond et al., 2000). In addition, there is little information on the ichthyofauna of mangrove tidal creeks (Robertson & Duke, 1990; Vendel, 1997; Barletta, 1999).
The general objective of this study was to identify the species and temporal variation in the abundance and composition of the fish assemblage, community attributes (D, H, J), and the influence of environmental factors in the structure of the observed biological patterns in a tidal creek located on the continental margin of the euhaline section of Paranaguá Bay, Paraná.
MATERIAL AND METHODS
Study area
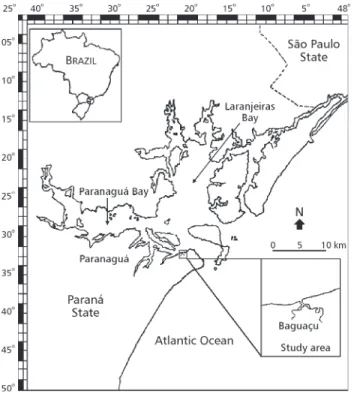
The present study was carried out in Gamboa do Baguaçu, located on the south margin of the euhaline section of Paranaguá Bay, coordinates
25o33'03"S and 48o23'05"W (Fig. 1). This channel
is divided into two sub-channels, one with an extension of approximately 1.9 km and the other of 1.0 km, and a depth varying from 0.5 to 5.0 meters. The mangrove drained by this tidal channel has about 43 ha and its vegetation is composed of Laguncularia racemosa, Rhizophora mangle, Avicenia shaweriana, with external banks of Spartina alterniflora. Its sediment is predo-minantly sandy, and to a smaller extent there are sandy-silt and silty-sand sediments. The predo-minance of sandy fractions indicates that it is high-energy area, due to its proximity to the bar that provides access to Paranaguá Bay (Sessegolo, 1997).
Sampling design
The sampling was done between August 1998 and July 1999, in the low and high quadrature (waning moon) tide, using a fyke net of 30 x 1.5 m, and a mesh of 10 mm in the wings and 8 mm in the bag. On every collection day, two fyke nets were mounted. During high tide, the nets were installed facing the estuary and blocking the lateral channel and the margin of the main channel, in order to capture fish entering the channel along with the tide. To capture fish during low tide, one net was installed against the vegetation, on the margin of the mangrove, while the other blocked the main channel facing away from the estuary. Every hour, during high and low tide, water temperature, salinity, pH, water transparency, and current speed data were obtained. The rainfall data were obtained from the meteorological station located at Centro de Estu-dos do Mar, UFPR. After identifying the fish, their weight (g), standard and total length (mm), and, whenever possible, sex and stage of gonadal maturity were obtained.
Data analysis
and group averages of the months defined by cluster analysis (normal method), the number of species, number of fish, biomass, Margalef's species richness index, Shannon-Wiener's species diversity (number and weight) index, and Pielou's evenness index (Ludwig & Reynolds, 1988). Where any assumption of ANOVA was not met, Kruskal-Wallis's non parametric statistics were used (Conover, 1990; Sokal & Rohlf, 1995).
Cluster analysis (inverse mode) and nonmetric multidimensional scaling (MDS) were used to identify the species assemblages. The 19 most abundant and frequent species (> 1% of the total capture or present in at least 6 months of collection) were grouped considering the monthly abundance data 4th root transformed. The temporal structure
of the assemblage was identified using the cluster analyses (normal mode) and nonmetric multidimen-sional scaling (MDS) with the species as attributes. The similarity between the attributes was calculated using the similarity coefficient of Bray-Curtis and the cluster-grouping method by the unweighted
pair-group mean arithmetic linking method (UPGMA) (Ludwig & Reynolds, 1988).
The analysis of similarity of percentages (SIMPER) was used to identify which species were mainly responsible for the similarities inside each group of months defined by cluster analysis and for the dissimilarities among these groups. The BIOENV routine was used to relate the observed biological patterns to the observed environmental pattern, considering the individual and combined mental parameters. This routine selects environ-mental variables best explaining community pattern, by maximizing a rank correlation (Spearman coef-ficient) between biotic and abiotic similarity matrices (Clarke & Warwick, 1994).
The analyses were made with the statistical programs Statistica, version 5.1 (Statsoft Corp., United States), and PRIMER, version 4.0 (Plymouth Marine Laboratory, England). The seasons of the year were defined as follows: September to November = spring; December to February = summer; March to May = autumn; and June to August = winter.
RESULTS
Environmental parameters
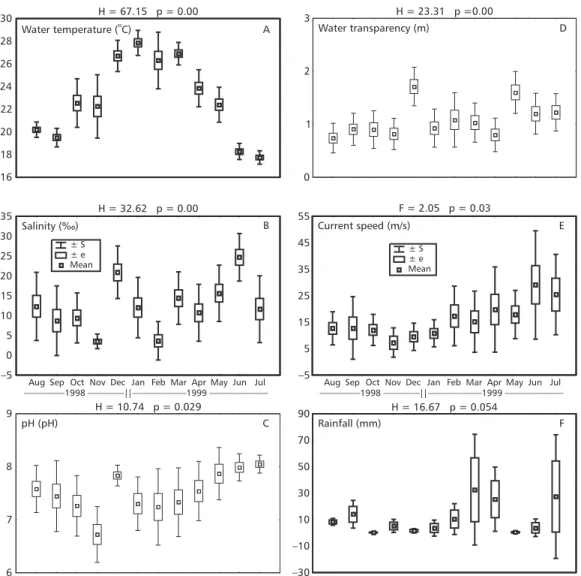
The temperature presented a seasonal pattern, with significantly larger averages in the summer and beginning of autumn; intermediary ones in October, November, April, and May; and the smallest ones in winter and the beginning of spring (Fig. 2A). In the area, salinity was significantly smaller in February and November, with maximums in June and De-cember, and intermediary mean values, with no statistical differences between them, from the middle of winter to the middle of spring, in January, and in autumn (Fig. 2B). An increase in the mean pH was observed from the end of spring to the middle of winter, followed by a decrease during the rest of winter and spring (Fig. 2C). Statistically, the mean pH in November was smaller than in the rest of the year, and greater from May to July in comparison to spring and from the middle of summer to the beginning of autumn. During the whole sample period, the water transparency values were significantly larger in December and May, and in June and July when compared to April, August, and November, although there was no significant difference between the end of winter and the end of spring, and the middle of summer and the middle of autumn (Fig. 2D). The mean current speed increased from the end of spring to the beginning of winter, and then decreased until August and showed little variation in spring. The mean values observed in June and July were only signi-ficantly larger than those registered between August and January, and there was no significant difference between the averages of the other months (Fig. 2E). The differences observed among the monthly rainfall averages were not significant (Fig. 2F).
Ichthyofauna
The monthly collections made throughout the year resulted in the capture of 36,873 fish from 52 species (Table 1). The ichthyofauna of Baguaçu tidal creek was dominated by both immature fish (63.8%) and females (66.1%). Twenty-four species present in the area were found only in the juvenile stage, 26 in the juvenile and adult stages, and two had only adult individuals. Moreover, the ichthyofauna was characterized by the largest species diversity in the families Carangidae and Sciaenidae (six species) and Engraulidae (five species) and by being dominated by some species of economic interest to commercial fishing (Anchoa parva, Anchoa tricolor, Harengula
clupeola, Genidens genidens, Bairdiella ronchus,
Sphoeroides greeleyi, and Sphoeroides testudineus) which always contributed individually and made up more than 2% of the capture. The great majority of the captured fish (58.7%) belonged to the species
A. parva that was not, however, present in all the months studied. Only the species B. ronchus,
Citharichthys spilopterus, S. greeleyi, and S. testudineus were present in every month throughout collection. Together, the species A. parva, H. clupeola,
G. genidens, and B. ronchus contributed with 84.9% of the total capture of fish, however with only 55.2% of the biomass, indicating that smaller fish predominated in the population (standard length: 50 to 100 mm). The structure of the assemblage in number was relatively different to the structure in weight, being affected by the capture of larger individuals of S. testudineus (standard length: 50 to 150 mm), B. ronchus (standard length: 80 to 140 mm), and G. genidens (standard length: 50 to 150 mm), and of smaller specimens of A. parva (standard length: 50 to 65 mm) and of H. clupeola (standard length: 50 to 80 mm). Therefore, A. parva, that dominated the captures in number (58.7%), was the third main contributor in terms of biomass (16.0%) and S. testudineus, the fifth species captured numerically, was the species that most contributed to the structure in weight (30.6%).
Temporal variation
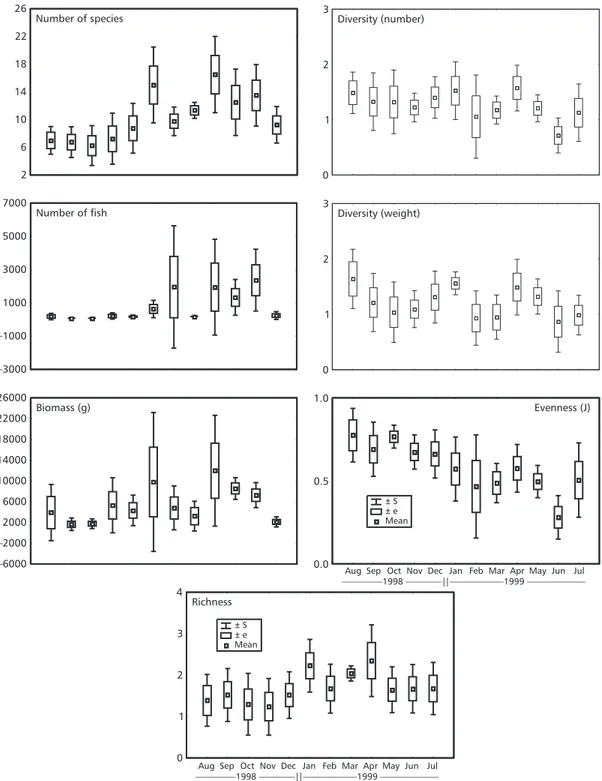
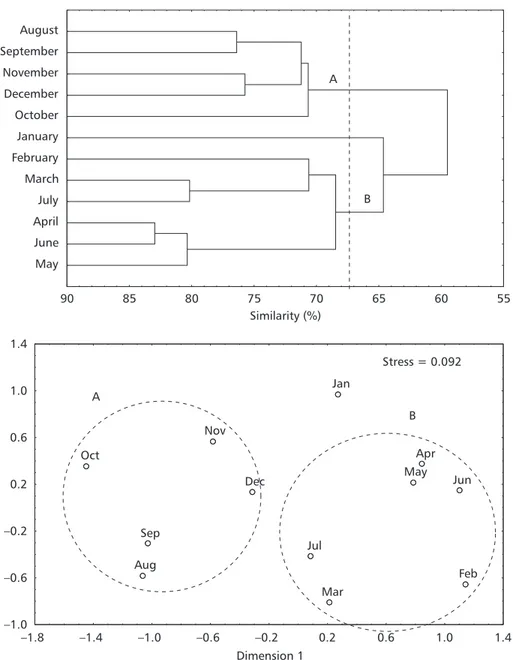
Based on the density of the 23 main taxa, the cluster analysis separated the months of collection into two large groups, united at the similarity level of 68% (Fig. 4). Group A, united the months of August, September, October, November, and De-cember at the similarity level of 71% and presented the smallest mean captures in number of species, number of fish, and biomass; the smallest values of species richness; and the largest values of evenness (Table 2). The second group (B), made up of the months February, March, April, May, June, and July united at the similarity level of 68.5%, presented the largest captures in number of species, number of fish, biomass, and richness, and the smallest evenness
values (Table 2). Group B is formed by two sub-groups, the first with the months of February, March, and July united at the similarity level of 70.8%, and the other formed by the months of April, May, and June united at the similarity level of 80.3%. The month of January did not differ statistically from group B in any of the biological parameters considered and was only similar to the months of group A with regard to the capture in weight and evenness. In the nonmetric multidimensional scaling (MDS), the separation of the months into the first two dimensions corresponds to the pattern generated by cluster analysis. The stress of 0.092 indicates that the similarities are appropriately represented by the distances in the plain (Fig. 4).
H = 67.15 p = 0.00
16 18 20 22 24 26 28
30 H = 23.31 p =0.00
0 1 2 3
H = 32.62 p = 0.00
–5 0 5 10 15 20 25 30 35
Aug Sep Oct Nov Dec Jan Feb Mar Apr May Jun Jul ± S
± e Mean
|——————1999 ————–——
F = 2.05 p = 0.03
–5 5 15 25 35 45 55
± S ± e Mean
H = 10.74 p = 0.029
6 7 8
9 H = 16.67 p = 0.054
–30 –10 10 30 50 70 90 —–———1998 ————|
Aug Sep Oct Nov Dec Jan Feb Mar Apr May Jun Jul |——————1999 ————–—— —–———1998 ————|
Water temperature ( C)o Water transparency (m)
Salinity (‰) Current speed (m/s)
pH (pH) Rainfall (mm)
A D
B E
C F
TABLE 1
Species composition and number of fish in the monthly captures in the Baguaçu tidel creek (% of total capture).
Aug Sep Oct Nov Dec Jan Feb Mar Apr May Jun Jul %
Anchoa lyolepis 0 0 0 0 0 0 87 4 8 0 6 0 0.3
Anchoa parva 62 0 0 0 1 3 7183 19 3685 1982 8124 583 58.7
Anchoa tricolor 0 0 7 12 0 2 0 2 334 0 453 1 2.2
Cetengraulis edentulus 0 0 0 0 0 1 0 1 0 0 0 0 0.0
Lycengraulis grossidens 6 6 3 1 1 69 0 0 7 16 8 2 0.3
Harengula clupeola 0 2 2 30 127 19 68 178 734 2215 284 115 10.2
Opisthonema oglinum 0 0 0 0 0 5 11 3 6 24 45 1 0.3
Sardinella brasiliensis 0 2 0 0 1 0 0 10 6 51 3 8 0.2
Genidens genidens 0 1 0 1 119 746 13 1 1566 38 25 1 6.8
Mugil curema 2 0 0 0 0 7 0 0 5 0 0 0 0.0
Mugil gaimardianus 0 0 0 0 0 1 0 0 0 0 0 0 0.0
Mugil incilis 0 0 0 0 0 1 0 0 0 0 0 0 0.0
Mugil sp. 0 0 0 0 0 0 1 0 0 1 0 0 0.0
Atherinella brasiliensis 16 5 35 1 50 1 0 2 64 49 64 10 0.8
Strongylura sp. 0 0 0 0 0 0 0 0 0 0 1 0 0.0
Hemiramphus brasiliensis 0 0 1 1 0 0 0 0 0 6 0 0 0.0
Hyporhamphus unifasciatus 6 10 1 0 3 0 0 0 4 2 2 1 0.1
Poecilia vivipara 0 0 0 17 0 1 0 0 0 0 0 0 0.0
Centropomus parallelus 0 0 17 6 4 23 0 0 8 6 0 0 0.2
Centropomus undecimalis 0 1 3 0 0 1 0 0 0 1 0 0 0.0
Pomatomus saltatrix 0 0 0 0 0 1 0 0 0 2 2 0 0.0
Caranx latus 0 0 0 0 0 0 1 0 0 0 0 0 0.0
Caranx sp. 0 0 0 0 1 0 0 0 0 0 2 0 0.0
Chloroscombrus chrysurus 0 0 0 0 0 0 0 0 4 0 0 0 0.0
Oligoplites saurus 0 0 0 0 0 20 2 0 0 1 2 0 0.1
Selene vomer 0 0 0 0 0 0 0 0 0 0 3 0 0.0
Trachinotus sp. 0 0 0 0 0 0 0 0 0 0 3 0 0.0
Diapterus rhombeus 0 0 0 0 0 18 10 5 16 39 3 1 0.2
Eucinostomus argenteus 8 8 2 8 4 96 13 7 2 0 0 1 0.4
Eucinostomus gula 0 12 0 11 5 3 2 1 3 3 3 1 0.1
Eucinostomus melanopterus 0 0 0 0 0 2 0 0 6 0 0 11 0.1
Bairdiella ronchus 168 64 4 210 85 902 322 190 794 569 16 65 9.2
Cynoscion acoupa 0 0 0 0 0 0 0 0 1 3 0 0 0.0
Cynoscion leiarchus 0 0 0 0 0 0 0 1 4 0 0 0 0.0
Cynoscion microlepidotus 0 0 0 0 0 0 0 1 0 2 0 0 0.0
Isopisthus parvipinnis 0 0 0 0 0 0 0 0 2 0 0 0 0.0
Ophioscion punctatissimus 0 0 0 0 1 121 1 3 0 4 2 0 0.4
Parablennius pilicornis 0 0 1 0 0 0 0 0 0 0 0 0 0.0
Bathygobius soporator 0 0 1 0 0 1 0 0 2 0 0 1 0.0
Gobionellus oceanicus 0 0 0 0 0 0 1 0 0 0 0 0 0.0
Through the percentage similarity analysis (SIMPER), for the similarity of 71.96% of group A, the main contributors were Atherinella brasiliensis,
Eucinostomus argenteus, B. ronchus, S. greeleyi, and
S. testudineus (70.89%). Almost the same similarity (72.08%) was observed in group B defined by cluster analysis (months), with the greatest contribution coming from the species A. parva, H. clupeola, G. genidens, B. ronchus, C. spilopterus, S. greeleyi, and
S. testudineus (67.28%). The mean dissimilarity between these two groups was of 40.77%, due mainly to differences in the temporal pattern of occurrence of the species A. parva, H. clupeola, Opisthonema oglinum, G. genidens, Diapterus rhombeus, and B. ronchus (Table 3).
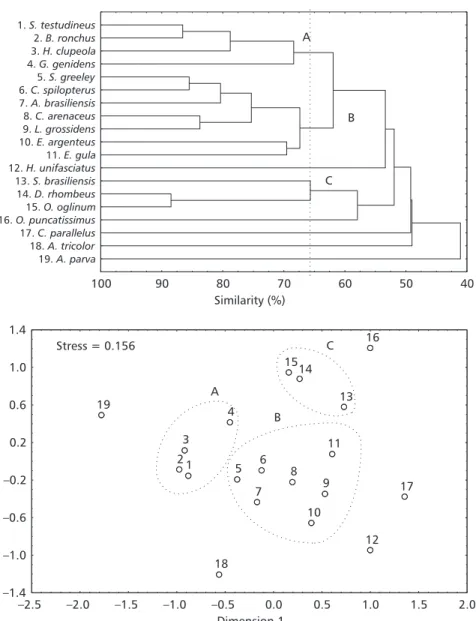
The cluster analysis (inverse method) based on the monthly abundance of the 23 selected species, separated the species into three groups at the similarity level of 65% (Fig. 5). United at the similarity level of 68%, the species S. testudineus,
B. ronchus, H. clupeola, and G. genidens form group A, the former two species represented by juvenile and adult individuals and the latter almost exclusively by juveniles. These species occur throughout the year in the tide channel, however there is a greater similarity in the pattern of occur-rence of B. ronchus and S. testudineus (87.0%) as they are present in large quantities during the whole year, while the species H. clupeola and G. genidens are more abundant in summer and spring (Table 1). A second group B, formed at the similarity level of 67.5%, is composed of two
sub-groups. The first unites, at the similarity level of 75.0%, juveniles and adults of the species S. greeleyi, C. spilopterus, A. brasiliensis, Citharichthys arenaceus, and Lycengraulis grossidens, present in the area throughout the year in smaller quantities than the species of group A, but in larger amounts than the juveniles and adults of the species E. argenteus and Eucinostomus gula that constitute the other sub-group of group B. Lastly, group C, with a similarity of 66.0%, is formed by the species
Sardinella brasiliensis, D. rhombeus, and O. oglinum, present in the samples mainly in the juvenile stage and practically absent in the spring. The latter two species were totally absent from the samples collected between August and December (Table 1). Species that present different patterns of occurrence did not group with any other species. These were Hyporhamphus unifasciatus, present in small amounts mainly from the middle of autumn to the beginning of spring; Ophioscion punctatissimus, present in the samples from the beginning of summer to the beginning of winter, especially as a single aggregation; Centropomus parallelus with a greater abundance from the middle of spring to the middle of summer; A. tricolor, almost exclu-sively present in two aggregations in autumn and in winter; and A. parva, absent in the area in spring and more frequent from the end of summer to the middle of winter, especially in large aggregations (Table 1, Fig. 5). The groups delineated in the dendrogram at the similarity level of 65.0% can be seen in the first two dimensions of the MDS
TABLE 1 (Continued).
Aug Sep Oct Nov Dec Jan Feb Mar Apr May Jun Jul %
Chaetodipterus faber 0 0 0 0 1 2 0 0 0 0 0 0 0.0
Trichiurus lepturus 0 1 0 0 0 0 0 0 4 0 1 7 0.0
Scomberomorus brasiliensis 0 0 0 0 0 0 4 0 0 0 0 0 0.0
Peprilus paru 0 1 0 0 0 0 0 0 0 0 0 0 0.0
Citharichthys arenaceus 2 2 1 15 5 40 0 2 19 12 19 7 0.3
Citharichthys spilopterus 7 4 10 36 20 60 9 8 38 32 55 13 0.8
Citharichthys sp. 0 0 0 0 0 0 0 0 1 0 0 0 0.0
Achirus lineatus 0 0 0 0 0 0 0 0 0 0 1 0 0.0
Symphurus tesselatus 0 0 0 0 0 1 0 0 0 0 0 1 0.0
Sphoeroides greeleyi 99 66 49 182 89 99 15 5 32 87 25 18 2.1
Sphoeroides testudineus 151 62 119 317 164 274 76 35 413 174 312 96 5.9
analysis. The stress of 0.156 reveals a certain difficulty in representing the similarity
relation-ships between the species through the distances in the graph (Fig. 5).
2 6 10 14 18 22 26
0 1 2 3
–3000 –1000 1000 3000 5000 7000
0 1 2 3
–6000 –2000 2000 6000 10000 14000 18000 22000 26000
0.0 0.5 1.0
Aug Sep Oct Nov Dec Jan Feb Mar Apr May Jun Jul
±S
±e Mean
—–———1998————||——————1999 ————–——
0 1 2 3 4
±S
±e Mean
Aug Sep Oct Nov Dec Jan Feb Mar Apr May Jun Jul —–———1998————||——————1999 ————–—— Number of species Diversity (number)
Number of fish Diversity (weight)
Biomass (g) Evenness (J)
Richness
Similarity (%) May
June April July March February January October December November September August
90 85 80 75 70 65 60 55
Dimension 1 Aug
Sep Oct
Nov
Dec
Jan
Feb Mar
Apr May
Jun
Jul
–1.0 –0.6 –0.2 0.2 0.6 1.0 1.4
–1.8 –1.4 –1.0 –0.6 –0.2 0.2 0.6 1.0 1.4
A
B Stress = 0.092 A
B
Fig. 4 Dendrogram and MDS ordination plot based on the abundance of the main 23 taxa sampled monthly in the Baguaçu tidal creek. Groups of species delineated at the similarity level of 68% in the dendrogram, are circled in the ordination plot. The stress of the MDS ordination = 0.092.
The probable influence of the isolated or combined physical-chemical variables on the tem-poral biological pattern was analyzed through the Spearman coefficient of correlation. The results revealed low correlations between the abiotic para-meters and the biotic parapara-meters analyzed (Table 4). The isolated salinity variable and the combined rainfall and pH variables and water transparency
and pH variables seem to better explain the groups defined in the cluster analysis.
DISCUSSION
number and weight (Robertson & Duke, 1990; Lin & Shao, 1999; Barletta, 1999; Vidy, 2000; Laffaille
et al., 2000; this study). In general, different species can dominate in a single tide channel, both in number and weight (Laffaille et al., 2000; this study), although there are cases where this dominance is exerted by the same species (Barletta, 1999; Lin & Shao, 1999). Vendel (1997) studied the fish assemblage in the same tide channel and, although she used very different
collection strategies, especially with regard to the type of net, she also observed a dominance in number and total weight of the species A. parva, H. clupeola,
G. genidens, and S. testudineus, whereas there was a difference in the dominance of S. greeleyi and B. ronchus. Although differences exist among the locali-ties with regard to the dominant species, this domi-nance is exerted by species of low trophic levels (Laffaille et al., 2000; Chaves et al., 2000; this study).
Fig. 5 Dendrogram and MDS ordination plot showing the similarities among the most abundant taxa based on their occur-rence throughout the twelve months of sampling in the Baguaçu tidal creek. Groups of species delineated at the similarity level of 65% in the dendrogram are circled in the ordination plot. In the graph, the species are represented by their respective num-bers given in the dendrogram. Stress for the MDS ordination = 0.156.
Similarity (%)
19.A. parva
18.A. tricolor 17.C. parallelus
16.O. puncatissimus
15.O. oglinum
14.D. rhombeus
13.S. brasiliensis 12.H. unifasciatus 11.E. gula 10.E. argenteus 9.L. grossidens 8.C. arenaceus 7.A. brasiliensis 6.C. spilopterus 5.S. greeley 4.G. genidens 3.H. clupeola 2.B. ronchus 1.S. testudineus
100 90 80 70 60 50 40
A
B
C
Dimension 1
1 5 6
7 2
8 9 4
17
10
12
19 13
11 3
18
16
14 15
–1.4 –1.0 –0.6 –0.2 0.2 0.6 1.0 1.4
–2.5 –2.0 –1.5 –1.0 –0.5 0.0 0.5 1.0 1.5 2.0
A
B
Month Group
F p H p F p H p LSD
Number of species 3.33 0.00** 14.31 0.00** Ja B > A
Number of fish 23.33 0.00** 4.35 0.00** Ja B > A
Biomass 1.81 0.10 NS 4.66 0.10 NS Ja A Ja B B > A
Richness 1.17 0.34 NS 2.70 0.26 NS Ja B > A
Diversity (number) 1.03 0.44 NS 1.81 0.17 NS
Diversity (weight) 1.27 0.28 NS 4.44 0.11 NS
Evenness 2.74 0.01** 16.24 0.00** A Ja Ja B A > B TABLE 2
Result of the analysis of variance (F) and of the Kruskal-Wallis test (H), evaluating the effect of the month of collection and of the groups of months defined in the cluster analysis (Q mode), on the mean capture in number of species, number of fish, biomass, Margalefs species richness, diversity of Shannon-Wiener (number and weight), and evenness of Pielou, in
the Baguaçu tidal creek (NS = non-significant difference, ** significant difference at the level of p < 0.01, * significant difference at the level of p < 0.05, Ja = January).
A B
Average similarity within each group (%) 71.96 72.08
Species
Anchoa parva 16.65
Lycengraulis grossidens 6.27
Harengula clupeola 11.88
Opisthonema oglinum 4.75
Genidens genidens 4.83
Atherinella brasiliensis 8.28
Diapterus rhombeus 4.67
Eucinostomus argenteus 7.73
Bairdiella ronchus 12.91 10.68
Citharichthys arenaceus 6.26
Citharichthys spilopterus 8.89 6.49
Sphoeroides greeleyi 15.64 6.51
Sphoeroides testudineus 17.44 10.25
A x B
Average dissimilarity between groups (%) 40.77
Species
Anchoa parva 21.97
Harengula clupeola 10.15
Opisthonema oglinum 6.50
Genidens genidens 6.82
Diapterus rhombeus 6.26
Bairdiella ronchus 5.04
TABLE 3
Percentage contribution (%) of the most abundant and constant species in the Baguaçu tidal creek for the similarity inside group A (August, September, October, November, and December) and group B (February, March, April, May,
A characteristic of the fish populations in shallow coastal areas is the abundance of juveniles in the captures. This dominance demonstrates the importance of shallow water environments such as mangrove forests, tidal pools, rocky shores, coastal reefs, beach surf zones, and estuaries, for the nursering of fish. In the captures at Baguaçu, the juvenile specimens constituted 65% of the captured fish and 96% of the species were represented by juveniles. The species Gobionellus oceanicus and Gobionellus smaragdus were only present in the samples as adults. The species B. ronchus, S. testudineus, S. greeleyi,
C. arenaceus, and C. spilopterus seemed to occupy the area throughout the year, while the species A. parva, G. genidens, S. brasiliensis, H. clupeola, C. parallelus, D. rhombeus, Oligoplites saurus, O. oglinum, and Anchoa lyolepis appear in the area as juvenile migrants, and O. punctatissimus as a migrant both in the juvenile and adult stages. Most of the fish community at Baguaçu was formed by occasional visitors, mainly juveniles of marine species (34 species), a common pattern in tidal creeks (Lin & Shao, 1999; Vidy, 2000). The species E. argenteus,
E. gula, and A. brasiliensis, visibly abundant in the juvenile stage in the external marginal areas of Paranaguá Bay (Godefroid et al., 1997; Pinheiro, 1999; Lopes, 2000), were captured in the tide channel in significant amounts during the whole year, although they showed an irregular pattern of occurrence. Chaves & Otto (1999) verified that species of Eucinostomus present in the mangroves of Guaratuba Bay use the area for part of their life cycle, with the juveniles growing throughout the year then migrating to other areas for maturation and spawning in spring and summer.
Part of the variability found in the data (abun-dance and diversity), as already mentioned, might
depend on the collection method, which is easily observed if we compare the results obtained by Vendel (1997) with this study. Besides the differences obser-ved in the relative abundance of the dominant species, 13 and 16 species were exclusive to the first and second study, respectively. Species such as
Eucinostomus melanopterus, Cynoscion acoupa,
Cynoscion leiarchus, Cynoscion microlepidotus, O. punctatissimus, Trichiurus lepturus, S. brasiliensis,
C. spilopterus, Hemiramphus brasiliensis, and
Isopisthus parvipinnis, present in significant amounts only in this study, were probably absent in the previous study as they are largely associated with the saline front in the high tide and/or they move together with the tide along the deepest part of the tide channel, conditions that were only considered in the sampling strategy of the present study. This fact seems to agree with Corrêa's observations (1987), that these species, with the exception of O. punctatissimus and H. brasiliensis that were not mentioned in these studies, are associated principally with the main channel of the estuary and the adjacent continental shelf, areas where the more saline coastal waters prevail.
The seasonal cycle of the number of species in the tide channel, with significantly larger averages from the middle of summer to the middle of winter, and peaks in January, April, and June, where the largest number of occasional species occur, mainly in the juvenile stage, demonstrates that in this period the area is used largely for nursering. This was also observed in a previous study in Baguaçu, Paraná (Vendel, 1997) and in tidal creeks of Pará State (Barletta, 1999), Australia (Robertson & Duke, 1990), and France (Laffaille et al., 2000). In Para-naguá Bay and in other regions of the southeastern-southern coast of Brazil, this seasonal pattern occurred in several studies about the ichthyofauna
TABLE 4
Most significant results of rank correlation (BIOENV), indicating the influence of the water temperature (T), salinity (S), pH (p), water transparency (Tr), current speed (C), and rainfall (R) on the community pattern. The values are the coefficients of pondered harmonic Spearman rank correlation, for the isolated variables and each combination.
The results indicate the nature and the magnitude of the correlation.
S R Rp Trp STr
–0.166 –0.107 –0.186 –0.166 –0.149
RTrp STrp RSTrp TrSTrp TRSTrpV
of different coastal shallow water environments (Chao et al., 1982; Lopes, 2000).
In Paranaguá Bay, studies on the fish com-munities showed a larger abundance of individuals in the summer and autumn and smaller in the winter and spring (Pinheiro, 1999). This seasonal pattern is repeated in Baguaçu tidal creek, with peaks of occurrence in February, April, May, and June, caused by large captures of juveniles of A. parva, H. clupeola,
B. ronchus, and G. genidens, species responsible for more than 90% of the total capture in these months. Vendel (1997), in a survey of Baguaçu, also observed, in the summer and autumn, large aggregations of A. parva, H. clupeola, B. ronchus, and G. genidens
especially of the first species that, as in this study, was the most abundant species in the tide channel. An explanation for this pattern is that the tide channel was dominated by the resident estuarine species A. parva, B. ronchus, G. genidens, S. greeleyi, and S. testudineus (Chaves et al., 2000) and the marine species H. clupeola, with similar life histories. The resident ones spawned at the site or close to the area in the spring and summer, and the marine species in the adjacent coastal zone (Chaves, 1989, 1995; Rocha
et al., 2002; Schultz et al., 2002), with the recruitment occurring mainly between the summer and beginning of winter. Reproduction in the spring and summer, with subsequent recruitment in the summer and autumn has been observed in most of the local species (Pinheiro, 1999; Chaves & Otto, 1999; Chaves & Bouchereau, 2000).
In the warmest seasons of the year, the greater penetration of the more nutrient-rich South Atlantic central water (SACW) on the internal continen-tal shelf causes an increase in the primary production of the euphotic zone and in the stability of the column, that together with the smaller turbulence of the mixture layer maintains the food aggregates in such a way as to favor the fish larvae. Moreover, the predominant direction of the wind favors the transport of larvae by passive drift towards the coast, where they aggregate in areas adjacent to estuaries before migrating to recruitment areas. In spite of the continental drainage, Paranaguá Bay is dominated by the adjacent coastal water and all the hydrological events in the shelf affect the temporal dynamics of the nutrients and the phytoplankton (Brandini & Thamm, 1994). Therefore, these intrusions of the SACW increase the total biomass of phytoplankton in Paranaguá
Bay, making food more available for the fish and favoring the nursering and recruitment processes in the area during this period. The dominance of few species of primary consumers, a common fact in estuarine areas (Blaber et al., 1984), characte-rizes the prevalence of short food chains able to sustain a high density of fish in the system. The juveniles of A. parva and H. clupeola, probably in their first year, corresponded to 69% of the annual production and, through their planktotrophic diet, these fish are the main direct connection with the high primary production in the region. Other species such as G. genidens, B. ronchus, C. arenaceus,
C. spilopterus, S. greeleyi, and S. testudineus, also important numerically, are mainly carnivorous at the base of the food chain and are, therefore, favored by the increment of the secondary production in the area (Chaves & Vendel, 1996; Chaves & Serenato, 1998; Vendel & Chaves, 1998).
Diversity and richness indices have been used as an aid in interpretating the temporal patterns in fish assemblages. In the present study, the richness index of Margalef showed considerable change in the richness of species, there being significantly larger values between January and July in com-parison to the rest of the year, with no seasonal tendency having been observed in any other shallow environment at Paranaguá Bay (Godefroid et al., 1997; Lopes, 2000). The richness (D) at Baguaçu was between 0.2 and 3.54. These values are relatively different from those observed in the surf zone at Pontal do Sul beach (D = 2.0-5.05, Godefroid et al., 1997), and in a tidal flat close to the study area (D = 1.35-3.7; Lopes, 2000).
reflected the dominance of few species. The population indexes reflected changes in the abundance of the species and the individuals at every moment of the sample period. The diversity (H') and the evenness (J) presented similar patterns of fluctuation during the 12 months. The richness index (D), however, showed a different pattern, indicating that the species richness and the evenness, both of which are components of diversity, followed different tendencies through time.
The fish community of Baguaçu was domi-nated by periodic and resident components, all primary consumers, that made up three groups of species. The first group had two estuarine species (S. testudineus and G. genidens) and two marine species (B. ronchus and H. clupeola). The second group included seven species, six of which are estuarine species (S. geeleyi, C. spilopterus, A. brasiliensis, C. arenaceus, E. argenteus, and E. gula) the remaning species is a marine one (L. grossidens). The third group had three marine one (S. brasiliensis,
D. rhombeus, and O. oglinum). Among the species that did not group in the cluster analysis, only H. unifasciatus can be considered an estuarine species, while the others are all marine (O. punctatissimus,
C. paralelus, A. tricolour, and A. parva). The comparison of the local ichthyofauna and especially the dominance ratio, seems to reflect the change in estuarine and marine conditions. Although this tide channel is situated in the euhaline section of Paranaguá Bay, it alternates between being an actual estuarine condition at low tide and a marine one at high tide, conditions that were included in the collection plan.
REFERENCES
BARLETTA, M., 1999, Seasonal changes of density, biomass and species composition of fishes in different habitats of the Caeté estuary (Northern Brazilian coast east Amazon).
Zentrum für Marine Tropenökologie ZMT, 7, 115p. BLABER, S. J. M., HAY, D. G., CYRUS, D. P. & MARTÍN,
T. J., 1984, The ecology of two degraded estuaries on the north coast of Natal, South Africa. S. Afr. J. Zool., South Africa, 19: 224-240.
BRANDINI, F. P. & THAMM, C. A. C., 1994, Variações diárias e sazonais do fitoplâncton e parâmetros ambientais na Baía de Paranaguá. Nerítica, Curitiba, 8(1-2): 55-72. CATTRIJSSE, A., MAKAWAIA, E. S., DANKWA, H. R.,
HAMERLYNCK, O. & HEMMINGA, M. A., 1994, Nekton communities of an intertidal creek of a European estuarine brackish marsh. Mar. Ecol. Prog. Ser., Oldendorf, 109: 195-208.
CHAO, L. N., PEREIRA, L. E., VIEIRA, J. P., BEMVENUTI, M. A. & CUNHA, L. P. R., 1982, Relação preliminar dos peixes estuarinos e marinhos da Lagoa dos Patos e região costeira adjacente, Rio Grande do Sul, Brasil. Atlântica, Rio Grande, 5: 67-75.
CHAVES, P. T. C., 1989, Desenvolvimento de ovócitos em
Harengula clupeola, Urophycis brasiliensis, Eucinostomus argenteus, Isopisthus parvipinnis e Menticirrhus americanus
(Teleostei). Bol. Inst. Oceanogr., São Paulo, 37(2): 81-93. CHAVES, P. T. C., 1995, Atividade reprodutiva de Bairdiella ronchus (Cuvier) (Pisces, Sciaenidae) na Baía e Guaratuba, Paraná, Brasil. Rev. Bras. Zool., Curitiba, 12(4): 759-766. CHAVES, P. T. C. & BOUCHEREAU, J-L., 2000, Use of mangrove habitat for reproductive activity by the fish assemblage in the Guaratuba Bay, Brazil. Oceanologica Acta, 23(3): 273-280.
CHAVES, P. T. C., BOUCHEREAU, J. L. & VENDEL, A. L., 2000, The Guaratuba Bay, Paraná, Brazil (25o52'S; 48o39'W),
in the life cycle of coastal fish species. In: International Conference Sustainability of Estuaries and Mangroves: Challenges and Prospects, Recife. Published in CD-rom by UFRPE. Recife, pp. 1-8. 1 CD-ROM.
CHAVES, P. T. C. & OTTO, G., 1999, The mangrove as a temporary habitat for fish: the Eucinostomus species at Guaratuba Bay, Brazil (25o52'S; 48o39'W). Braz. Arch. Biol.
Tecnol., Curitiba, 42(1): 61-68.
CHAVES, P. T. C. & SERENATO, A., 1998, Diversidade de dietas na assembléia de linguados (Teleostei, Pleuronectiformes) do manguezal da Baía de Guaratuba, Paraná, Brasil. Rev. Bras. Oceanogr., São Paulo, 46(1): 61-68.
CHAVES, P. T. C. & VENDEL, A. L., 1996, Aspectos da alimen-tação de Genidens genidens (Valenciennes) (Siluriformes, Ariidae) na Baía de Guaratuba, Paraná. Rev. Bras. Zool., Curitiba, 13(3): 669-675.
CLARKE, K. R. & WARWICK, R. W., 1994, Change in marine communities: an approach to statistical analysis and interpretation. Plymouth Marine Laboratory, 859p. CONOVER, W. J., 1990, Practical nonparametric statistics.
John Willey & Sons, New Jersey, 584p.
CORRÊA, M. F. M., 1987, Ictiofauna da Baía de Paranaguá e adjacências (litoral do Estado do Paraná Brasil). Levantamento e produtividade. Dissertação de Mestrado, UFPR, Curitiba, 460p.
DESMOND, J. S., ZEDLER, J. B. & WILLIAMS, G. D., 2000, Fish use of tidal creek habitats in two Southern California salt marshes. Ecol. Engineering, 14: 233-252.
GODEFROID, R. S., HOFSTAETTER, M. & SPACH, H. L., 1997, Structure of the fish assemblage in the surf zone beach at Pontal do Sul, Paraná. Nerítica, Curitiba, 11: 77-93.
LAFFAILLE, P., FEUNTEUN, E. & LEFEUVRE, J. C., 2000, Composition of fish communities in a European macrotidal salt marsh (the Mont Saint-Michel Bay, France). Estuar. Coast. Shelf Sci., London, 51: 429-438.
LOPES, S. C. G., 2000, Ictiofauna de uma planície de maré adjacente à Gamboa do Baguaçu, Baía de Paranaguá.
Monografia de Bacharelado, UFPR, Curitiba, 35p. LUDWIG, J. A. & REYNOLDS, J. F., 1988, Statistical ecology.
John Wiley & Sons, 337p.
PATERSON, A. W. & WHITFIELD, A. K., 2000, Do shallow water habitats function as refugia for juvenile fishes? Estuar. Coast. Shelf Sci., London, 51: 359-364.
PINHEIRO, P. C., 1999, Dinâmica das comunidades de peixes em três áreas amostrais da Ilha do Mel, Baía de Paranaguá, Paraná, Brasil. Dissertação de Mestrado, UFPR, Curitiba, 171p.
ROBERTSON, A. L. & DUKE, S. J. M., 1990, Mangroves as nursery sites: comparisons of the abundance and species composition of fish and crustaceans in mangroves and other nearshore habitats in tropical Australia. Mar. Biol., New York, 96: 193-205.
ROCHA, C., FÁVARO, L. F. & SPACH, H. L., 2002, Biologia reprodutiva de Sphoeroides testudineus (Linnaeus, 1758), Tetraodontidae, da Gamboa do Baguaçu, Baía de Paranaguá,
Pr. Rev. Bras. Zool., Curitiba, 19(1): 57-63.
ROZAS, L. P. & ZIMMERMAN, R. J., 2000, Small-scale patterns of nekton use among marsh and adjacent shallow nonvegetated areas of the Galveston Bay Estuary, Texas (USA). Mar. Ecol. Prog. Ser., Oldendorf, 193: 217-239.
SCHULTZ, Y. D., FÁVARO, L. F. & SPACH, H. L., 2002, Aspectos reprodutivos de Sphoeroides greeleyi (Gilbert, 1900), Tetraodontidae, da Gamboa do Baguaçu. Paranaguá,
PR. Rev. Bras. Zool., Curitiba, 19(1): 65-76.
SESSEGOLO, G. C. S., 1997, Estrutura e produção de serapilheira do manguezal do Rio Baguaçu, Baía de Paranaguá-PR. Dissertação de Mestrado, UFPR, Curitiba,
130p.
SOKAL, R. R. & ROHLF, F. J., 1995, Biometry. W. H. Freeman and Company, 859p.
VENDEL, A. L., 1997, Dinâmica e estrutura da assembléia de peixes na gamboa do Baguaçu, Baía de Paranaguá, Paraná. Monografia de Bacharelado, UFPR, Curitiba, 44p. VENDEL, A. L. & CHAVES, P. T. C., 1998, Alimentação de Bairdiella ronchus (Curvier) (Perciformes, Sciaenidae) na Baía de Guaratuba, Paraná, Brasil. Rev. Bras. Zool., Curitiba,
15(2): 297-305.