Note
CLIMATIC RISK OF GRAPE DOWNY MILDEW (Plasmopara
viticola) FOR THE STATE OF SÃO PAULO, BRAZIL
Emília Hamada1*; Raquel Ghini1; Paulo Rossi2; Mário José Pedro Júnior3; Jeferson Lobato Fernandes4
1
Embrapa Meio Ambiente, C.P. 69 - 13820-000 - Jaguariúna, SP - Brasil. 2
Embrapa Cerrados, C.P. 08223 - 73310-970 - Planaltina, DF - Brasil. 3
IAC/APTA/SAA, C.P. 28 - 13012-970 - Campinas, SP - Brasil. 4
Unicamp/Feagri - Programa de Pós-Graduação em Planejamento e Desenvolvimento Rural Sustentável, C.P. 6011 - 13083-875 - Campinas, SP - Brasil.
*Corresponding author <[email protected]>
ABSTRACT: Viticulture in Brazil has been growing in importance in recent years. In the State of São Paulo, a significant percentage of the production is basically destined toin natura consumption and,
more recently, much effort has been made by institutions to revitalize the viticulture in the State. Among fungal diseases, the downy mildew (Plasmopara viticola) is one of the main diseases affecting
this crop in Brazil, with extreme damage effects on its production. The objective of this study was to estimate the incidence of the downy mildew on grape under the climatic conditions of the State of São Paulo, based on a mathematical model and using Geographical Information System - GIS tools. The study considered the months from September to April, a period in which the downy mildew can affect grapevines under development. Mean temperature and relative humidity were the basic weather data entered in the GIS database. Leaf wetness duration was estimated from relative humidity measurements. Climatic data entered in the GIS were used to calculate and produce maps depicting the severity of the grape downy mildew, through the application of a disease model. Three cities were evaluated (Jales, Jundiaí, and São Miguel Arcanjo), since they represent the main vineyard centers in the State. The adopted methodology permitted quantifying the severity of the grape downy mildew not only in spatial terms, identifying the variability among the different regions of the State, but also in temporal terms, along the months, making an adequate distinction of the studied cities.
Key words: Vitis spp., Geographical Information System, temperature, relative humidity, leaf wetness
duration
RISCO CLIMÁTICO DO MÍLDIO DA VIDEIRA (
Plasmopara viticola
)
NO ESTADO DE SÃO PAULO
RESUMO: A viticultura brasileira tem apresentado importância crescente nos últimos anos. Em São Paulo, a expressiva produção é destinada basicamente ao consumo in natura e, mais recentemente, podem ser observados esforços de diversas instituições no sentido de revitalizar a viticultura no estado. O míldio (Plasmopara viticola) é uma das principais doenças da cultura no Brasil, com efeitos
extremamente danosos à sua produção. No presente trabalho foi estimada a severidade do míldio da videira nas condições climáticas do estado de São Paulo, com base num modelo de estimativa da doença e empregando-se um Sistema de Informações Geográficas - SIG. O estudo considerou os meses de setembro a abril, período em que a doença pode afetar as videiras em desenvolvimento. Os valores básicos de entrada no banco de dados do SIG foram temperatura média e umidade relativa. A duração do período de molhamento foliar foi estimada a partir dos dados de umidade relativa. Com os dados climáticos organizados no SIG, foram calculados e produzidos os mapas de severidade do míldio da videira, aplicando-se o modelo de estimativa. Também foram avaliados três municípios (Jales, Jundiaí e São Miguel Arcanjo), representativos de importantes pólos vitícolas do estado. O método possibilitou caracterizar de forma quantitativa a severidade do míldio da videira, tanto espacialmente, entre as regiões do estado, como temporalmente, ao longo dos meses, diferenciando de forma adequada os municípios estudados.
Palavras-chave:Vitis spp., Sistema de Informações Geográficas, temperatura, umidade relativa, duração
INTRODUCTION
Viticulture is very important in Brazil, especially for the states located in the northeast, southeast and south of the country. The Brazilian grape production for 2006 totalized 1,228 million tons, and the State of São Paulo was responsible for approximately 16% of
this production, mainly destined for in natura
con-sumption (Mello, 2007).
Diffusion limits for grapes, in different regions of the world are mostly conditioned by climatic fac-tors, particularly temperature, light intensity, air humid-ity and water availabilhumid-ity, since these factors have a direct influence on plant growth rate and also on the incidence of diseases (Teixeira & Azevedo, 1996). Among the fungal diseases affecting grapes in Brazil,
downy mildew caused by Plasmopara viticola is
con-sidered the main disease for this crop, as it can re-duce the production by 75% (Amorim & Kuniyuki, 2005). This disease is associated to significant losses caused by total or partial destruction of inflorescences, fruits, and by the premature fall of the leaves (Sônego et al., 2005). Among the several factors affecting the life cycle of this pathogen, rain associated to leaf wet-ness duration is considered the main epidemiological factor, while temperature exerts a moderating role, slowing down or speeding up the development of the disease (Sônego et al., 2005).
Since this disease plays a major role for grapes, several studies have been performed in an at-tempt to analyze its spatial pattern, through the use of mathematical models applied to the required conditions of the life cycle of this pathogen. Most of the current disease prediction systems are based on the estima-tive of the infection. A simple prediction system can be based on temperature and leaf wetness duration records, in order to determine whether an infection period will occur (Reis, 2004). The goals of this study were to estimate the severity of the grape downy mil-dew for the climatic conditions of the State of São Paulo using a mathematical disease model based on temperature and leaf wetness duration, and to deter-mine the spatial and temporal disease variability using the Geographical Information System (GIS) tools.
MATERIAL AND METHODS
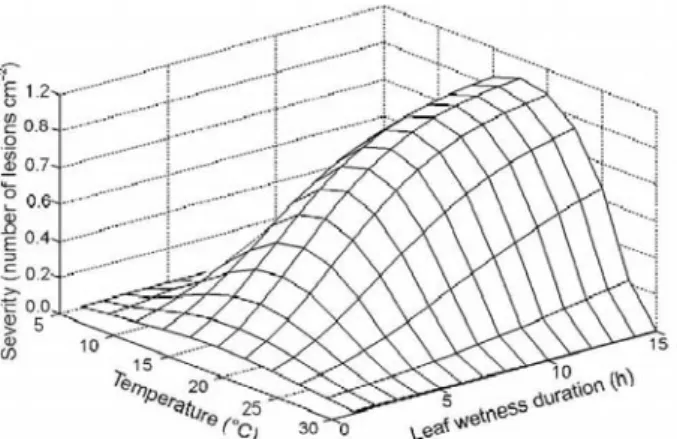
The infestation efficiency model for grape downy mildew adopted in this study was proposed by Lalancette et al. (1988), which is expressed as a non linear relationship between infection efficiency (IE), leaf wetness duration (W) and temperature (T):
IE = k* (1 + e–p)1/(1–m) (1)
where k = –0.71 + 0.018T – 0.0005T2 + 0.01,p = –
0.24W + 0.070WT – 0.0021WT2, and m = 1.2.
This model is based on the relationship of tem-perature, leaf wetness duration and infection effi-ciency. Also it assumes the presence of a susceptible host and a virulent inoculated pathogen, in such a way that the occurrence of the disease will depend on the environmental factors. Figure 1 represents the sever-ity of the grape downy mildew as a function of tem-perature and leaf wetness duration, according to the adopted model.
The period of time considered for this study was from September to April, between spring and au-tumn, when the downy mildew affects the develop-ing plant as a whole (Sônego et al., 2005). Downy mil-dew severity was estimated specifically for three vine-yard centers in the State of São Paulo (Figure 2): Jales (20.27° S, 50.55° W), Jundiaí (23.19° S, 46.88° W) and São Miguel Arcanjo (23.88° S, 47.99° W). The Geographical Information System (GIS) software,
Figure 2 - Location of the cities of Jales, Jundiaí, and São Miguel Arcanjo and the corresponding agriculture regional zones of the State of São Paulo, Brazil.
Idrisi 32, developed by the Clark University, USA, was used to create severity maps. A spatial resolution of
0.01° × 0.01° of latitude and longitude was adopted.
Temperature and relative humidity data were then en-tered into the GIS database.
Average monthly temperature was obtained from Embrapa’s Agritempo Network (Agricultural and Meteorological Monitoring System), referring to vali-dated data from 58 weather stations of the State of São Paulo and 25 stations located in neighboring states (Minas Gerais, Mato Grosso do Sul, Paraná, and Rio de Janeiro), with mean monthly values comprising varying periods of time, among the weather stations, from 1961 to 2004. The data were interpolated using the ordinary kriging method in the Surfer v. 8.02 soft-ware, made by the Golden Softsoft-ware, to obtain
sur-face maps, with a spatial resolution of 0.01º× 0.01º
of latitude and longitude.
Monthly relative humidity data were obtained from the Climatic Research Unit (2006) and refer to climatological normal from 1961 to 1990, with the
original spatial resolution of 10'× 10’ of latitude and
longitude. The ordinary kriging method and the soft-ware Surfer were used to bring in the spatial resolu-tion adopted in this study. Later, temperature and rela-tive humidity data were imported and organized within the GIS database. Leaf wetness duration was obtained by means of an equation that correlated leaf wetness duration to average relative humidity in the State of São Paulo developed by Hamada et al. (2007). Applying this equation to the GIS arithmetic operations module, maps of leaf wetness duration were obtained from relative humidity data for the State.
After climatic data were organized in the GIS, the next step included the production of maps depict-ing the severity of grape downy mildew, by applydepict-ing the disease model proposed by Lalancette et al. (1988). The estimation of infestation efficiency, defined as the
number of lesions produced by zoospores per plant, is a model created as a function of temperature and leaf wetness duration. The severity of the disease, measured as the number of lesions per square centi-meter, was obtained by multiplying the estimated in-festation efficiency by a constant (11.2), obtained ex-perimentally by Lalancette et al. (1988).
RESULTS AND DISCUSSION
When compared to Jales, the mean tempera-ture and the leaf wetness duration of Jundiaí and São Miguel Arcanjo were similar (Figure 3). Estimated val-ues of severity were lower for Jales, in relation to those found for the other two cities, which had more simi-lar disease intensity (Figure 4). Severity values for Jales oscillated throughout the months, but the values were lower than in Jundiaí and in São Miguel Arcanjo,
rang-ing from 0.07 and 0.23 lesion cm–2. In Jundiaí and São
Miguel Arcanjo, however, severity increased during the months of September and October, and from
Febru-ary to April, reaching a maximum of 0.70 lesion cm–2,
and decreased during October to February, reaching a minimum number of lesions. During the month of September and from December to February, differ-ences in disease severity were observed between Jundiaí and São Miguel Arcanjo. This finding calls at-tention to the fact that in the Lalancette et al. (1988) model, greater importance is given to leaf wetness du-ration for estimating disease severity than to average temperature.
In Jales, the lower severity values generally oc-curred because of higher temperatures, which do not favor the infectious process, for which the ideal tem-perature is between 18ºC and 22ºC (Amorim & Kuniyuki, 2005). Moreover, from September to November, in Jales, smaller values for leaf wetness duration also con-tributed to reduce disease severity (Figure 4).
Figure 3 - Mean temperature (a) and mean leaf wetness duration (b) throughout the months of the year, in Jales, Jundiaí, and São Miguel Arcanjo - SP.
18 20 22 24 26 28
Sept Oct N o v Dec J a n Feb Mar Apr Months
Mean temperature (ºC)
Jales Jundiaí São Miguel Arcanjo
0 2 4 6 8 10
Sept Oct N o v Dec J a n F e b Mar Apr Months
Mean leaf wetness duration (h)
Jales Jundiaí São Miguel Arcanjo
Estimates of the severity of grape downy mil-dew varied according to the regions of the State of São Paulo and throughout the considered months, with seasonal differences (Figure 5). In general, the north-west region of the State presented the smallest sever-ity, while severity was greater for all the months to-wards the southeast region. In the northwest region, the smallest severity was noted during October, along with a gradual increase for the following months. In the southeast, however, on the contrary to northwest region of the State, this pattern for severity was not observed. The higher downy mildew severity, on the average, for this region, was found for the months of September, October and April. Towards the south of the southeast region, disease severity was more intense during September; in the north, the highest severity occurred during April.
Figure 4 - Severity of grape downy mildew from September to April, estimated by the Lalancette et al. (1988) model, in Jales, Jundiaí, and São Miguel Arcanjo - SP. 0.0
0.1 0.2 0.3 0.4 0.5 0.6 0.7 0.8
Sept Oct Nov Dec Jan Feb Mar Apr
Months
Severity (number of lesion cm
-2)
Jales Jundiaí São Miguel Arcanjo
Figure 5 - Estimated values of severity for grape downy mildew (number of lesion cm-2) using the Lalancette et al. (1988) model for the
The disease management generally requires the use of fungicides applied several times during the growing season. The influence of climatic factors on
fungicide efficacy to control downy mildew in Vitis
vinifera was evaluated by Czermainski & Sônego (2004) in Bento Gonçalves, State of Rio Grande do Sul, Brazil. Protective fungicides, alone or in mixtures, were efficient to control the disease on bunches only under low disease pressure caused by non favorable environmental conditions and systemic fungicides were required under favorable conditions.
An expert agrometeorological system to
evalu-ate the development of P. viticola on the north-east
Italy and the western part of Slovenia, on a territorial scale, was proposed by Dalla Marta et al. (2007). In a similar way, as adopted in this study, weather data were organized into grids using inputs as leaf wetness duration and a disease model was applied to obtain the risk maps. The system allowed better use of weather (temperature, rainfall, and leaf wetness) and epidemio-logical data (number of infections) showed as maps capable of supplying end users with detailed informa-tion, which is useful for planning and management of grapevine protection activities.
The methodology adopted in this study allowed quantifying the severities of grape downy mildew, showing the variation among the regions of the State and among the months of the year, allowing distinguish-ing the three main vineyard regions in relation to dis-ease risk. At the regional level, the results can be use-ful for management strategies. On the other hand, at the local level, however, the limitations of the model should be considered in connection to the used weather data. The relationship between environmental factors and resulting infection or sporulation depends on the grape species or cultivar and the climatic factors and their interactions. The infection efficiency model for P. viticola obtained by Lalancette et al (1988) was de-termined for the American grape (Vitis lambrusca) ex-pressed as a function of temperature and leaf wetness duration. The disease development, although, can also be affected by other meteorological factors and the model was developed using data under controlled con-ditions in laboratory. On the other hand, climate fac-tors can affect the other stages of disease cycle, as survival, dispersal and maturation of propagules, and
their maturation in growing season, not considered by the model. Besides these restrictions, the model was efficient to compare regions to yield maps that can be used for planning purposes.
ACKNOWLEDGEMENTS
To CNPq, for grant and scholarship given to authors, and to Embrapa (Macroprograma), for finan-cial support.
REFERENCES
AMORIM, L.; KUNIYUKI, H. Doenças da videira (Vitis spp.). In:
KIMATI, H.; AMORIM, L.; BERGAMIN FILHO, A.; CAMARGO, L.E.A.; REZENDE, J.A.M. Manual de fitopatologia: doenças das plantas cultivadas. São Paulo: Agronômica Ceres, 2005. v.2, p.639-651.
CLIMATIC RESEARCH UNIT. Ten minute climatology: relative humidity. Available at: http://www.cru.uea.ac.uk/cru/data/ tmc.htm. Accessed 10 May 2006.
CZERMAINSKI, A.B.C.; SÔNEGO O.R. Influência das condições climáticas sobre a eficácia de fungicidas empregados para o controle do míldio emVitis vinifera.Ciência Rural, v.34,
p.5-11, 2004.
DALLA MARTA, A.; GANI, M.; CICOGNA, A.; DIETRICH, S.; ORLANDINI, S.; SANTORELLI, E. Transboundary system for grapevine downy mildew risk evaluation on a territorial scale (P. Rada project).EPPO Bulletin, v.37, p.290-294, 2007. HAMADA, E.; GHINI, R.; FERNANDES, J.L.; PEDRO JÚNIOR,
M.J.; ROSSI, P. Estimativa de duração do período de molhamento foliar no estado de São Paulo. In: CONGRESSO BRASILEIRO DE AGROMETEOROLOGIA, 15., Aracaju, 2007. Anais.
Piracicaba: Sociedade Brasileira de Agrometeorologia, 2007. p.1-5. CD-ROM.
LALANCETTE, N.; ELLIS M.A.; MADDEN, L.V. Development of an infeccion efficiency model for Plasmopara viticola on
american grape based on temperature and of leaf wetness.
Phytopathology, v.78, p.794-800, 1988.
MELLO, L.M.R. Vitivinicultura brasileira: panorama 2006. Bento Gonçalves: Embrapa Uva e Vinho, 2007. 3p. Available a t : h t t p : / / w w w . c n p u v . e m b r a p a . b r / p u b l i c a / a r t i g o s / panorama2006_vitivinicultura.pdf. Accessed 13 Apr., 2007. REIS, E.M. Previsão de doenças de plantas. Passo Fundo: UPF,
2004. 316p.
SÔNEGO, O.R.; GARRIDO, L.R.; GRIGOLETTI JÚNIOR, A.
Principais doenças fúngicas da videira no sul do Brasil.
Bento Gonçalves: Embrapa Uva e Vinho, 2005. 32p. (Circular Técnica, 56). Available at: http://www.cnpuv.embrapa.br/publica/ circular/ cir056.pdf. Accessed 8 May 2007.
TEIXEIRA, A.H.C.; AZEVEDO, P.V. Zoneamento agroclimático para videira européia no Estado de Pernambuco, Brasil. Revista Brasileira de Agrometeorologia, v.4, p.139-145, 1996.