ISSN 0104-6632 Printed in Brazil
www.abeq.org.br/bjche
Vol. 33, No. 03, pp. 691 - 698, July - September, 2016 dx.doi.org/10.1590/0104-6632.20160333s20150135
Brazilian Journal
of Chemical
Engineering
UTILIZATION OF CO
2
IN SEMI-CONTINUOUS
CULTIVATION OF
Spirulina
sp. AND
Chlorella fusca
AND EVALUATION OF BIOMASS COMPOSITION
J. B. Moreira
1, A. L. M. Terra
1, J. A. V. Costa
2and M. G. Morais
1*1Universidade Federal do Rio Grande, Escola de Química e Alimentos, Laboratory of Microbiology
and Biochemical, Av. Itália km 8, Bairro Carreiros, 96203-900, Rio Grande - RS, Brazil. *E-mail: [email protected]
2Universidade Federal do Rio Grande, Escola de Química e Alimentos, Laboratory of Biochemical
Engineering, Av. Itália km 8 Bairro Carreiros, 96203-900, Rio Grande - RS, Brazil.
(Submitted: February 28, 2015 ; Revised: November 21, 2015 ; Accepted: December 28, 2015)
Abstract - Cultivation conditions and the process considerably influence the composition of microalgae. The objective of this study was to use CO2 as a carbon source in semi-continuous cultivation of Spirulina sp. LEB
18 and Chlorellafusca LEB 111 and to evaluate the influence of the renewal rate on the biomass composition and production of these microalgae. Spirulina sp. LEB 18 and Chlorella fusca LEB 111 were cultivated with 10% (v/v) CO2. The blend concentration was 1.6 g L-1, and 20 and 40% (v/v) renewal rates were studied.
Spir-ulina sp. LEB 18 presented the best kinetic results and the maximum biomass concentration and biopolymer yield when grown with CO2 as the carbon source. Under the same conditions (10% (v/v) CO2), the microalgae
Spirulina sp. LEB 18 and Chlorella fusca LEB 111 exhibited maximum levels of protein, carbohydrates and lipids.
Keywords: Bioproducts; Semi-continuous process; Sustainability.
INTRODUCTION
The rising price of fossil fuels, the environmental impact of gaseous emissions, the improper disposal of polymers of petrochemical origin and the waste of raw materials have led to the demand for renewable resources and technologies that meet the needs of the world market (Antunes and Silva, 2010).
Microalgae are considered to be an efficient bio-logical system for capturing solar energy and for the production of organic compounds. Microalgae can be produced throughout the year, requiring little wa-ter compared to wa-terrestrial plants. The biochemical composition of microalgae can be manipulated by changing the growth conditions and environmental stresses (Hu et al., 2008), inducing the production of high concentrations of commercially important bio-compounds (Brennan and Owende, 2010).
The mode of operation is directly related to the biotechnological process, because the microorganism needs appropriate conditions to stimulate the synthe-sis of the desired product (Henrard et al., 2014). The microalgal biomass has high concentrations of lipids, proteins and carbohydrates, which can be used for different applications. When the full potential of the microalgal biomass constituents is exploited, many byproducts can be obtained simultaneously and the market value is greater than the production costs (Wijffels et al., 2010).
of carbon that originate from industrial effluents (CO2) to reduce production costs.
The objective of this study was to use CO2 as a carbon source in semi-continuous cultivation of Spirulina sp. LEB 18 and Chlorella fusca LEB 111 and to evaluate the influence of the renewal rate on the biomass composition and production of these microalgae.
MATERIALS AND METHODS
Microalgae and Growing Conditions
The microalgae used in this study were Spirulina sp. LEB 18 (Morais et al., 2008) and Chlorella fusca LEB 111 isolated from ponds near the region of the Presidente Médici Thermoelectric Station, Candiota-RS (Morais and Duarte, 2012). Spirulina sp. LEB 18 cultures were grown in Zarrouk medium (Zarrouk, 1966) and modified Zarrouk medium, which was modified by replacing the original source of carbon (16 g L-1 de NaHCO3) by 10% (v/v) CO2. The micro-algae Chlorella fusca LEB 111 were grown in BG-11 medium (Rippka et al., 1979) that was modified by adding 0.4 g L-1 of NaHCO3. Chlorella fusca LEB 111 cultures were also studied, in which the carbon sources (Na2CO3 of the BG-11 medium and Na-HCO3) were replaced by 10% (v/v) CO2.
The cultures were carried out in duplicate under controlled conditions in a thermal chamber at 30 °C and 41.6 μmol/m² s and under a 12 h light/dark pho-toperiod, with light provided by 40 W fluorescent lamps. The initial biomass concentration in the Spir-ulina sp. LEB 18 and Chlorella fusca LEB 111 cul-tures was 0.2 g L-1. The microalgae were grown in 2 L vertical tubular photobioreactors with a working volume of 1.5 L.
Aeration was carried out by aspirating using a po-rous stone. The compressed air was mixed with CO2 in an industrial cylinder (White Martins). The input flow of the mixture into the cultures was 0.3 vvm, which was controlled using a solenoid valve. The 10% (v/v) CO2 was injected directly into the photobioreac-tors every 2 h for 10 min during the light period.
Microalgal Biomass Concentration and pH Moni-toring
Samples were collected daily to determine the concentration of biomass, which was calculated by measuring the optical density at 670 nm (Costa et al., 2002) using a spectrophotometer (Q7980RM, Quimis, Brazil) according to a calibration curve that related the optical density with the dry weight of the
micro-algal biomass. The pH was also monitored daily using a digital pH meter (Q400AS, Quimis, Brazil).
Kinetic Parameters and Biomass Produced
The specific growth rate (µx) and biomass produc-tivity (Px) (Equation (1) and (2), respectively) were determined for each growth cycle. The produced biomass (BP) was calculated using Equation (3):
x
1 dX X dt
(1)
0 x
0
X X
P
t t
(2)
n
i i f f
i 1
Bp (X V ) (X V )
(3)
where X (g L-1) is the final cell concentration in the growth cycle; X0 (g L-1) is the initial cell concentra-tion in the growth cycle; t (d) is the final time of the growth cycle; t0 is the initial time of the growth cy-cle; V (L) is the volume removed in the growth cy-cle; Xf (g L-1) and Vf (L) are the concentration of biomass and the volume at the end of the cultivation, respectively. The mean value of the specific growth rate and biomass productivity results are presented.
Characterization of the Microalgal Biomass
For each dilution during the semi-continuous cul-tivation, the microalgal biomass was recovered via centrifugation at 16920 g, and 20 °C for 20 min to separate the biomass from the culture medium. Sub-sequently, the biomass was washed with distilled water to eliminate salt residues in the culture and cen-trifuged again. Then, the microalgal biomass was re-frigerated at -20 ºC. At the end of the semi-continu-ous cultivation, the biomasses obtained at each dilu-tion were mixed together, and the samples were ly-ophilized. The lyophilized biomass was subjected to pre-treatment in an ultrasonic probe. This procedure consisted of adding 10 mL of distilled H2O to 5 mg of microalgal biomass and sonicating for 10 min in 59 s cycles (59 s on and 50 s off). The extract was ho-mogenized using a magnetic stirrer for later char-acterization analyses.
Proximate Composition
carbo-hydrate content using the phenol-sulfuric method (Dubois et al., 1956), protein content using the color-imetric method of Lowry (Lowry et al., 1951), and lipid content using the method reported by Folch et al. (1957) and adapted by Colla (2002). The moisture and ash content were determined according to the AOAC (2000) methodology. The analyses were car-ried out in triplicate, and the results are presented on a dry basis.
Biopolymer Yield
The biopolymer extraction was carried out for Spirulina sp. LEB 18 using differential digestion. The lyophilized biomass was stirred using a mag-netic stirrer (753A, Fisatom, Brazil) with sodium hypochlorite (NaOCl) 10% (v/v) and distilled water. Next, it was centrifuged (14,100 g, 20 °C for 20 min). The precipitate was washed and stirred for 10 min with distilled water, and the centrifugation process was repeated. Subsequently, the precipitate was washed with acetone while being stirred, followed by centrif-ugation (14,100 g, 15 °C for 20 min) and oven dry-ing (35 °C) for approximately 48 h (Morais, 2008).
The biopolymer yield (η) was calculated accord-ing to Equation (4), where η is the yield of biopoly-mers with respect to the microalgal biomass (%, w/w), mb is the final weight of the biopolymer (g), and m is the microalgal biomass (g).
b
m m
(4)
The extraction of biopolymers was carried out us-ing the biomass obtained from the culture with Zar-rouk medium and also from the assays with 10% (v/v) CO2, at both 20% and 40% renewal rates (v/v).
Statistical Analysis
Analysis of variance (ANOVA) was used at a confidence level of 99% (p ≤ 0.01), followed by Tukey's post-hoc test to compare the means of the growth kinetics of the results and to characterize the biomass of each microalgae.
RESULTS AND DISCUSSION
Growth of Spirulina sp. LEB 18 and Chlorella fusca LEB 111
The cultures of both types of microalgae grown with CO2 as the carbon source at a 20% renewal rate
(v/v) exhibited more growth cycles, favoring the production of microalgal biomass, compared to the assays grown with NaHCO3 (Figures 1 and 2).
(a)
(b)
Figure 1: Growth curves of Spirulina sp. LEB 18 at renewal rates of 20% (a) and 40% (b): Zarrouk me-dium (); 10% (v/v) CO2 (•).
(a)
(b)
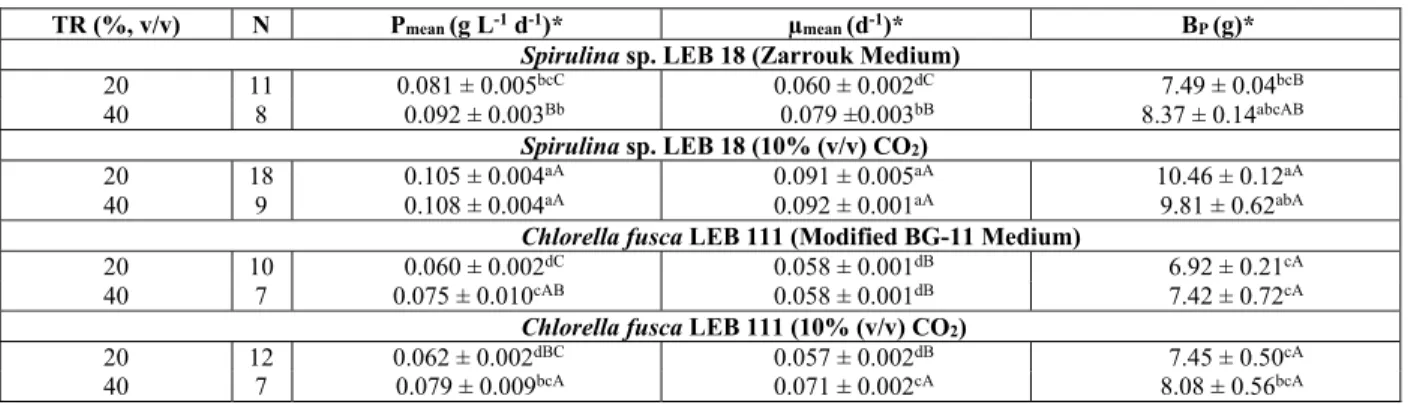
In accordance with the growth curves a linear in-crease of biomass concentration was observed in each cycle. As a consequence of a system where there is a limitation to the growth, the specific growth rate decreased during a cycle. Among the studied microalgae, Spirulina sp. LEB 18 exhibited higher productivity, specific growth rates and biomass pro-duction (Table 1).
The renovation rate of the medium in the cultures with 10% (v/v) CO2 did not influence the kinetic re-sults of Spirulina sp. LEB 18. However, it did influ-ence the results obtained for Chlorella fusca LEB 111. Thus, the semi-continuous cultivation of Spirulina sp. LEB 18 can reduce the cost of nutrients during the process, as there is a lower renovation rate of the medium (20% v/v).
For both microalgae, the cultures with 10% (v/v) CO2 exhibited lower pH values. The maximum and minimum pH values were found in the assays with a renewal rate of 40% (v/v) (Table 2). However, during the cultivation, the pH values tended to stabilize around 9.0. Zeng et al. (2012) observed that high aeration
with CO2 resulted in a reduction of the culture pH during cultivation. However, the control experiments also exhibited stable pH profiles. According to Barsanti and Gualtieri (2006), the addition of CO2 to the culture medium is an alternative method that can be used to decrease the pH of the medium and pre-vent abrupt changes. CO2 dissolves in the medium, and the carbonic acid that is formed prevents an in-crease in pH during the growth of the microalgae.
For Spirulina sp. LEB 18 cultured in Zarrouk medium, the maximum pH was 11.20, and for Chlo-rella fusca LEB 111 cultured in modified BG-11 medium, the maximum pH was 11.59. According to Cuaresma et al. (2006), the increase in pH in photo-synthetic cultures occurs due to the biological ac-tivity of the cells, which reduces the dissolved inor-ganic carbon content due to the consumption during cell growth. Thus, there exists a displacement of the carbonate-bicarbonate equilibrium in the buffer sys-tem. The pH of the culture medium determines the forms of inorganic carbon (CO2, CO32- or HCO3-) dissolved in the liquid phase.
Table 1: Kinetic parameters and produced biomass (BP, g) obtained from the semi-continuous cultivation
of the microalgae.
TR (%, v/v) N Pmean (g L-1 d-1)* µmean (d-1)* BP (g)*
Spirulina sp. LEB 18 (Zarrouk Medium)
20 11 0.081 ± 0.005bcC 0.060 ± 0.002dC 7.49 ± 0.04bcB
40 8 0.092 ± 0.003Bb 0.079 ±0.003bB 8.37 ± 0.14abcAB
Spirulina sp. LEB 18 (10% (v/v) CO2)
20 18 0.105 ± 0.004aA 0.091 ± 0.005aA 10.46 ± 0.12aA
40 9 0.108 ± 0.004aA 0.092 ± 0.001aA 9.81 ± 0.62abA
Chlorella fusca LEB 111 (Modified BG-11 Medium)
20 10 0.060 ± 0.002dC 0.058 ± 0.001dB 6.92 ± 0.21cA
40 7 0.075 ± 0.010cAB 0.058 ± 0.001dB 7.42 ± 0.72cA
Chlorella fusca LEB 111 (10% (v/v) CO2)
20 12 0.062 ± 0.002dBC 0.057 ± 0.002dB 7.45 ± 0.50cA
40 7 0.079 ± 0.009bcA 0.071 ± 0.002cA 8.08 ± 0.56bcA
TR: renewal rate; N: growth cycle; *: Values are mean ± standard deviation; Lowercase letters in the same column represent comparisons among all tests; capital letters in the same column compare microalgae with one other; equivalent letters in the same column do not differ sta-tistically (p> 0.01) according to Tukey’s test.
Table 2: pH values of semi-continuous cultivation of microalgae.
Microalga / Assay TR
(%, v/v)
pH (Minimum)
pH (Maximum)
Spirulina sp. LEB 18 / Zarrouk Medium 20 9.74 11.20
Spirulina sp. LEB 18 / Zarrouk Medium 40 9.76 10.86
Spirulina sp. LEB 18 / 10% (v/v) CO2 20 7.51 10.03
Spirulina sp. LEB 18 / 10% (v/v) CO2 40 7.25 10,04
Chorellafusca LEB 111 / Modified BG-11 Medium 20 9.11 11.59
Chorellafusca LEB 111 / Modified BG-11 Medium 40 9.13 10.68
Chorellafusca LEB 111 / 10% (v/v) CO2 20 7.68 10.39
Chorellafusca LEB 111 / 10% (v/v) CO2 40 7.35 10.62
The CO2 concentration influenced the Spirulina sp. LEB 18 and Chlorella fusca LEB 111 microalgae cultures, as the best kinetic responses were found for 10% (v/v) CO2. For Spirulina sp. LEB 18, the in-crease in CO2 in the cultures caused a 39.7% (w/w) increase in the concentration of biomass produced, and the renewal rate was 20% (v/v). Zeng et al. (2012) also observed that Spirulina platensis micro-algae cultured with CO2 exhibited better microalgal growth compared to controls that did not contain CO2.
The kinetic responses obtained for the culture with 10% (v/v) CO2 can be explained by the uptake of CO2 gas due to the Calvin cycle. The initial reac-tion that occurs in the Calvin cycle is CO2 fixareac-tion in ribulose, which is catalyzed by the enzyme ribulose 1.5 bisphosphate carboxylase/oxygenase, known as Rubisco. Because Rubisco requires high CO2 con-centrations at its active site to maintain the carbox-ylase activity and inhibit oxygenase (Schenk et al., 2008), the addition of CO2 to cultures of microalgae provides better kinetic results.
The semi-continuous process and CO2 as a carbon source is favorable in terms of sustainability factors. For a semi-continuous cultivation, the harvesting of the product and the periodic renewal of the substrate saves time that would otherwise be spent harvesting the formed biomass, cleaning the photobioreactor and re-starting the process. The use of CO2 reduces the process costs because carbon is the most-required nutrient in microalgal cultures. CO2 can be obtained free of charge from the burning of coal, which pro-vides environmental benefits by reducing the emis-sion of this gas into the atmosphere.
Characterization of the Microalgal Biomass
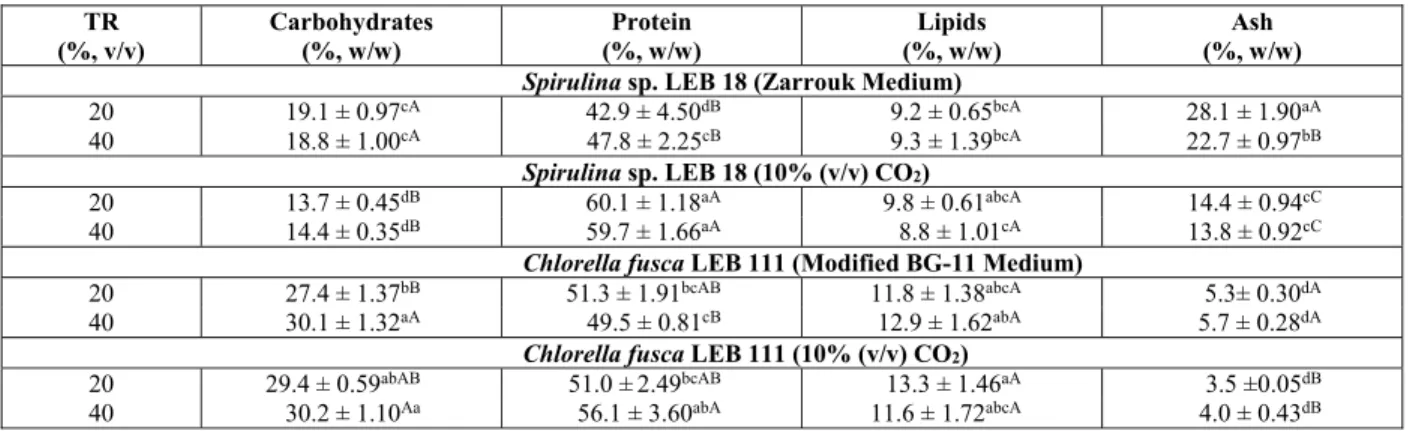
For each complete Calvin cycle, carbohydrates are produced; however, fatty acids, amino acids and organic acids may also be synthesized during the photosynthetic fixation of CO2 (Schenk et al., 2008). The microalga Chlorella fusca LEB 111 produced the maximum content of carbohydrates when culti-vated at 10% (v/v) CO2 and a renewal rate of 40% (v/v) (Table 3).
The highest protein concentrations were obtained for Spirulina sp. LEB 18 in assays using CO2 as a carbon source. Chlorella fusca LEB 111 yielded the maximum protein content in the assay with 10% (v/v) CO2 and a renewal rate of 40% (v/v), although no statistical difference (p> 0.01) was found com-pared to the higher value of Spirulina sp. LEB 18. According to Lourenço et al. (2004), if nitrogen is
abundant in cultures, the concentrations of proteins and chlorophyll in the cells tend to increase.
The analysis of the chemical composition of Spirulina sp. LEB 18 revealed an inverse relation-ship between the contents of protein and carbohy-drates. Higher levels of protein and lower levels of carbohydrates were obtained for the microalgae cul-tivated with 10% (v/v) CO2. Other studies have shown similar results. Derner (2006) reported that the use of CO2 increased the protein content, especially in cul-tures of Thalassiosira fluviatilis. Castro Araújo and Garcia (2005) found that the concentration of carbo-hydrates was lower due to the use of CO2 in cultures of Chaetoceros cf. weighamii.
The microalgae Spirulina sp. LEB 18 and Chlo-rella fusca LEB 111 exhibited the maximum lipid levels for the assays conducted with 10% (v/v) CO2 and a 20% (v/v) renewal rate. Lipid accumulation occurs when acetyl-CoA is converted to malonyl-CoA followed by fatty acids after continuous cycles, which is catalyzed by acetyl-CoA carboxylase (ACCase). The accumulation of lipids occurs in the chloro-plasts, and ACCase regulates the fatty acid synthesis by microalgae (Lv et al., 2010). In the chloroplasts, depending on the developmental stage of the cell, pyruvate dehydrogenase activity is often low. In contrast, acetyl-CoA synthetase in the chloroplasts has a high affinity for acetate and consumes adeno-sine triphosphate (ATP) to convert it to acetyl-CoA (Heldt, 2005). Thus, the addition of CO2 to the Spir-ulina sp. LEB 18 and Chlorella fusca LEB 111 cul-tures induced the rapid conversion of ATP to acetyl-CoA and initiated the biosynthesis of lipids.
Table 3: Determination of protein, carbohydrates, lipids and ash in the microalgal biomass.
TR (%, v/v)
Carbohydrates (%, w/w)
Protein (%, w/w)
Lipids (%, w/w)
Ash (%, w/w)
Spirulina sp. LEB 18 (Zarrouk Medium)
20 19.1 ± 0.97cA 42.9 ± 4.50dB 9.2 ± 0.65bcA 28.1 ± 1.90aA
40 18.8 ± 1.00cA 47.8 ± 2.25cB 9.3 ± 1.39bcA 22.7 ± 0.97bB
Spirulina sp. LEB 18 (10% (v/v) CO2)
20 13.7 ± 0.45dB 60.1 ± 1.18aA 9.8 ± 0.61abcA 14.4 ± 0.94cC
40 14.4 ± 0.35dB 59.7 ± 1.66aA 8.8 ± 1.01cA 13.8 ± 0.92cC
Chlorella fusca LEB 111 (Modified BG-11 Medium)
20 27.4 ± 1.37bB 51.3 ± 1.91bcAB 11.8 ± 1.38abcA 5.3± 0.30dA
40 30.1 ± 1.32aA 49.5 ± 0.81cB 12.9 ± 1.62abA 5.7 ± 0.28dA
Chlorella fusca LEB 111 (10% (v/v) CO2)
20 29.4 ± 0.59abAB 51.0 ± 2.49bcAB 13.3 ± 1.46aA 3.5 ±0.05dB
40 30.2 ± 1.10Aa 56.1 ± 3.60abA 11.6 ± 1.72abcA 4.0 ± 0.43dB
Results are on a dry basis. TR: Renewal rate; *: Values are mean ± standard deviation; Lowercase letters in the same column represent a comparison among all of the assays; capital letters in the same column compare each microalga with one another; equal letters in the same column do not differ statistically (p> 0.01) according to Tukey’s test.
Elucidating the kinetic parameters for the synthe-sis of biopolymers is important, and the aim is to identify strains with specific growth rates and high yields that utilize low-cost substrates and yield high concentrations of biopolymers in relation to the total dry mass. The production costs of the biopolymers are directly linked to the selection of the type of mi-croorganism and substrate (Chen, 2009; Khanna and Srivastava, 2005).
The maximum value of biopolymer yield was 7.1% (w/w), obtained by the Spirulina sp. LEB 18 assay with 10% (v/v) CO2 and a renewal rate of 40% (v/v), which was significantly different compared to the other assays (p <0.01). At a 20% (v/v) renewal rate, the yield was 3.9% (w/w). CO2 stimulated the synthesis of biopolymers by the microalga, as this nutrient was made available throughout the cultivation.
For the cultivation of Spirulina sp. LEB 18 with NaHCO3 (16.8 g L-1) as the carbon source, the bi-opolymer yield was 3.7% (w/w) for both renewal rates. In previous studies carried out by our team, we found that the optimal concentration of NaHCO3 for Spirulina in biopolymer synthesis was 8.4 g L-1. Khanna and Srivastava (2005) suggested using an excess of carbon to produce polyhydroxybutyrate (PHB). However, concentrations above 8.4 g L-1 for Spirulina produce high concentrations of nicotinamide adenine dinucleotide phosphate (NADPH), inhibiting the enzyme citrate synthase, which is responsible for the entry of acetyl-CoA into the carboxylic acids cycle, where it is available to cetatiolase. 3-β-Cetatiolase binds two molecules of acetyl-CoA to form acetoacetyl-CoA, which is reduced to (R)-3-hydroxybutyryl-CoA. Thus, PHB is synthesized by the polymerization of (R)-3-hydroxybutyryl-CoA by the
PHA synthase enzyme (Khanna and Srivastava, 2005). The assays using NaHCO3 as the carbon source yielded the required conditions for the cellular multi-plication of Spirulina sp. LEB 18. According to Lima et al. (2001), under balanced growth conditions when all nutrients necessary for cell multiplication are available, high levels of free coenzyme A (CoA) are expected. Thus, it is possible to supply the high demand for acetyl groups during the Krebs cycle for the formation of carbon skeletons and generation of energy. Free CoA inhibits the β-ketothiolase enzyme, thus preventing the synthesis of PHB. Therefore, the yields of biopolymers presented in this study, in the assays where NaHCO3 was used as the carbon source, were low compared to the assays that used CO2.
CONCLUSION
Spirulina sp. LEB 18 showed the best kinetic re-sults and maximum biomass production and yield of biopolymer when cultivated with CO2 as the carbon source. In cultivations with CO2 it was found that the renewal rate did not influence the values of kinetic parameters obtained for Spirulina sp. LEB 18. In addition, in assays with CO2 the microalgae Spirulina sp. LEB 18 and Chlorella fusca LEB 111 presented maximum levels of protein, carbohydrates and lipids. In the secontinuous cultivation of these mi-croalgae, using CO2 as the carbon source and a me-dium renewal rate of 20% (v/v) is favorable. Lower renewal rates result in lower nutrient costs for every dilution carried out. Furthermore, the use of CO2 reduces the cost of the carbon source, which is the main nutrient in the culture, and also reduces the negative environmental effects cause by the emission of this gas into the atmosphere.
ACKNOWLEDGEMENT
The authors would like to thank the CNPq (Na-tional Council of Technological and Scientific De-velopment) and CGTEE (Company of Thermal Gen-eration of Electric Power) for their financial support of this study.
NOMENCLATURE
BP Produced biomass (g) m Microalgal biomass (g)
mb Final weight of the biopolymer (g) N Growth cycle
Px Biomass productivity (g L-1 d-1)
Pmean Mean value of the biomass productivity (g L-1 d-1)
t Final time of the growth cycle (d) t0 Initial time of the growth cycle (d) TR Renewal rate (%)
V Volume removed in the growth cycle (L) Vf Volume at the end of the cultivation (L) X Final cell concentration in the growth
cycle (g L-1)
X0 Initial cell concentration in the growth cycle (g L-1)
Xf Concentration of biomass at the end of the cultivation (g L-1)
Biopolymer yield (%)
μx Specific growth rate (d-1)
μmean Mean value of the specific growth rate (d-1)
REFERENCES
Antunes, R. and Silva, I. C., Utilização de algas para a produção de biocombustíveis. Instituto Nacio-nal da Propriedade Industrial – INPI (2010). (In Portuguese).
AOAC, Association of Official Analytical Chemists, Official Methods of Analysis of the Association of Official Analytical Chemists, 17th Ed., Horwitz, W., Maryland (2000).
Barsanti, L. and Gualtieri, P., Algae: Anatomy, Bio-chemistry, and Biotechnology. Boca Raton: Taylor & Francis (2006).
Brennan, L. and Owende, P., Biofuels from micro-algae – a review of technologies for production, processing, and extractions of biofuels and co-products. Renewable and Sustantable Energy Reviews, 14(2), 557-577 (2010).
Carlson, R., Wlaschin, A. and Srienc, F., Kinetic studies and biochemical pathway analysis of an-aerobic poly-(R)-3-hydroxybutyric acid synthesis in Escherichia coli. Applied and Environmental Microbiology, 71(2), 713-720 (2005).
Castro Araújo, S. and Garcia, V. M., Growth and biochemical composition of the diatom Chae-toceros cf. wighamii brightwell under different temperature, salinity and carbon dioxide levels. I. Protein, carbohydrates and lipids. Aquaculture, 246(1-4), 405-412 (2005).
Chen, G. Q., A microbial polyhydroxyalkanoates (PHA) based bio- and materials industry. Chemi-cal Society Reviews, 38(8), 2434-2446 (2009). Colla, L. M.,Influencia das condições de crescimento
sobre o potencial antioxidante da microalga Spi-rulina platensis e seu potencial na redução da hipercolesterolemia. Masters Dissertation, Federal Foundation University of Rio Grande, Rio Grande (2002). (In Portuguese).
Costa, J. A. V., Colla, L. M., Duarte Filho, P., Kabke, K. and Weber, A., Modelling of Spirulina platen-sis growth in fresh water using response surface methodology. World Journal of Microbiology and Biotechnology, 18(7), 603-607 (2002).
Cuaresma, M., Garbayo, I., Vega, J. M. and Vílchez, C., Growth and photosynthetic utilization of inor-ganic carbon of the microalga Chlamydomonas acidophila isolated from Tinto river. Enzyme and Microbial Technology, 40(1), 158-162 (2006). Derner, R. B., Efeito de fontes de carbono no
Dubois, M., Gilles, K. A., Hamilton, J. K., Rebers, P. A. and Smith, F., Colorimetric method for deter-mination of sugars and related substances. Ana-litical Chemistry, 28(3), 350-356 (1956).
Folch, J., Less, M., and Stanley, G. H. S., A simple method for isolation and purification of total lipids from animal tissues. Journal of Biological Chemistry, 226(1), 497-509 (1957).
Heldt, H. W., Plant Biochemistry. 3th Ed. San Diego, Elsevier Academic Press, p. 629 (2005).
Henrard, A. A., Rosa, G. M., Moraes, L., Morais, M. G. and Costa, J. A. V., Effect of the carbon con-centration, blend concon-centration, and renewal rate in the growth kinetic of Chlorella sp. The Sci-entific World Journal, 2014, 1-9 (2014).
Hu, Q., Sommerfeld, M., Jarvis, E., Ghirardi, M., Posewitz, M., Seibert, M. and Darzins, A., Micro-algal triacylglycerols as feedstocks for biofuel production and advances. The Plan Journal, 54(4), 621-639 (2008).
Khanna, S. and Srivastava, A. K., Recent advances in microbial polyhydroxyalkanoates. Process Bio-chemistry, 40(2), 607-619 (2005).
Lima, U. A., Aquarone, E., Borzani W. and Sch-midell, W., Biotecnologia Industrial Processos Fermentativos e Enzimáticos, São Paulo: Edgard Blücher, 3, p. 593 (2001). (In Portuguese). Lourenço, S. O., Barbarino, E., Lavín, P. L., Marquez,
U. M. L. and Aidar, E., Distribution of intracelular nitrogen in marine microalgae. Calculation of new nitrogen-to-protein conversion factors. European Journal of Phycology, 39(1), 17-32 (2004).
Lowry, O. H., Rosebrough, N. J., Farr, A. L. and Randall, R. L., Protein measurement with the folin phenol reagent. Journal of Biological Chemistry, 193, 265-275 (1951).
Lv, J. M., Cheng, L. H., Xu, X. H., Zhang, L. and Chen, H. L., Enhanced lipid production of Chlo-rella vulgaris by adjustment of cultivation con-ditions. Bioresource Technology, 101(17), 6797-6804 (2010).
Marzan, L. W. and Shimizu, K., Metabolic regulation of Escherichiacoli and its phoB and phoR genes knockout mutants under phosphate and nitrogen limitations aswell as at acidic condition. Micro-bial Cell Factories, 39, 10(1-15) (2011).
Miyake, M., Erata, M. and Asada, Y., A thermophilic cyanobacterium, Synechococcus sp. MA19,
ca-pable of accumulating poly-β-hydroxybutyrate. Journal of Fermentation and Bioengineering, 82(5), 512-514 (1996).
Morais, E. G. and Duarte, J. H., Isolamento de micro-algas para biofixação de CO2 proveniente de geração termelétrica. Graduation Project (Food Engineering), Federal University of Rio Grande, Rio Grande (2012). (In Portuguese).
Morais, M. G., Bioengenharia microalgal na uti-lização de gás de combustão e extração de biopo-límeros para desenvolvimento de nanofibras. PhD Thesis, Federal University of Rio Grande, Rio Grande (2008). (In Portuguese).
Morais, M. G., Reichert, C. C., Dalcanton, F., Du-rante, A. J., Marins, L. F. and Costa, J. A. V., Iso-lation and characterization of a new Arthrospira strain. Zeitschrift für Naturforschung C. 63(1-2), 144-150 (2008).
Nishioka, M., Nakai, K., Miyake, M., Asada, Y., and Taya, M., Production of poly-β-hydroxybutyrate by thermophilic cyanobacterium, Synechococcus sp. MA19, under phosphate-limited conditions. Biotechnology Letters, 23(14), 1095-1099 (2001). Rippka, R., Deruelles, J., Waterbury, J. W., Herdman, M. and Stanier, R. G., Generic assignments, strain histories and properties of pure cultures of Cyanobacteria. Journal of General Microbiology, 111(1), 1-61 (1979).
Schenk, P. M., Thomas-Hall, S. R., Stephens, E., Marx, U. C., Mussgnug, J. H., Posten C., Kruse, O. and Hankamer, B., Second generation biofuels: high-efficiency microalgae for biodiesel produc-tion. Bioenergy Research, 1(1), 20-43 (2008). Wijffels, R. H., Barbosa, M. J. and Eppink, M. H.
M., Microalgae for the production of bulk chemi-cals and biofuels. Biofuels, Bioproducts and Bio-refining, 4(3), 287-295 (2010).
Zarrouk, C., Contribuition a Letude Dune Cyano-phycee, Influence de Divers Facteurs Physiques et Chimiques sur la Croissance et Photosynthese de Spirulina maxima Geitler. Ph.D. Thesis Uni-versity of Paris (1966). (In French).