Application of general method for design of concrete
columns and encased composite steel and concrete
columns
Aplicação do método geral para dimensionamento de
pilares de concreto e pilares mistos de aço e concreto
totalmente revestidos
Abstract
Resumo
The purpose of this work is the development and implementation of a numerical procedure for the design of reinforced concrete columns (RC) and composite columns with fully concrete encased steel I-section (SC). For this purpose, a computer program was developed to determine the load capacity of these columns, applying the General Method adopted by ABNT NBR 6118:2014. The program is based on an iterative process from integration of the curvatures along the column, obtained by determining the moment-curvature relationship of the cross section by the Newton-Raphson method. Several experimental and numerical results are compared to the program’s to demonstrate the accuracy of the procedure.
Keywords: reinforced concrete columns, composite steel and concrete columns, general method.
O propósito deste trabalho é o desenvolvimento e implementação de um procedimento numérico voltado para o dimensionamento de pilares de concreto armado e pilares mistos de aço e concreto totalmente revestidos. Assim, foi desenvolvido um procedimento computacional para a determinação da capacidade resistente desses pilares, a partir do Método Geral adotado pela ABNT NBR 6118:2014. O programa emprega um processo iterativo a partir da integração das curvaturas ao longo do pilar, obtidas através da determinação da relação momento-curvatura da
seção transversal pelo método de Newton-Raphson, com base em um modelo discreto de ibras. Diversos resultados numéricos e experimentais são utilizados em comparações para comprovação da eicácia do procedimento implementado.
Palavras-chave: pilares de concreto armado, pilares mistos de aço e concreto, método geral.
L. E. A. CHAVES a
R. B. CALDAS a
R. H. FAKURY a
R. J. PIMENTA b
1. Introduction
The purpose of this work is the development and implementation of a general procedure for the design of reinforced concrete col-umns (RC) and composite colcol-umns with fully concrete encased steel I-section (SC).
A calculation model in accordance with the ABNT NBR 6118:2014 [1] General Method was implemented in order to evaluate the bearing capacity of reinforced concrete columns and composite columns according to the same parameters comparisons.
The program is based on an iterative process from integration of the curvatures along the column, obtained by determining the moment-curvature relationship of the cross section by the
Newton-Raphson method, based on a discrete iber model. Several ex -perimental and numerical results are compared to the program’s to
verify the eiciency of the procedure.
2. Computational implementation
The program CSTMI, Calculation of Composite Cross Sections, was developed by Caldas and Sousa Jr. [2] with the purpose of analyzing generic composite cross sections at ambient (Caldas
[3]) and elevated temperature (Caldas [4]).
The main algorithms implemented in CSTMI are: algorithms for obtaining moment-curvature relationship; algorithms for obtaining the deformed cross section according to the applied axial force and moments; algorithms for obtaining axial force-moment interaction surface and interaction surface of moments for a given axial force;
and algorithms for obtaining 3D surface interaction to axial force
and moments.
A iber model is applied in the program for the integration of stress -es and determination of r-esistanc-es. In general, this method con-sists of discretization of the cross section in small elements (called
ibers), and each of them can assume a constitutive model.
The stress-strain relationships for concrete and steel are consid-ered according to ABNT NBR 6118:2014 [1]. The reinforcing steel properties are considered separately and are not included in the
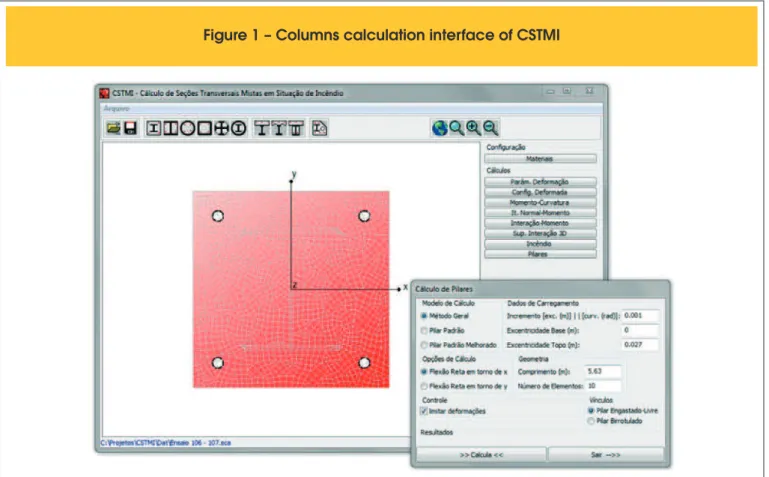
iber mesh. Simply put, the concrete areas occupied by reinforce -ments are not deducted from the discretized cross section. All meshes are generated with the assistance of GMSH program [5], which uses a text output from CSTMI as geometry data entry and discretizes the cross section to elements of three and four sides. The program interface for columns calculation developed for this study and the discretized cross section are shown in Figure 1.
The solution by the General Method consists of inding the equi -librium of internal forces to external forces applied in all cross
sec-tions along the column, considering the efects of material and
geometric nonlinearity.
Only columns subjected to axial load and moment about one axis were considered in this study. The methodology to calculate col-umns is based on the numerical integration of the curvatures tained from moment-curvature relationship. Thus, the program ob-tains an initial displacement of the column, leading to its deformed shape. The process is then repeated, considering the second order
efects, until the convergence of displacements, subsequently get
-ting a inal equilibrium set-ting.
Using the Newton-Raphson method, Caldas [3] has implemented
an algorithm for determining the moment-curvature relationship by the control of applied moments (load control), given by increments of applied moment in the section.
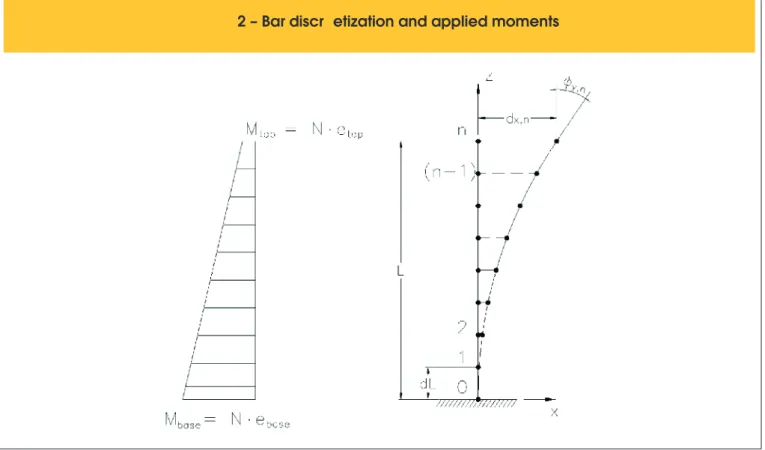
In the implementation of this work the geometry of the column is
simpliied as a bar formed by a inite number of elements informed
by the program user, as shown in Figure 2. The calculations of the
equilibrium section are performed for each node of the bar.
Consider a restrained-free column with predeined cross-section
and reinforcement subjected to an axial compressive load NSz. By the load control algorithm, the program obtains a
moment-curva-ture relationship as shown in Figure 3.
It is considered that the moments are applied only at the ends of the bar, by top and base eccentricity as shown in Figure 2. The axial force and moments (only about one axis) are applied to the geometrical center of the cross section and balanced on each node of the bar, so the accuracy of the model increases as more elements are used.
The applied moment of the bar at undeformed condition, on each node i, can be written as:
(1)
(
)
ii base top base
z
M
M
M
M
L
=
+
-where Mbase and Mtop are, respectively, the moments applied at the base and top of the column; zi is the element position; and L is the length of the bar.
The program builds a position vector with the coordinates of the nodes and a vector with the applied moments corresponding to them. By introducing each point of the vector of applied moments at the moment-curvature relationship and interpolating linearly, the program obtains a vector with the corresponding curvatures for each node of the bar.
The rotation ϕy(z) of the cross section at any point can be obtained by integrating the curvatures k(z) along the length of the bar:
(2)
Applying the boundary condition ϕy(0) = 0 in equation (2) leads to C1 = 0. Numerically, the integration of curvature is obtained by the sum of the areas under the graph formed by the points of the curvatures vector.
From the integration of the curvatures the program builds a vector with the rotations ϕiof the nodes obtained with equation (3):
(3)
where ki and ki-1 are, respectively, the curvatures at the availed and at the previous node; zi and zi-1 are respectively the positions of the availed and of the previous node; and ϕi-1 is the rotation of the
previous node. The equation (3) is valid for i ≥ 1. The node 0 has
null rotation, ϕy(0), which is determined by the boundary conditions. The transversal displacement dx(z) of the column’s axis is obtained by double integration of the curvatures, ie., by simple integral of the
rotations of the cross section, according to equation (4):
(4)
Applying the boundary condition dx(0) = 0 in equation (4) leads to C2 = 0. The reasoning for obtaining numerical integration of the rotations is identical to that used for the integration of curvatures.
The program builds a vector with the displacements of the nodes, given by:
(5)
where ϕi and ϕi-1 are, respectively, the rotations at the availed and at the previous node; zi and zi-1 are, respectively, the positions of the availed and of the previous node; and di-1 is the displacement of the previous node.
Then, it is obtained by this process the deformed position of the cross sections at the nodes from the undeformed position. A sec-ond iteration is executed from the deformed position of the
col-umn, now considering the additional efects due to the column’s displacement (second order efects). The applied moment in the
deformed condition at node i is given by:
(6)
where di is the displacement obtained at the previous iteration for the node under consideration; and dn the displacement obtained at the previous iteration to the top of the column.
The increase of the applied moments in the second iteration
re-sults in a new deformed coniguration of each cross section of the
bar, which, in turn generates a new displaced position of the nodes and increases their moments. This process is repeated until the occurrence of one of the following situations:
a) convergence of the procedure for a given tolerance; b) instability of the bar by excessive displacement;
c) failure of the material due to the occurrence of stresses exceeding the standards limits.
It was observed that the occurrence of items b and c is perceived by the fact that the applied moment considered is above the mo-ment-curvature relationship, not being possible in this case to get a curvature corresponding to the moment.
The same formulation of restrained-free columns is adopted for the calculation of simple supported columns, but it uses half of the bar length value in the calculations (Figure 4), since the buckling
coeicient K of those columns is equal to 1.0, compared to the value of K = 2.0 in restrained-free columns. It is emphasized that
this symmetry condition must also be assumed to the applied dia-gram of bending moments.
Based on this iterative process, it is possible to identify if the col-umn resists the axial force and moments applied.
To obtain the column resistance, it was developed a second algo-rithm based on the plastic resistance of cross section and repeat-ing the foregorepeat-ing process. First, the plastic resistance of the cross section in axial compression, NREF, is obtained by:
(7)
Figur
4 – Symmetry condition for simple
e
where Aa, Ac and As are, respectively, the areas of steel I-section, concrete and reinforcements; fya, and fys are, respectively, the yield stresses of steel I-section and reinforcements; and fck is the com-pressive characteristic strength of concrete.
To determine the moment-curvature relationship the program starts considering an applied axial force NSz equal to 10% of the plastic resistance NREF. If the process results in convergence,
the program increases the applied force in more 10% of NREF, and so on until convergence is not reached. From this point,
cuts of 1% of NREF are made until there is convergence of the
model again, yielding then, with 1% precision of NREF, the
col-umn axial force resistance.
3. Validation of results
3.1 Reinforced concrete columns
To validate the procedure for calculation of reinforced concrete col-umns implemented via CSTMI, the authors have modeled colcol-umns subjected to combined compression and uniaxial bending studied by Araújo [6], who compared theoretical results obtained from a computer program implemented by him to results of several experi-ments by other researchers.
It is emphasized that, as a comparison with tests, all partial factors
were considered unit. He also speciied as unitary the value of α,
reduction factor on the characteristic strength of the concrete due
to the long-term efects (Rüsch efect). The tested columns were
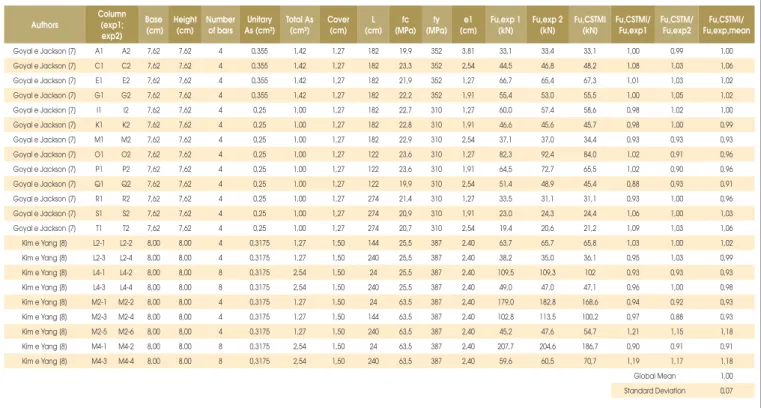
Table 1 shows the test results compared to the results obtained by CSTMI.
In both tests performed by Goyal and Jackson [7], and in those performed by Kim and Yang [8], two columns with the same geo
-metric characteristics and material (for example, the irst line of
the Table, columns A1 and A2) were evaluated for each series. Thus, there are two experimental results, Fu,exp1 and Fu,exp2, for each column series.
Samples of columns of the same series can be considered de-pendent on each other, thus should not be evaluated separately in order to not violate the principle of statistical independence. In this case, it may be used only the value of Fu exp1, or only Fu, exp2, or the average of the two values. It was evaluated the data of the ratios R = Fu, CSTMI/Fu, EXP1 and R = Fu, CSTMI/Fu, EXP2 for the couple of tests with the same characteristics, and it can be concluded that it is possible to take the average between the tests since
they do not difer (p-value = 0.357, from the paired t-test at 5% signiicance).
The histogram of Figure 5 shows the frequency distribution for the
R mean values obtained for each tested pair of columns (for ex-ample, A1 and A2). It was observed that the distribution is normal
(p-value > 0.15, using the Kolmogorov-Smirnov test).
The average value of the ratios R = Fu, CSTMI/Fu, EXP was 1.0, with a
standard deviation of 0.07. In order to verify that the theoretical value calculated by CSTMI is equivalent to the test values, it was performed the t-test to compare if the average is equal to 1.0. The p-value found was 0.887, indicating that the average value does
Table 1 – Comparison of resistance for reinforced concrete columns by tests and CSTMI
Authors Column (exp1; exp2) Base (cm) Height (cm) Number of bars Unitary As (cm²)
Total As (cm²) Cover (cm) L (cm) fc (MPa) fy (MPa) e1 (cm) Fu,exp 1 (kN) Fu,exp 2 (kN) Fu,CSTMI (kN) Fu,CSTMI/ Fu,exp1 Fu,CSTM/ Fu,exp2 Fu,CSTMI/ Fu,exp,mean
3.2 Fully encased composite columns
Composite columns subjected to combined compression and
uni-axial bending studied by Kim [9] were modeled to validate the pro -cedure of calculation of fully concrete encased steel I-section (SC) implemented at CSTMI program. The author raised an extensive database of experimental results of several researchers [10 to 16]
with samples of fully encased composite columns, concrete-illed
circular, and rectangular hollow sections.
The results of fully encased composite columns were divided into two categories: columns with 119 tests of bars subjected to axial
compression; and beams-columns, with 136 tests of bars subject -ed to combin-ed compression and uniaxial bending.
Since it is required an initial eccentricity to start the iterative pro -cess for the calculation of the column resistance, the category col-umns samples were disregarded. It was also removed the tests of beams-columns, beams with low density concrete, without rein-forcement bars, and specimen with the occurrence of biaxial
bend-ing, remaining a sample of 87 experiments.
The tests were performed in simply supported columns with axial compression and lateral forces producing a constant bending mo-ment along the bar. As the tests of reinforced concrete columns, it was also considered for the concrete of the composite columns
the factor α = 1.0. All columns were divided into 10 longitudinal ele
-ments and the cross section was divided into ele-ments of 3 and 4
sides of approximately 10 mm.
Kim has compared the experimental data with the theoretical cal
-culation from the procedures of ANSI/AISC 360-05 [17] (identical to ANSI/AISC 360-10 [18]) and EN 1994-1-1:2004 [19]. Table 3
lists the tests evaluated, with the characteristics of the columns, the applied eccentricities and the experimental resistance. It is also presented the R = NR,EXP/NR, TEO ratios for each of the standards and with the use of CSTMI program.
It is observed that the R ratios for all of the evaluated methods pre-sented great variability (for CSTMI the lowest value was R = 0.58
and the highest, R = 1.56). This shows the diiculty to calibrate a numerical method to results so diferent. With the elimination of outliers in the same test group (tests 106 to 109 of Han, 1992), the sample was reduced from 87 to 83 columns.
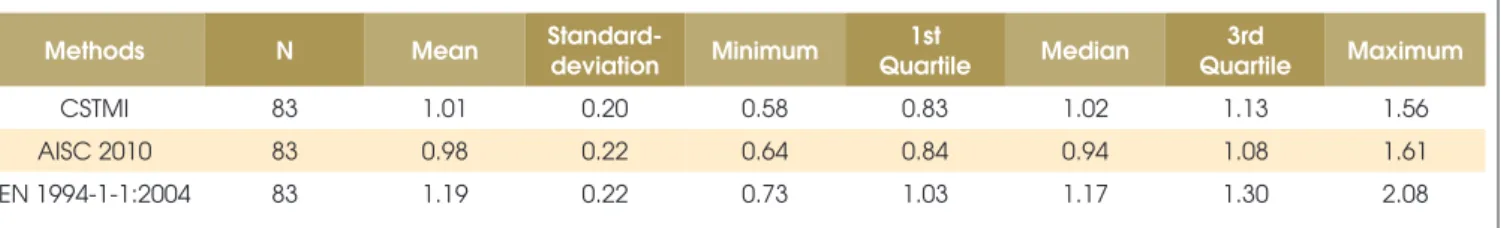
Table 2 lists the mean and standard deviation for the R ratio for the
methods evaluated by Kim and the CSTMI. Figure 6 presents a
box-plot illustrating this information.
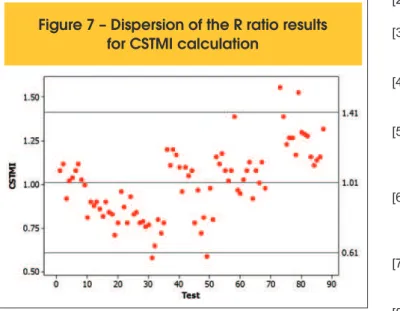
For the CSTMI, it was obtained an average value of the ratio R
equals to 1.01 with a standard deviation of 0.20. Figure 7 shows a
dispersion of the R values for all tests calculated by CSTMI. The
95% conidence interval was set between 0.60 and 1.41, ie., 95%
of the R values are in this range.
To verify the equivalence of theoretical to the test values, it was performed a z test to compare if the mean is equal to 1.0. The
Table 2 – Mean values of the R ratio for comparisons between the composite columns tests,
implemented, and standards procedures
Methods N Mean
Standard-deviation Minimum
1st
Quartile Median
3rd
Quartile Maximum
CSTMI 83 1.01 0.20 0.58 0.83 1.02 1.13 1.56
AISC 2010 83 0.98 0.22 0.64 0.84 0.94 1.08 1.61
EN 1994-1-1:2004 83 1.19 0.22 0.73 1.03 1.17 1.30 2.08
8 Stevens [10] FE5 218 27,0 270 304,8 203,2 21,22 14,15 305 406 4 1,27 4,57 0,0000 0,0508 2212 2393 0,92 0,92 1,18
9 Stevens [10] FE6 218 18,5 270 304,8 203,2 21,22 14,15 305 406 4 1,27 4,57 0,0000 0,0762 1548 1516 1,02 0,90 1,13
10 Stevens [10] FE7 218 18,5 270 304,8 203,2 21,22 14,15 305 406 4 1,27 4,57 0,0000 0,1016 1269 1222 1,04 0,85 1,12
11 Stevens [10] FE8 218 19,3 270 304,8 203,2 21,22 14,15 305 406 4 1,27 4,57 0,0000 0,1270 1125 1045 1,08 0,84 1,14
12 Stevens [10] FE9 218 18,8 270 304,8 203,2 21,22 14,15 305 406 4 1,27 4,57 0,0000 0,1524 991 886 1,12 0,84 1,17
13 Stevens [10] FE10 218 21,2 270 304,8 203,2 21,22 14,15 305 406 4 1,27 4,57 0,0000 0,1778 856 830 1,03 0,75 1,14
14 Stevens [10] FE11 218 20,7 270 304,8 203,2 21,22 14,15 305 406 4 1,27 4,57 0,0000 0,2032 721 719 1,00 0,70 1,11
28 Janss e Anslijn, [11] 11.1 281 34,3 270 140 140 12 7 240 240 4 1,13 3,45 0,0000 0,0399 1095 1345 0,81 0,89 1,08
29 Janss e Anslijn, [11] 11.2 281 33,1 270 140 140 12 7 240 240 4 1,13 3,45 0,0000 0,0399 1156 1286 0,90 0,96 1,16
30 Janss e Anslijn, [11] 11.3 281 28,8 270 140 140 12 7 240 240 4 1,13 3,45 0,0000 0,0399 1047 1190 0,88 0,93 1,13
31 Janss e Anslijn, [11] 12.1 372 32,2 270 140 140 12 7 240 240 4 1,13 3,45 0,0000 0,0399 1156 1290 0,90 0,90 1,08
32 Janss e Anslijn, [11] 12.2 372 31,2 270 140 140 12 7 240 240 4 1,13 3,45 0,0000 0,0399 1095 1270 0,86 0,86 1,04
33 Janss e Anslijn, [11] 12.3 372 28,8 270 140 140 12 7 240 240 4 1,13 3,45 0,0000 0,0399 973 1189 0,82 0,79 0,96
34 Janss e Anslijn, [11] 13.1 267 33,2 270 220 110 9,2 5,9 210 320 4 1,13 2,45 0,0000 0,0399 1173 1304 0,90 0,94 1,12 35 Janss e Anslijn, [11] 13.2 267 31,2 270 220 110 9,2 5,9 210 320 4 1,13 2,45 0,0000 0,0399 1021 1220 0,84 0,85 1,01 36 Janss e Anslijn, [11] 13.3 267 30,6 270 220 110 9,2 5,9 210 320 4 1,13 2,45 0,0000 0,0399 999 1205 0,83 0,84 1,00 50 Roik e Schwalbenhofer, [12] V11 251 43,8 412 120 120 11 6,5 280 280 4 1,53 3,00 0,1600 0,0000 748 1048 0,71 0,66 1,17 51 Roik e Schwalbenhofer, [12] V12 251 43,8 412 120 120 11 6,5 280 280 4 1,53 3,00 0,0599 0,0000 1597 2052 0,78 0,87 0,96 52 Roik e Schwalbenhofer, [12] V13 251 46,8 412 120 120 11 6,5 280 280 4 1,53 3,00 0,1001 0,0000 1407 1469 0,96 0,92 1,26 53 Roik e Schwalbenhofer, [12] V21 335 46,8 412 152 160 9 6 280 280 4 1,53 3,00 0,1001 0,0000 1474 1694 0,87 0,79 1,01 54 Roik e Schwalbenhofer, [12] V22 335 37,0 412 152 160 9 6 280 280 4 1,53 3,00 0,1600 0,0000 932 1190 0,78 0,74 1,12 55 Roik e Schwalbenhofer, [12] V23 335 37,0 412 152 160 9 6 280 280 4 1,53 3,00 0,0599 0,0000 1905 2040 0,93 0,95 1,05 56 Roik e Schwalbenhofer, [12] V31 256 40,7 412 200 200 15,00 9,00 280 280 4 1,53 3,00 0,1001 0,0000 1674 2026 0,83 0,75 0,94 57 Roik e Schwalbenhofer, [12] V32 256 40,7 412 200 200 15,00 9,00 280 280 4 1,53 3,00 0,0599 0,0000 2210 2633 0,84 0,81 0,91 58 Roik e Schwalbenhofer, [12] V33 256 39,3 412 200 200 15,00 9,00 280 280 4 1,53 3,00 0,1600 0,0000 1283 1639 0,78 0,75 1,03 59 Roik e Schwalbenhofer, [12] V41 333 39,3 412 200 186 24,00 14,50 280 280 4 1,53 3,00 0,1001 0,0000 2082 2641 0,79 0,72 0,87 60 Roik e Schwalbenhofer, [12] V42 333 42,2 412 200 186 24,00 14,50 280 280 4 1,53 3,00 0,1600 0,0000 1503 1971 0,76 0,65 0,85 61 Roik e Schwalbenhofer, [12] V43 335 42,2 412 200 186 24,00 14,50 280 280 4 1,53 3,00 0,0599 0,0000 2680 3467 0,77 0,73 0,85 65 Roik e Schwalbenhofer, [12] V111 306 40,1 412 152 160 9,00 6,00 280 280 4 6,16 3,00 0,1001 0,0000 1721 2990 0,58 0,90 0,98 66 Roik e Schwalbenhofer, [12] V112 306 40,1 412 152 160 9,00 6,00 280 280 4 6,16 3,00 0,0599 0,0000 2466 3773 0,65 1,03 1,01 67 Roik e Schwalbenhofer, [12] V121 237 40,1 412 120 120 11 6,5 280 280 4 6,16 3,00 0,1600 0,0000 1116 1393 0,80 0,88 1,05 68 Roik e Schwalbenhofer, [12] V122 237 40,1 412 120 120 11 6,5 280 280 4 6,16 3,00 0,1999 0,0000 797 1105 0,72 0,73 0,95 69 Roik e Schwalbenhofer, [12] V123 237 40,1 412 120 120 11 6,5 280 280 4 6,16 3,00 0,1001 0,0000 1505 1922 0,78 0,91 0,97 70 Roik e Mangerig, [13] 7 265 42,0 412 200 200 15,00 9,00 300 300 4 1,13 3,00 0,0000 0,0300 4460 3726 1,20 1,43 1,50 71 Roik e Mangerig, [13] 8 265 42,0 412 200 200 15,00 9,00 300 300 4 1,13 3,00 0,0000 0,0899 2188 1976 1,11 1,07 1,34 72 Roik e Mangerig, [13] 9 265 42,0 412 200 200 15,00 9,00 300 300 4 1,13 5,00 0,0000 0,0300 3595 2992 1,20 1,50 1,55 73 Roik e Mangerig, [13] 10 265 42,0 412 200 200 15,00 9,00 300 300 4 1,13 5,00 0,0000 0,0899 1791 1524 1,17 1,05 1,34 74 Roik e Mangerig, [13] 11 265 42,0 412 200 200 15,00 9,00 300 300 4 1,13 8,00 0,0000 0,0300 1983 1807 1,10 1,61 1,39 75 Roik e Mangerig, [13] 12 265 42,0 412 200 200 15,00 9,00 300 300 4 1,13 8,00 0,0000 0,0899 976 1016 0,96 0,96 1,19 76 Roik e Mangerig, [13] 23 265 42,0 412 200 200 15,00 9,00 300 300 4 1,13 5,00 0,0899 0,0000 2294 2089 1,10 0,99 1,28 77 Roik e Mangerig, [13] 24 265 42,0 412 200 200 15,00 9,00 300 300 4 1,13 5,00 0,1501 0,0000 1605 1524 1,05 0,87 1,30 78 Roik e Mangerig, [13] 25 265 42,0 412 200 200 15,00 9,00 300 300 4 1,13 8,00 0,0899 0,0000 1647 1524 1,08 1,02 1,38 79 Roik e Mangerig, [13] 26 265 42,0 412 200 200 15,00 9,00 300 300 4 1,13 8,00 0,1501 0,0000 876 1129 0,78 0,64 1,01 80 Roik e Mangerig, [13] 27 265 42,0 412 220 206 25,00 15,00 300 300 4 1,13 5,00 0,0300 0,0000 4099 4236 0,97 1,01 1,12 81 Roik e Mangerig, [13] 28 265 42,0 412 220 206 25,00 15,00 300 300 4 1,13 8,00 0,0300 0,0000 2265 3143 0,72 0,79 0,89 82 Roik e Mangerig, [13] 29 265 42,0 412 220 206 25,00 15,00 300 300 4 1,13 5,00 0,0300 0,0000 3433 4236 0,81 0,85 0,94 83 Roik e Mangerig, [13] 30 265 42,0 412 220 206 25,00 15,00 300 300 4 1,13 8,00 0,0300 0,0000 1854 3143 0,59 0,64 0,73 84 Mirza e Hyttinen, [14] RHB-1 287 27,2 554 96 100 8,00 5,00 240 240 4 0,79 4,00 0,0396 0,0000 933 950 0,98 1,21 1,20 85 Mirza e Hyttinen, [14] RHB-2 287 27,2 554 96 100 8,00 5,00 240 240 4 0,79 4,00 0,0658 0,0000 540 678 0,80 0,82 0,92 86 Mirza e Hyttinen, [14] RHB-3 287 27,7 554 96 100 8,00 5,00 240 240 4 0,79 4,00 0,1057 0,0000 560 481 1,16 1,02 1,40 87 Mirza e Hyttinen, [14] RHB-4 305 25,9 622 96 100 8,00 5,00 240 240 4 0,79 4,00 0,2004 0,0000 302 270 1,12 0,80 1,30 88 Mirza e Hyttinen, [14] RHB-4A 287 25,1 554 96 100 8,00 5,00 240 240 4 0,79 4,00 0,3711 0,0000 151 129 1,18 0,64 1,23 90 Mirza e Hyttinen, [14] RNHB-1 305 27,5 622 96 100 8,00 5,00 240 240 4 0,79 4,00 0,0493 0,0000 908 841 1,08 1,18 1,21 91 Mirza e Hyttinen, [14] RNHB-2 305 27,5 622 96 100 8,00 5,00 240 240 4 0,79 4,00 0,0577 0,0000 761 747 1,02 1,04 1,10 92 Mirza e Hyttinen, [14] RNHB-3 287 26,8 554 96 100 8,00 5,00 240 240 4 0,79 4,00 0,1059 0,0000 530 493 1,08 0,95 1,28 93 Mirza e Hyttinen, [14] RNHB-4 287 27,2 554 96 100 8,00 5,00 240 240 4 0,79 4,00 0,2093 0,0000 346 249 1,39 0,89 1,52 95 Mirza e Hyttinen, [14] RHNB-1 305 27,5 622 96 100 8,00 5,00 240 240 4 0,79 4,00 0,0419 0,0000 910 934 0,97 1,13 1,12 96 Mirza e Hyttinen, [14] RHNB-2 305 27,5 622 96 100 8,00 5,00 240 240 4 0,79 4,00 0,0594 0,0000 707 747 0,95 0,97 1,04 97 Mirza e Hyttinen, [14] RHNB-3 305 25,9 622 96 100 8,00 5,00 240 240 4 0,79 4,00 0,0986 0,0000 530 517 1,03 0,92 1,17 98 Mirza e Hyttinen, [14] RHNB-4 305 25,9 622 96 100 8,00 5,00 240 240 4 0,79 4,00 0,2060 0,0000 291 270 1,08 0,75 1,21 100 Roik e Diekmann, [15] 11 279 46,6 270 200 200 15,00 9,00 300 300 4 1,13 3,00 0,0500 0,0000 3902 3458 1,13 1,12 1,22 101 Roik e Diekmann, [15] 12 279 46,6 270 200 200 15,00 9,00 300 300 4 1,13 3,00 0,0500 0,0000 3180 3458 0,92 0,92 0,98 102 Roik e Diekmann, [15] 13 279 46,6 270 200 200 15,00 9,00 300 300 4 1,13 3,00 0,0500 0,0000 3719 3458 1,08 1,07 1,16
103 Roik e Diekmann, [15] 14 242 46,6 270 152 160 9 6 300 300 4 1,13 3,00 0,0500 0,0000 2792 2770 1,01 1,12 1,25
104 Roik e Diekmann, [15] 15 392 46,6 270 200 200 15,00 9,00 300 300 4 1,13 3,00 0,0500 0,0000 4297 3804 1,13 1,09 1,19 105 Roik e Diekmann, [15] 16 279 46,6 270 200 200 15,00 9,00 300 300 4 1,13 3,00 0,1001 0,0000 2633 2698 0,98 0,98 1,26
110 Han e Kim, [16] AH2-E2-80 310 21,4 275 100 100 8 6 160 160 4 0,71 0,70 0,0201 0,0000 1175 752 1,56 1,43 1,52
111 Han e Kim, [16] AH2-E4-80 310 21,4 275 100 100 8 6 160 160 4 0,71 0,70 0,0399 0,0000 808 580 1,39 1,29 1,44
112 Han e Kim, [16] AH2-E8-80 310 21,4 275 100 100 8 6 160 160 4 0,71 0,70 0,0800 0,0000 517 419 1,23 1,11 1,28
113 Han e Kim, [16] BH2-E2-80 310 21,4 275 100 100 8 6 160 160 4 0,71 1,20 0,0201 0,0000 952 752 1,27 1,24 1,40
114 Han e Kim, [16] BH2-E4-80 310 21,4 275 100 100 8 6 160 160 4 0,71 1,20 0,0399 0,0000 735 580 1,27 1,27 1,52
115 Han e Kim, [16] BH2-E8-80 310 21,4 275 100 100 8 6 160 160 4 0,71 1,20 0,0800 0,0000 489 419 1,17 1,07 1,28
116 Han e Kim, [16] CH1-E2-80 310 21,4 275 100 75 4,50 3,20 160 160 4 0,71 1,70 0,0201 0,0000 860 561 1,53 1,59 1,63 117 Han e Kim, [16] CH1-E4-80 310 21,4 275 100 75 4,50 3,20 160 160 4 0,71 1,70 0,0399 0,0000 552 425 1,30 1,25 1,37 118 Han e Kim, [16] CH1-E8-80 310 21,4 275 100 75 4,50 3,20 160 160 4 0,71 1,70 0,0800 0,0000 339 262 1,29 1,04 1,42
CSTMI method has obtained acceptable result (p-value = 0.746 at 5% signiicance). It is noted that a p-value higher than 5% indi
-cates no diference between the mean value and 1.0 so that the result obtained with CSTMI is satisfactory with a better quality than the result obtained by the ANSI/AISC 360-10 [18] (p-value equal to 0.377).
From this analysis it can be concluded that the procedure imple-mented to determine the ultimate axial force of fully encased com-posite columns is appropriate in general, with better
approxima-tions than the ANSI/AISC 360-10 [18] and EN 1994-1-1:2004 [19].
4. Conclusions
For reinforced concrete columns, CSTMI was adequate, since the
resistance results proved compatible with the samples of 44 col-umns tested by other researchers.
For fully encased composite columns, the program CSTMI was
compared with a sample of 87 tests by other researchers. The nu -merical results were calibrated with the experimental results for many slenderness ratios.
It is concluded that the implemented procedure provides good results for the determination of the resistance of reinforced con-crete columns and fully encased composite columns. This pro-cedure can be considered valid as a general method for calcu-lating columns subjected to combined compression and uniaxial bending.
5. Acknowledgements
The authors are grateful to Brazilian agencies for research CNPq,
CAPES and FAPEMIG and CODEME Engenharia S.A., for sup
-porting this work.
6. References
[1] ASSOCIAÇÃO BRASILEIRA DE NORMAS TÉCNICAS.
NBR 6118: Projeto de Estruturas de Concreto - Procedimen-to. Rio de Janeiro, 2014.
[2] CALDAS, R.B., SOUZA JR, J.B.M., Cálculo de Seções
Transversais Mistas. Ouro Preto, 2004.
[3] CALDAS, R.B., Análise Numérica de Pilares Mistos Aço-Concreto. Dissertação de Mestrado, Escola de Minas, Uni -versidade Federal de Ouro Preto, 2004.
[4] CALDAS, R.B., Análise Numérica de Estruturas de Aço, Concreto e Mistas em Situação de Incêndio. Tese de Douto -rado, Universidade Federal de Minas Gerais, 2008.
[5] GEUZAINE, C., REMACLE, J. Gmsh: a three-dimensional inite element mesh generator with built-in pre- and post-pro -cessing facilities. International Journal for Numerical
Meth-ods in Engineering, 79(11), pp. 1309-1331, 2009.
[6] ARAÚJO, J.M. Pilares Esbeltos de Concreto Armado. Parte
1: Um modelo não linear para análise e dimensionamento. Teoria e Prática na Engenharia Civil, Porto Alegre, n.18, p.81-93, 2011.
[7] GOYAL, B.B., JACKSON, N. Slender concrete columns un
-der sustained load. Journal of the Structural Division, ASCE, v. 97, n.11, p.2729-50, 1971.
[8] KIM, J.K., YANG, J.K. Buckling behavior of slender high-strength concrete columns. Journal of Engng. Struct., v. 17, n.1, p.39-51, 1995.
[9] KIM, D.K., A Database for Composite Columns. Dissertação
de Mestrado, Georgia Institute of Technology, 2005.
[10] STEVENS, R.F., Encased Stanchions. Struct. Engineering,
v.43, p.59-66, 1965.
[11] JANSS, J., ANSLIJN, R. Le Calcul des Charges Ultimes des
Colonnes Métalliques Enrobées de Béton. Rapport MT 89, C.R.I.F., Brussels, 1974.
[12] ROIK, K., SCHWALBENHOFER, K. Untersuchung der Ver
-bundwirkung zwischen Stahlproil und Beton hein Stützen
-konstruktionen, Studiengesellschaft für Anwendungstechnik von Eisen und Stahl e.V., Forschungsvorhaben, p.51, Dus
-seldorf, 1989.
[13] ROIK, K., MANGERIG, I. Zur Traglast von einbetonierten Stahlproilstützen unter Berücksichtigung des Langzeitver
-haltens von Beton, Der Stahlbau, 1990.
[14] MIRZA, S., HYTTINEN, V., HYTTINEN, E. Physical Tests
and Analyses of Composite Steel Concrete Beam-Columns,
Journal of Structural Engineering, ASCE, 122(11), 1317-1326, 1996.
[15] ROIK, K., DIEKMANN, C. Experimental Studies on Compos
-ite Columns Encased in Concrete Following Loading, Der Stahlbau, 58(6), 161-164, 1989.
[16] HAN, D.J., KIM, K.S. A study on the Strength and Histeretic
Characteristics of Steel Reinforced Concrete Columns, Journal
of the Architectural Institute of Korea, 11(4), 183-190, 1995.
[17] AMERICAN INSTITUTE OF STEEL CONSTRUCTION. Speci
-ication for Structural Steel Buildings. ANSI/AISC 360-05.
[18] AMERICAN INSTITUTE OF STEEL CONSTRUCTION.
Speci-ication for Structural Steel Buildings. ANSI/AISC 360-10. [19] EUROPEAN COMMITTEE FOR STANDARDIZATION. EN
1994-1-1: Eurocode 4 – Design of Composite Structures. Part
1-1: General rules and rules for buildings. Brussels, 2004.