ISSN 0104-6632 Printed in Brazil
Brazilian Journal
of Chemical
Engineering
Vol. 20, No. 04, pp. 423 - 434, October - December 2003
DEVELOPMENT OF A VIBROFLUIDIZED BED
AND FLUID-DYNAMIC STUDY WITH DRY
AND WET ADIPIC ACID
V.A.Silva-Moris and S.C.S.Rocha
*Laboratory of Fluid-dynamic and Drying, Chemical Engineering School, State University of Campinas, DTF/FEQ/UNICAMP,
Cx.P. 6066, 13083-970, Campinas – SP, Brazil E-mail: rocha@feq.unicamp.br
(Received: August 4, 2002 ; Accepted: May 8, 2003)
Abstract - The vibrofluidized bed developed in this work, consisting of a transparent plexiglass tube with an inner diameter of 0.1 m and a height of 0.5 m, was designed for the fluidization of adipic acid. The fluidization behavior of dry adipic acid with particle diameters in the range of 75 - 600 µm and a density of 1340kg/m3 was studied using mechanical vibration for different sample loads. Variables studied for the wet material include frequency and amplitude of vibration and moisture content of the particles. On the basis of the quantitative flow curve data and visual observations, it is concluded that the fluid dynamics of the bed with wet sticky particles, both vibrating and not vibrating, is different from that of the bed with dry particles.
Keywords: vibrofluidized bed, adipic acid, fluid dynamics, acceleration of vibration.
INTRODUCTION
The vibrofluidized bed (VFB) of solid particles is a modification of the conventional fluidized bed (CFB), wherein vibration energy is transferred to the bed of particles by a mechanical generator. Vibration may be produced by mechanical shaking of the entire apparatus or just the gas distributor grid.
Commercial application of the vibrofluidized bed (VFB) has been increasing over the past decade for economic drying of wide size particles and difficult-to-fluidize sticky powders. The principle of the vibrofluidized bed can be used as a strategy to improve the quality of fluidization of irregular and cohesive materials, and to avoid problems like channeling, defluidization and slug flow as well as to improve the kinetics of drying in the fluidized bed.
The intensity of mass and heat transfer, the drying rate and the uniformity of the dried product depend on circulation, the degree of mixing of the phases in the bed and the structure of the fluidized bed. The
non homogeneous structure has a negative effect on the contact between phases and productivity in the industrial fluidization drying process. The need to achieve uniform structure for the gas-fluidized bed determines the use of various fluidization methods. Vertical vibration, which improves the quality of the gas-fluidized bed regime, is one of these methods.
Application of VFB in several unit operations (drying, granulation, coating, etc.) in chemical, food, pharmaceutical, and other industries is increasing due to the following advantages:
1) compared to the conventional fluidized bed
of gas velocity and vibration parameters;
4) sticky and pasty materials can be processed with higher efficiency in a VFB than in a CFB, in which these types of materials are seldom fluidizable.
The fluid-dynamic behavior of vibrated beds under fluidized conditions is affected mainly by the physical properties of the particles (size, shape, stickiness, cohesive and adhesive characteristics, etc.), the acceleration of vibration, G = aw2/g (where a is amplitude, g is gravitational acceleration and w is angular frequency), and the flow parameters (Gupta and Mujumdar, 1980).
Geldart (1984) showed that fluidization of group C powders can be improved by the use of mechanical stirrers and vibrators, acting either on the whole apparatus or on parts of it, e.g. the gas distributor plate / or by addition of particles of submicrons size.
Mori et al (1990) used a vibrofluidized bed for group C particles and found that bed expansions larger than those achieved in the absence of vibration could be obtained at low superficial gas velocities. The authors also discussed applications of the vibrofluidized bed in drying solvent removal, humidification and dry mixing.
Marring et al. (1994) studied the effect of vibration on fluidization behavior by varying the degree of cohesiveness of potato starch and observed that beds of cohesive potato starch, which did not fluidize with aeration alone, could become well fluidized when vibration was applied.
Molerus (1982) suggested that the fluidization behavior of powders depends on the ratio of cohesive forces to drag forces in individual particles.
In spite of numerous publications and even more industrial applications, VFB dynamic and transport processes are still poorly understood, particularly for wet, sticky solids. Vibration aids in fluidization of sticky and agglomerating solids.
Some work on drying reported that the vibrational state of the bed allows an increase in the
drying rate, due to desagglomeration and the consequent increase in specific area of gas-solid contact (Jinescu et al., 2000; Suzuki et al.,1980).
Strong interparticle forces, caused by particle size and moisture content, characterize powdery materials used in the drying processes. Due to their specific characteristics, drying of these materials requires intensive fluid-dynamic conditions to decrease internal and external diffusion and prevent particle agglomerations. The first requirement for development of drying processes for a vibrofluidized bed is to find the condition for incipient fluidization of the bed with vibration and simultaneous fluid flow. It is for this reason that the objective of most research in this field has been to find the optimum operational conditions for specific materials.
Fluidization difficulties arise from the fact that interparticle forces are greater than the forces that the fluid can exert on the particles. Interparticle forces may be due to Van der Waals, electrostatic, capillary, liquid blinder, wet and sticky particle surface and irregular particle shape, interactions.
This paper studies the effect of vibration on the fluidization behavior of dry adipic acid with mechanical vibration for different sample loads. Variables studied for the wet material include frequency and amplitude of vibration, and moisture content of the particles.
THE MATERIAL PROPERTIES
Adipic acid (aa) is the main intermediate product in the synthesis of Nylon 66 and very effectively produces rapid setting of gelatin desserts. It is the most important of all aliphatic dicarboxylic acids and is used as acidulents, leavening and buffering agents and gelling aid.
The water content of the commercial product is 0.25% w.b. The main physical properties of adipic acid (white crystalline solid) are listed in Table 1.
Table 1: Physical properties of adipic acid (Castellan, 1991)
Density (kg/m3) 1340
Specific heat (J/kg.K) 1590
Flash point (0C) 196
Boiling point (0C) 337
EXPERIMENTAL APPARATUS AND PROCEDURE
A procedure was developed to control the moisture content (X1) of the wet sample of set at
adipic acid to be tested in the vibrofluidized bed. The sample load was 300 g of adipic acid in all experimental runs using wet material. The moisture content of the adipic acid samples was measured in Karl Fischer equipment. Values obtained for the original moisture content of the acid, X0, are in the
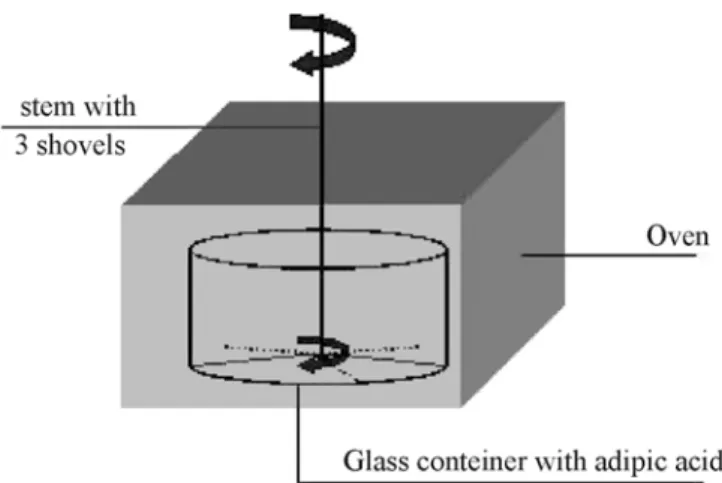
range of 6 to 8% w.b. Once the initial moisture content of the adipic acid was defined, it was placed in a glass container in na oven set at 75 0C. The material was left in the oven to dry for time intervals of 10, 20 or 35 minutes . The intervals had been previously fixed, based on the value of the moisture content desired for the adipic acid in the experimental runs. A stem with three shovels at 1200 angles at the end was inserted into the adipic acid inside the oven and rotated manually. This procedure caused a mixing of the material, resulting in the uniform moisture content of the sample to be used in the VFB experiments. At the end of the established interval, the sample was put in a desiccator until the external wall of the glass container reached room temperature. The moisture content, X1, was then determined using Karl Fischer
equipment and the material was loaded into the vibrofluidized bed. Figure 1 shows a diagram of the procedure described above.
A diagram of the experimental vibrofluidized bed set-up is shown in Figure 2. The vibrofluidized bed consisted of a transparent plexiglass cylinder, 0.5 m long with an inside diameter of 0.1 m and coated on the inside with cellophane and aluminum tapes to minimize static electricity (9). The fluidization air was provided to the system by the blower (1), and its humidity was removed by a fixed bed of silica gel (4). The air flow rate was controlled by a valve (3) and measured using an orifice plate that had been calibrated according to the method found in Ower and Pankhurst (1977).
A perforated plate - type distributor with a hole diameter of 10-3 m and a fractional open area of 5% (Kunii and Levenspiel, 1991), which was covered with a 600 mesh stainless steel wire net, was used. The gas distributor plate was vibrated by a sinoidal drive mechanism which insured the harmonic vibration of the plate. Vibration was produced in the vertical plane by means of an eccentric mechanism, which converted the motion of an electric motor in
to the vertical motion of the perforared plate. This plate was supported on the plenum by a glove. During the experimental study, the application of vibration only to the gas distributor plate functioned satisfactorily. The plenum (10) is used to better distribute the gas and it is the only moving part of the system. The illustration of vibration system is shown in Figure 3.
The bed pressure drop was measured using a U-tube manometer filled with a manometric fluid with a density of 0.75 g/cm3 (14) having static taps located at the plenum and the bed wall, just above the bed surface.
The amplitude of vibration was adjusted by means of a specially designed variable-eccentricity arrangement, and a motor was used to obtain the desired frequency of vibration. This vibration system allows adjustment of frequency between 0 and 2200 rpm and of amplitude between 0 and 0.04 m. Frequency of vibration was measured by an optical tachometer. The flange (15) and the bed (9) were rigidly attached to a frame (11).
Experiments were conducted to determine the effect of sample load and of vibration on the fluid-dynamic behavior of dry adipic acid over a wide range of frequencies and amplitudes of vibration and the effect of vibration on the fluid-dynamic behavior of wet adipic acid over a wide range of frequencies and amplitudes of vibration and moisture content. The sample load was set at 300 g of adipic acid for the experimental runs using wet material.
The fluid dynamics of the VFB with wet and dry adipic acid was studied using fluidization curves for both systems, conventional and vibrating, in order to verify the effect of vibration parameters on the pressure drop versus gas velocity curve. The pressure drop across the bed was then recorded as a function of gas velocity for increasing and decreasing gas velocities.
The main characteristic parameter for shaking, described in the literature is intensity of vibration, defined by
2 a. G
g
ω
= (1)
Figure 1: Diagram of the adipic acid container inside the oven
1 - blower 2 - cooler 3 - globe valve 4 - silica gel bed 5 - static pressure 6 - orifice plate 7 - eletrical heater 8 - table
9 - cylindrical bed 10 - plenum 11 - frame
12 - drive shaft and vibration mechanism
13 - variable speed electro motor 14 - U-tube manometer
15 - flange 16 - cyclone
Figure 2: Experimental vibrofluidized bed setup
RESULTS AND DISCUSSION
Figures 4 - 12 contain typical pressure drop versus air velocity data for dry adipic acid (0.2% d.b.), while Figures 13 - 16 contain similar data for wet adipic acid with different levels of moisture content.
Dry Particles
The pressure drop versus air velocity curves for dry adipic acid were used to characterize the fluid-dynamics of the vibrating bed. Various types of curves for vibrating bed and CFB were obtained, some of which are shown in Figures 4 - 12.
The fluidization curves obtained for CFB and VFB, increasing frequency of vibration, are shown in Figures 4, 5 and 6.
In this study, the value of the minimum vibrofluidization pressure drop, (∆Pmf)v, corresponds
to the constant pressure drop and the minimum vibrofluidization velocity (umf)v corresponds to the
velocity at which the solid particles in the bed begin to move with respect to each other (Gupta and Mujumdar, 1980).
The effect of increasing the frequency of vibration is shown in Figures 5 and 6. Increasing the frequency of vibration from 200 to 350 rpm results in a decrease in the minimum vibrofluidization pressure drop from 650 to 550 Pa. Both curves reach a pressure drop plateau with differ values of pressure drop, depending on frequency of vibration. Figures 4 and 5 show the reduction in minimum fluidization gas velocity from umf = 0.25 m/s to
(umf)v = 0.15 m/s.
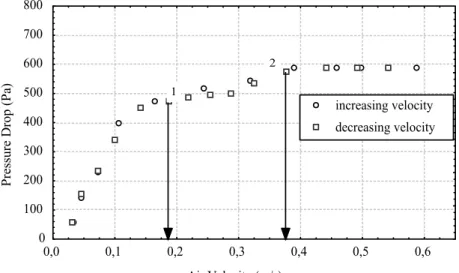
Figure 7 shows two important states of fluidization, labeled point 1 and point 2. The latter corresponds to a constant pressure drop, where fluidization is completely established and the circulation of solids is visibly intense _ (∆Pmf)cf and
(umf)cf , and the former is defined by Gupta and
Mujumdar (1980) as the velocity of minimum mixture, when the solid particles in the bed begin to move with respect to each other _ (∆Pmf)v and (umf)v.
This behavior has been confirmed by visual observations of the bed during fluid-dynamic experiments.
The fluid-dynamic study for dry adipic acid was done using fluidization curves for both systems, the conventional and the vibrating (CFB and VFB). The fluid dynamics in the VFB was analyzed to verify the variation in pressure drop with vibration parameters (amplitude and frequency). Figures 8 - 12 show the effect of frequency of vibration on the
fluid-dynamic curves and evidence the changes in (∆Pmf)v as a function characteristic of vibration.
In Figure 8 it can be seen that at the same air velocity, the pressure drop in the conventional bed is about 20% higher than it is in the vibrating bed at f = 435 rpm and a = 0.01m. This is a result of the looser structure of the bed due to vibration.
Figures 8 and 9 , which refer to a load of 300 g of adipic acid, show that the decrease in pressure drop in the bed due to vibration increases as vibration increases the pressure drop in the bed is always lower than that obtained without vibration, G = 0.
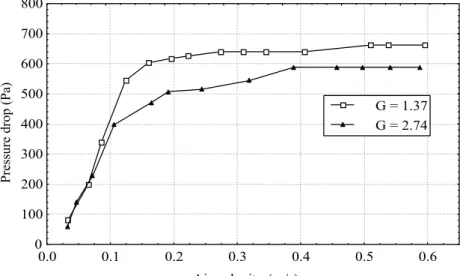
The effect of increasing the amplitude of vibration is shown in Figure 10. Increasing amplitude of vibration results in a decrease in the pressure drop in the bed.
At low values of gas velocity and fixed bed regime, the bed pressure drop in the bed obtained with the vibrating system was higher than that obtained with the conventional bed. This effect was prominent for larger loads of particles in the bed, since the particle-particle contact points increase with a consequent decrease in bed voidadge due to material compaction.
The VFB pressure drop was found to be lower than the pressure drop in the CFB, over the entire range of operational conditions used in this work. The minimum fluidization pressure drop was found to decrease as the frequency and amplitude of vibration increased.
A considerable attenuation of the effect of vibration with an increase in bed height is observed for the minimum fluidization pressure drop. Note that for a bed load of 700 g, the effect of vibration on the minimum fluidization pressure drop is almost totally damped out (Figure 12).
With vibration a decrease in minimum pressure drop in the bed in the range of 4 - 30% was obtained.
An analysis of the experimental results obtained with dry material indicates a reduction in the minimum fluidization pressure drop and air velocity as a consequence of the vibration in the system.
Air Velocity (m/s)
P
re
ss
ure
D
rop (P
a)
0 100 200 300 400 500 600 700 800
0.0 0.1 0.2 0.3 0.4 0.5 0.6
increasing velocity decreasing velocity
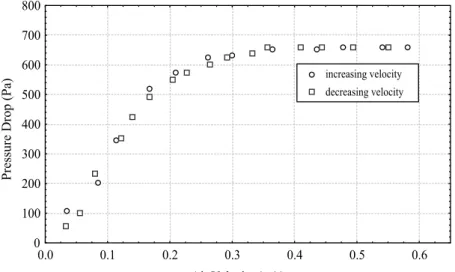
Figure 4: Pressure drop versus air velocity, 500 g of adipic acid, without vibration (G = 0)
Air Velocity (m/s)
P
re
ss
u
re
D
ro
p
(P
a)
0 100 200 300 400 500 600 700 800
0.0 0.1 0.2 0.3 0.4 0.5 0.6
increasing velocity decreasing velocity
Figure 5: Pressure drop versus air velocity, 500 g of adipic acid, a = 0.01m, f = 200 rpm (G = 0.45)
Air Velocity (m/s)
P
re
ss
u
re
D
ro
p
(P
a)
0 100 200 300 400 500 600 700 800
0.0 0.1 0.2 0.3 0.4 0.5 0.6
increasing velocity decreasing velocity
Air Velocity (m/s)
P
re
ss
ure
D
rop (P
a)
0 100 200 300 400 500 600 700 800
0,0 0,1 0,2 0,3 0,4 0,5 0,6
increasing velocity
decreasing velocity 1
2
Figure 7: Pressure drop versus air velocity, 600 g of adipic acid, a = 0.02 m, f = 350 rpm (G = 2.74)
Air Velocity (m/s)
P
re
ss
u
re
D
ro
p
(P
a)
0 50 100 150 200 250 300 350 400 450 500
0.0 0.1 0.2 0.3 0.4 0.5 0.6 0.7
G = 0 G = 0.45 G = 2.12
Figure 8: Pressure drop versus air velocity for 300 g of adipic acid, increasing frequency f = 200 rpm, a = 0.01 m (G = 0.45) and f = 435 rpm, a = 0.01 m (G = 2.12)
Air Velocity (m/s)
P
re
ss
ure
drop (P
a)
0 50 100 150 200 250 300 350 400 450 500
0.0 0.1 0.2 0.3 0.4 0.5 0.6 0.7
G = 0 G = 2.74 G = 0.90
Air velocity (m/s)
P
re
ss
ure
drop (P
a)
0 100 200 300 400 500 600 700 800
0.0 0.1 0.2 0.3 0.4 0.5 0.6
G = 1.37 G = 2.74
Figure 10: Effect of amplitude vibration in fluid-dynamic of adipic acid, 600 g f = 350 rpm, a = 0.01 m (G = 1.37) and f = 350 rpm, a = 0.02 m (G = 2.74)
Air Velocity (m/s)
P
re
ss
ure
D
rop (P
a)
0 100 200 300 400 500 600 700 800
0.0 0.1 0.2 0.3 0.4 0.5 0.6 0.7
G = 0
G = 0.45
G = 1.37 G = 2.12
Figure 11: Pressure drop versus air velocity for 500 g of adipic acid, increasing frequency f = 200 rpm, a = 0.01 m (G = 0.45), f = 350 rpm, a = 0.01 m (G = 1.37) and f = 435 rpm, a = 0.01 m (G = 2.12)
Air Velocity (m/s)
P
re
ss
ure
D
rop (P
a)
0 100 200 300 400 500 600 700 800 900
0,0 0,1 0,2 0,3 0,4 0,5 0,6
G = 0
G = 0.45
G = 1.37
Wet Particles
In practice, the most common operation in vibrofluidized bed is drying. Surface moisture of particles can be related directly to surface stickiness, which in turn affects the fluid dynamics of fluidization and, consequently, the heat and mass transfer phenomena. It is therefore essential to examine the effect of particle stickiness on the flow pattern of the bed.
The fluid dynamics of the VFB with wet adipic acid was analyzed using the fluidization curves for both systems, conventional and vibrating , in order to verify the effect of vibration parameters on the variation in pressure drop and minimum fluidization velocity. The sample load was 300 g in all experimental runs. The pressure drop in the bed was then recorded as a function of gas velocity for increasing gas flow rate.
The original samples were obtained an industrial plant, before entering the dryer. The initial content moisture, X0, measured in Karl-Fischer equipment, is
between 6 and 8% w.b. Under conditions of no vibration, the bed does not fluidize in this range of moisture contents.
The fluid-dynamic experiments were conducted for the adipic acid under the following moisture content conditions: X1 = 5.1% w.b., X1 = 3.9% w.b.
and X1 = 2.8% w.b. To obtain these values, the
samples were heated the oven for 10, 20 or 35 minutes, respectively, following the procedure described in the previous section.
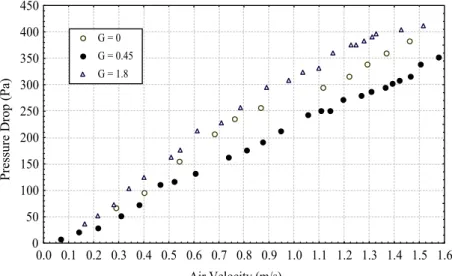
Figure 13 contains the curves of pressure drop in the bed as a function of gas velocity for both systems, conventional and vibrating, for the original sample heated in the oven for 10 minutes, resulting in X1 = 5.1% w.b. As can be seen in Figure 13, the
pressure drop is lower for G = 0.5 than for G = 1.8 at a fixed amplitude of 0.01 m. This behavior can be attributed to the compaction of the bed, which was verified at high vibration frequencies. Very poor mixing occurred under this condition and the function of vibration was to maintain the agglomerates formed in a mobile state. This can be due to the presence of liquid blinder when the material is wetted or moistened.
Gupta and Mujumdar (1980) studied the VFB dynamic with polyethylene particles and verified that all the pressure drop versus gas velocity curves for G
> 1 lay below those for G = 0. For X1 = 5.1% w.b.
the opposite behavior was observed in this work, as shown in Figure 13. For the intensity of vibration, G, higher than 1 the bed compacted, resulting in an increase in the values of pressure drop. Higher compaction implies greater resistance to flow.
For the VFB with aa at X1 = 2.8% w.b. it was
observed that vibration prevented effectively the destruction of channeling and good particle mixing occurred. The formation of channeling at the beginning was broken by vibration which improved the fluidized regime by maintaining a good quality fluidized state. Even though the bed had agglomerated particles, they could circulate and mix when the bed was vibrating.
In the absence of vibration, gapsformed between the bed and the cylinder walls. As a consequence, it was observed that the pressure drop increased with increasing gas velocity until cracks appeared in the bed. After the collapse, the pressure drop decreased momentarily (Figure 14).
Figure 14 shows the pressure drop versus gas velocity curves for X1 = 2.8% w.b. The pressure drop
is lower for G = 0.5. Its value becomes practically constant for gas velocities above 1.1 m/s at a value of approximately 250 Pa. Two curves, G = 0.5 and 1.8, have plateaus and their values differ, depending on G.
Thus, for X1 = 2.8% w.b., a notable decrease in
pressure drop in the bed is observed for G <1, due to the moisture content. Unlike other dry systems, where the decrease in pressure drop is obtained for higher values of G (Reay and Baker (1985), Gupta and Mujumdar (1980)).
Figures 14 and 15 also show that the values of minimum fluidization velocities are different for each experiment, depending on the value of G, and are lower for lower values of G.
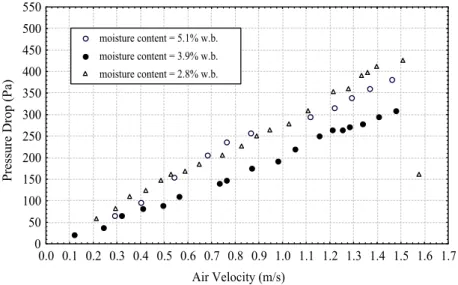
The curves for pressure drop in the bed as a function of gas velocity are shown in Figure 16 for different levels of moisture content of aa without vibration. With the bed of adipic acid at X1 = 2.8%, it
can be observed that the pressure drop increased with increasing air velocity until cracks appeared in the bed. For the wet bed at X1 = 5.1 and 3.9% w.b., the
Air Velocity (m/s)
P
re
ss
ure
D
rop (P
a)
0 50 100 150 200 250 300 350 400 450
0.0 0.1 0.2 0.3 0.4 0.5 0.6 0.7 0.8 0.9 1.0 1.1 1.2 1.3 1.4 1.5 1.6 G = 0
G = 0.45 G = 1.8
Figure 13: Effect of frequency of vibration on the bed of wet adipic acid, X1 = 5.1% w.b., a = 0.01m.
Air Velocity (m/s)
P
re
ss
u
re
D
ro
p
(P
a)
0 50 100 150 200 250 300 350 400 450 500
0.0 0.1 0.2 0.3 0.4 0.5 0.6 0.7 0.8 0.9 1.0 1.1 1.2 1.3 1.4 1.5 1.6 1.7 1.8 G = 0
G = 0.45 G = 1.8
Figure 14: Effect of frequency of vibration on bed of wet adipic acid, X1 = 2.8% w.b., a = 0.01m
Air Velocity (m/s)
P
re
ss
ure
D
rop (P
a)
0 50 100 150 200 250 300 350 400 450 500
0.0 0.1 0.2 0.3 0.4 0.5 0.6 0.7 0.8 0.9 1.0 1.1 1.2 1.3 1.4 1.5 1.6 1.7 1.8 G = 0
G = 0.9 G = 3.6
Air Velocity (m/s)
P
re
ss
u
re
D
ro
p
(P
a)
0 50 100 150 200 250 300 350 400 450 500 550
0.0 0.1 0.2 0.3 0.4 0.5 0.6 0.7 0.8 0.9 1.0 1.1 1.2 1.3 1.4 1.5 1.6 1.7 moisture content = 5.1% w.b.
moisture content = 3.9% w.b. moisture content = 2.8% w.b.
Figure 16: Curves of pressure drop in the bed as a function of gas velocity with different levels of moisture content without vibration, G = 0.
CONCLUSION
During the experimental study using dry aa, the different types of fluidization curves found in the literature for a VFB were reproduced (Strumillo and Pakowski, 1980), indicating that the bed developed in this study is well designed.
Analysis of the experimental results obtained for dry material indicates a reduction in pressure drop in the bed as a consequence of the increase in vibration amplitude and frequency of vibration. The pressure drop versus air velocity curves allowed characterization of the fluid dynamics vibrating bed. (∆Pmf)v was found to decrease as the frequency and
amplitude of vibration increased.
On the basis of the quantitative flow curve data and visual observations, it concluded that beds of sticky wet particles of aa, both vibrating or not vibrating, behave differently from those of dry particles.
Vibration exerted a beneficial effect on circulation of the particles even though they were in an agglomerated state. Moderate vibrational intensities showed to be more efficient for agglomerated state of the particles. Frequency was limited because of the strong forces of inertia due to large moving masses.
Adipic acid has a tendency to agglomerate when wet or moistened. In this case, fluidization does not occur and the particles can not be treated in a conventional fluidized bed.
Low values of adipic acid moisture content have a large effect on the fluid-dynamic behavior of the
bed and on the fluidization parameters, minimum fluidization velocity and pressure drop.
The fluidization parameters, minimum fluidization velocity and pressure drop, for the bed of wet adipic acid, are related to the value of intensity of vibration, G. Lower values of minimum fluidization velocity were obtained for lower values of G, and pressure drop in the bed decrease more for G < 1 than for bed conventional.
Considerable improvement in the fluidity of wet particles of adipic acid was obtained in the VFB, which helped to overcome interparticle attraction forces.
ACKNOWLEDGMENT
The authors are grateful to the Foundation for Research Support of São Paulo, FAPESP, for the financial aid it provided.
NOMENCLATURE
a amplitude of vibration m f frequency of vibration rpm G dimensionless vibrational acceleration - g acceleration due to gravity m/s2 X0 original moisture content of the acid w.b (%)
X1 moisture content of the wet sample of
(umf)cf complete fluidization velocity with
vibration m/s (umf)v minimum fluidization velocity with
vibration m/s (∆Pmf)v minimum fluidization pressure drop with
vibration Pa (∆Pmf)cf pressure drop in the bed for complete
fluidization condition with vibration Pa
REFERENCES
Castellan, A. (1991), Industrial Production and Use of Adipis Acid, Catalysis Today, Vol. 9, no. 3, pp. 237-254.
Geldart, D.; Harnby, N. and Wong, A. C. (1984), Powder Technology,37, pp. 25 - 37.
Gupta, R. and Mujumdar, A. S. “Aerodynamic of Vibrated Fuid Beds”, The Canadian Journal of Chemical Engineering, vol.58, pp. 332 - 338, 1980.
Jinescu et al., “Hydrodynamic Aspects at Vibrated-Fluidized Drying of Polydisperse Powdery Materials”, Proceedings of the 12th International Drying Symposium IDS 2000, pp. 28 – 31 Agosto 2000, CDROOM.
Kunii, D. and Levenspiel, O. (1991), Fluidization Engineering, New York, John Wiley, 491 p. Ower, E. and Pankhurst, R.C. (1977), The Plate
Orifice, Shaped Nozzle and Venturi Tube,
The Mesurement of Air Flow, 5th Edition,
Pergamon Press, pp.149-183.
Marring, E., Hoffmann, A.C. and Janssen, L.P.B.M. (1994), Powder Technology, 79, pp. 1- 10.
Molerus, O., Powder Technology , 33 (1982) 81. apud Marring, E., Hoffmann, A.C. and Janssen, L.P.B.M., Powder Technology, 79 (1984), pp. 1 - 10.
Mori, S., Yamamoto, A., Iwata, S., Haruta, T., Yamada, I. and Mizutani, E. (1984), AIChE Symp. Ser., 86 (1990) 88. apud Marring, E., Hoffmann, A.C. and Janssen, L.P.B.M., Powder Technology, 79 (1984) pp. 1 - 10.
Reay, D. and Baker, C. G. J. “ DRYING.” in – Fluidization, London Academic Press, pp.529 – 562, 1985.
Seville, J.P.K. and Clift, R. (1984), The Effect of Thin Liquid Layers on Fluidization Characteristics, Powder Technology, vol. 37, pp . 117 - 129, 1984.
Seville, J.P.K., Willett, C.D. and Knight, P.C. (2000), Interparticle Forces in Fluidization: a Review, Powder Technology, vol. 113, pp. 261 - 268. Strumillo, C. and Pakowski, Z. “Drying of
Granular Products in Vibrofluidized Beds.” Drying 80, vol.1, pp.211-226, 1980.