ISSN 0104-6632 Printed in Brazil
www.abeq.org.br/bjche
Vol. 27, No. 04, pp. 663 - 675, October - December, 2010
Brazilian Journal
of Chemical
Engineering
NUMERICAL MODELING OF FLUID DYNAMICS
AND HEAT TRANSFER OF GLASS FLOW IN A
SHORT CHANNEL
G. E. Ovando Chacon
1*, S. L. Ovando Chacon
2and J. C. Prince Avelino
11Instituto Tecnológico de Veracruz, Depto. Metal-Mecánica y Mecatrónica,
Phone: (+) 52 229 9341500, ext. 136, Calzada Miguel Ángel de Quevedo 2779, Col. Formando Hogar, C. P. 91860, Veracruz, Veracruz, México.
E-mail: [email protected]; [email protected]
2
Instituto Tecnológico de Tuxtla Gutiérrez, Depto. Química y Bioquímica, Phone: (+) 52 961 6150380, Carretera Panamericana Km 1080, C. P. 29000, Tuxtla Gutiérrez, Chiapas, México.
E-mail: [email protected]
(Submitted: December 5, 2009 ; Revised: April 15, 2010 ; Accepted: August 19, 2010)
Abstract - A numerical investigation of laminar flow in a two-dimensional, Cartesian flow that exits from a short channel with a backward-facing step is carried out in this work for the Reynolds number range of 0.00054 ≤ Re ≤ 54. We studied the steady state fluid dynamics, phase change and heat transfer of the flow. We analyzed the flow behavior occurring for different outflow velocities and three different configuration of the step. The incompressible working fluid was glass. The temperature, streamline, phase change and pressure fields are obtained and analyzed as a function of position. In order to obtain a better understanding of the step angle influence on the fluid dynamics, we obtained the heat transfer flux rates and the axial velocity profiles. Keywords: Numerical simulations; Fluid Dynamics; Heat transfer; Glass; Finite element.
INTRODUCTION
An important issue in fluid dynamics is the study of fluid flow and heat transfer in channels with phase change, this being the topic of a range of studies because it is present in many technical applications and natural processes. Giessler and Schlegelm (2008) compared a two-dimensional axisymmetric simulation of a glass melt flowing through a pipe with a one-dimensional model. The fluid was supposed to be heated by internal electromagnetic heating and cooled at the wall by convection. It was considered to be a laminar and steady flow of a viscous electrically-conducting fluid in a pipe with circular cross-section driven by a pressure difference between the inlet and the outlet of the pipe. The highly viscous fluid with constant density was supposed to have strongly temperature-dependent
mushy region, while the free surface function and the backpressure function were utilized for low melting point metals. Velocity profile, temperature field and filling sequence were obtained from the simulations. To this end, the governing equations were discretized with the finite difference method and a semi-explicit solution of this approximation was obtained to compute the first guess for new time-level velocities using the initial conditions or previous time-level values for all advective, pressure and viscous accelerations. To satisfy the continuity, pressure was iteratively adjusted in each cell and the velocity changes induced by each pressure change are added to the velocity computed previously. In most cases, an over-relaxation factor is used to accelerate the convergence of the iteration. Shmueli et al. (2008) investigated the process of melting of a phase change material in a vertical tube. The numerical simulations were done with fluent and the flow patterns and a detailed distribution of heat transfer on the inner wall of the tube were obtained. The results of the simulation and the analysis of digital pictures, obtained in previous studies, reveal that the effect of convection in the liquid phase provokes non-radial heat fluxes from the wall to the melting zone. The conservation equations for air were solved in the domain bounded by the perimeter of the inner walls, phase change melting from below, and the upper boundary of the tube from above. Boundary conditions for the momentum equation were no-slip at all solid surfaces and slip at the upper boundary of the tube, while for the energy equation constant and uniform temperature on the outside wall of the tube, zero heat flux at the bottom, and ambient air temperature at the upper boundary of the tube were considered. Alexiades et al. (2003) studied the effect of grid and scheme on the numerical solution of a tin melting flow. Simulations were carried out in a square cavity filled with tin (pure metal) initially at freezing temperature (solid tin). The top and bottom boundaries were considered to be adiabatic, while the right boundary was maintained at constant temperature. At the beginning of the simulation, the left boundary was suddenly brought to a hot temperature higher than the melting temperature. Thermal gradients generated density gradients, which provoked convection in the liquid tin. The shape of the solid-liquid interface, the flow pattern in the liquid and the heat transfer process were analyzed. Giannopapa (2006) developed a computational model to simulate the blow-blow forming process of glass containers that characterized the glass flow and the heat transfer. He was able to track the geometry of the deforming
interface of glass applying structured and unstructured fixed meshes. The Navier-Stokes equations were used to describe the motion of the hot glass, while the energy equation was used to describe the heat transfer between the glass and the mould. The governing equations were discretized by the finite element method. In this work, the propagation of glass during the forming process and the temperature profiles were analyzed. Salinas (2006) studied numerically the solidification of aluminum alloy in a square cavity considering the flow of an incompressible Newtonian fluid with isotropic thermal properties where the phase change and the heat transfer by conduction and convection were considered. The mathematical model was based on a set of partial differential equations given by momentum, continuity and heat transfer equations. The discretization of the governing equations was done by the finite volume method combined with a SIMPLER scheme to join pressure and velocities. Transient results of the non-isothermal solidification were obtained and the streamlines and isotherms analyzed, the results showing a complex flow with secondary vorticity. The goal of the present work is to extend the one-dimensional study reported by Jimenéz (2002), providing insight into the velocity, the phase change and the temperature fields, as well as to analyze the heat fluxes and axial velocity profiles. The flow is assumed to be two-dimensional because the major changes occur only in the axial and transversal directions. The present research is of particular relevance for the glass industry because we have greatly extended current knowledge on how vortices and heat transfer interact with the geometry of the step channel. Furthermore, this fluid thermal interaction of glass flow underpins much of the behavior of the material properties.
PROBLEM FORMULATION
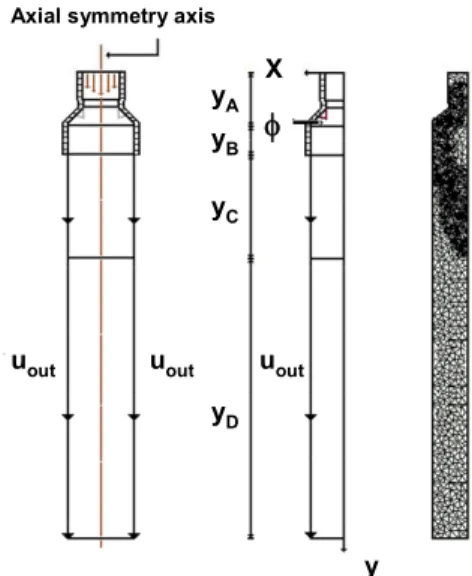
We present numerical simulations of the outflowing fluid from a two dimensional axially symmetric short channel with an inclined backward-facing step, as shown in Figure 1. φ is the step inclination angle and the fluid enters at the superior boundary of the channel and exits at the inferior boundary of the domain at the outflow velocity denoted by Uout. This velocity is also imposed at the
y
uout uout
Axial symmetry axis
uout yA yB yC yD φ X y
uout uout
Axial symmetry axis
uout yA yB yC yD yA yB yC yD φ X
Figure 1: Geometry of the cannel with inclined backward-facing step and computational adaptive mesh.
The range of outflow velocity explored in this investigation was 8.65×10⁻⁵ m/s ≤ Uout ≤ 8.65×100
m/s, which for glass as the working fluid corresponds to the Reynolds number (Re=Uout L / ν)
range of 0.00054 ≤ Re ≤ 54, where L is the distance from the entrance of the channel to the lower boundary of the domain. The walls of the short channel from the superior part of the channel to the step are assumed to be adiabatic. After the step, convection heat transfer coefficients are imposed along the domain boundary in order to take into account the heat exchange by convection of the glass with the surroundings, which are kept at T0=300K.
At the entrance of the channel, the glass temperature is Tin=1373K and the viscous stress vanishes along
this boundary. The flow region Ω chosen for the numerical simulations is a two-dimensional channel, where the flow, heat transfer and phase change are analyzed. The conservation equations that describe this problem for a steady state incompressible fluid in this region are the momentum, continuity and energy equations:
1
u u u p f in ,
−νΔ + ⋅∇ + ∇ = Ω
ρ
G
G G G (1)
u 0 in ,
∇ ⋅ =G Ω (2)
(
k T)
C up T Q in ,∇ ⋅ − ∇ + ρ G⋅∇ = Ω (3)
where uG=(u , u )1 2 is the velocity vector, u1 and u2
being the transversal and axial velocity components respectively; ν is the kinematic viscosity, p is the
pressure, k is the thermal conductivity, Cp is the
specific heat, Q is the heating power per unit volume (heat source term) and T is the temperature.
Because we are interested in the flow behaviour at the phase change interface, the only body force taken into account in this model is given by a Darcian approximation that is a damping force, which ensures zero velocity of the solid phase and is given by the following body force:
(
)
2(
)
ab out
3 a
1 c ˆ
f c u u j , c − = − + ε G (4)
where ca is the fraction of liquid phase, given by:
(
)
m
m
a m m
m 1 (T T T)
T T T
c (T T) (T T),
2 T
0 (T T T)
⎧ > + Δ
⎪
⎪⎪ − + Δ
=⎨ − Δ ≤ + Δ
Δ ⎪
⎪ < − Δ
⎪⎩
(5)
cb is the permeability constant and ε is a small
number to prevent division by zero in calculations. This term vanishes in the liquid phase region (ca=1).
Tm=1223K is the melting temperature and ΔT=20K
is the temperature interval where the liquid-solid mixture coexists.
Physically, in the mushy region when the fluid temperature decreases the glass solidifies; as a consequence, the specific heat capacity in the energy equation should be:
p p
C =C + δΔH, (6)
in order to incorporate the effect of the significant amount of latent heat released in the phase change region. On the other hand, most of the released heat occurs near the melting temperature, like a peak of heat due to phase change. Thus, in order to capture this physical phenomenon, we introduce the exponential parameter δ, which allows for a pulse type latent heat in the mushy region. δ is defined below:
(
2 2)
m
(T T ) ( T) e
T
− − Δ
δ =
Δ π (7)
while the enthalpy change is given by:
p H T C .
Δ = Δ (8)
2 1
1 2 A B
2 out c D E
1
2 out
1
u
u 0, 0, for x 0 x
u 0, u 0, for y , y
u u , y , y , y u 0, for
u u ,
u 0, for y L.
∂ = = = ∂ = = = = = = = (9)
The temperature boundary conditions are given by:
A 2 B B 2 C C 2 D D 2 E E T
0, for y , x
h 35 W / m K, for y ,
h 105W / m K, for y ,
h 60 W / m K, for y ,
h 40 W / m K, for y
∂ = ∂ = ⋅ = ⋅ = ⋅ = ⋅ (10)
The thermophysical properties of glass used in the simulation are independent of temperature, see Table 1. The data for the glass flow simulated in this work, including the melting temperature and the temperature interval where the liquid-solid mixture coexists, are those for an actual glass and were published by a glass bottle manufacturer (Silices de Veracruz S.A. de C.V) located at Veracruz, Mexico.
Table 1: Physical properties of glass.
Property Glass
Density 2380 kg/m3
Specific heat 1235.08 J/kg⋅K Thermal conductivity 2.1 W/m⋅K Dynamic viscosity 600 Pa.s Latent heat 205 kJ/kg
NUMERICAL METHOD
The numerical simulations were carried out using the finite element method. For this purpose, we introduced the space discretization step h, the finite element triangulation τh of the polygonal domain Ω,
the space of polynomials P1 in two variables of
degree less than or equal to one, and the space of continuous functions c ( )0 Ω defined in Ω. The functional spaces are approximated by the following finite dimensional spaces:
{
}
oh h h h
L q L | q dX 0 Ω
= ∈
∫
G = with{
0}
h h h h 1 h
L = q | q ∈c ( ),q |Ω τ∈P ,∨τ∈ τ ,
{
}
oh h h h 1
V v V | v 0 on Ω
= G ∈
∫
G = Γ with{
0 2}
h h h h 1 1 h 2
V = v | vG G ∈c ( ) , v |Ω G τ∈ ×P P ,∨τ ∈ τ ,
and
{
}
oh h h h 3
W = θ ∈W |θ =0 on Γ with
{
}
h h h h 1 h 2
W = θ θ ∈ Ω θ ∈| c( ), |τ P ,∨τ∈ τ ,
Using the above finite dimensional spaces leads to the following approximation for Equations (1-3) in their variational forms; for more details, see Chorin (1973), Glowinski and Pironneau (1992), Turek (1999), Marechuk (1990), Glowinski (2003), Glowinski and Le Tallec (1989), Dean and Glowinski (1997), and Dean et al. (1998). For t>0, find u (t)Gh ∈Vhwith Gu (t)h =g (t) on G1t Γ1, p (t)h ∈Lh and L (t)h ∈Wh withT (t)h =g3h(t) on Γ3, such that
(
h)
h hh oh
u u v dX u : vdX
p vdX f vdX v V ,
Ω Ω Ω Ω ⋅∇ ⋅ + ∇ ∇ − ⎡ ⎤ ⎣ ⎦ ∇ ⋅ = ⋅ ∀ ∈
∫
∫
∫
∫
G GG G G G G
G
G G
G G G
h oh
q u dX 0, q L ,
Ω ∇ ⋅ = ∀ ∈
∫
G G(
)
p h h h
oh
C u T dX k T : dX
Q dX W ,
Ω Ω
Ω
⎡ρ ⋅∇ ⋅ θ⎤ + ∇ ∇θ =
⎣ ⎦
⋅ θ ∀ θ∈
∫
∫
∫
G G G G( )
( ) ( )
( )
h oh h oh
u X,0G =u X , TG X,0G =T XG
G G
On the other hand, Γ1 and Γ3 are the Dirichlet
boundary conditions for velocity and temperature, respectively; gG1h and g3h are the finite element approximations of the velocity and temperature boundary function gG1 and g3, respectively. Similarly, uGoh and Toh are finite element approximations of the initial condition functions uGo and To, respectively.
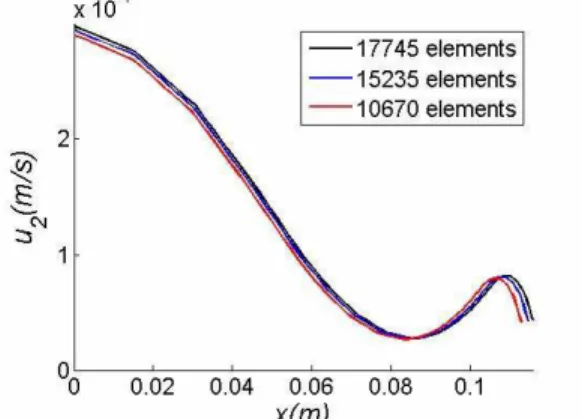
permits fast and accurate calculations because it concentrates the majority of the elements where the phase transition occurs. Figure 2 shows the mesh convergence analysis for three different meshes with resolutions of 17745, 15235 and 10670 net elements. The steady state simulations were obtained with the thinnest mesh using a direct solver with a relative accuracy |ui+1-ui|/|ui+1| of 1.0×10⁻⁶. The validation of this work was done by the comparison between the present two-dimensional axisymmetric simulation of glass flowing through and leaving from a short channel and the one-dimensional model studied by Jimenéz (2002). He analyzed the overheating problem of glass in a short inclined pipe using the thermal resistance approach and considered the convection and conduction heat transfer mechanism. The heat flux rate for φ=50° and uout=8.65×10⁻² m/s
is of the same order of magnitude (104 W/m2) in both studies.
Figure 2: Convergence analysis of the axial velocity profile for the outflowing fluid from the short channel for φ=90° and uout=8.65×10⁻⁵ m/s with three
different mesh sizes.
RESULTS
CASE φ=90°
Figure 3 shows the temperature, streamline, phase change and pressure fields of the flow that exists from a short channel with a 90° inclined backward-facing step. The flow enters at the superior open boundary and exits at the inferior open boundary of the short channel. Three different outflow velocities Uout are imposed at the left
inferior lateral and the inferior boundaries of the domain to simulate the casting velocity or the jet outlet velocity of the fluid according to the phase change. At low outflow velocity uout=8.65×10⁻⁵ m/s
(Re=0.00054), see top left panel of the figure, a uniform pattern of the flow is observed inside the
whole domain. The glass temperature is high at the entrance of the channel and decreases abruptly after the step, with strong gradients of temperature that intensify the heat transfer. Furthermore, the glass temperature decreases significantly after the middle part of the domain. The flow also experiments a phase change, with a liquid phase at the entrance of the channel; however, after the step the fluid becomes solid. The temperature and phase changes are due to the high heat fluxes just after the step of the channel. The pressure field indicates high pressure in the inlet flow region and constant low pressure from the step to the outlet of the domain. Increasing the outflow velocity to uout=8.65×10
-2
m/s (Re=0.54), see top right panel of the figure, a uniform pattern of the flow is also observed inside the whole domain. However, the glass temperature does not change after the step and remains almost constant through the domain, experimenting a slight change near the wall at the inferior part of the domain. As a consequence of this constant temperature, the flow does not experiment a phase change, a liquid phase being observed through the whole domain. The constant temperature and phase can be associated with the velocity of the fluid, which is sufficiently fast to exchange heat with the surroundings in such a way that there is low total heat transfer. The pressure field indicates no change in the pressure of the flow inside the domain, except for a slight change of pressure at the channel entrances. At high outflow velocity uout=8.65×100
m/s (Re=54), see bottom panel of the figure, a complex non-uniform pattern of the flow is observed inside the whole domain. Vortex formation can be identified as a consequence of the interaction of the high velocity flow with the step of the channel. The pressure field shows high pressure at the flow inlet, and then the pressure decreases right at the zone where the core of the vortex is located. Finally, the flow increases its pressure and leaves the domain with high pressure. The pressure changes through the channel are due to the perturbation provoked by vortex formation. The maximum velocity in the center of the velocity profile at the inlet of the channel is 6.76% of the imposed outflow velocity for uout=8.65×10⁻⁵ m/s,
6.65% of the imposed outflow velocity for uout=8.65×10
-2
m/s and 4.27% of the imposed outflow velocity for uout=8.65×100 m/s. On the
other hand, the outlet temperature of the glass is 27% of the inlet temperature for uout=8.65×10⁻⁵ m/s,
98% of the inlet temperature for uout=8.65×10⁻² m/s
and 100% of the inlet temperature for uout=8.65×10 0
Figure 3: Temperature, streamline, phase change and pressure fields for a channel with inclined backward-facing step with φ=90°. Left: uout=8.65×10⁻⁵ m/s. Middle: uout=8.65×10⁻² m/s. Right uout=8.65×100 m/s.
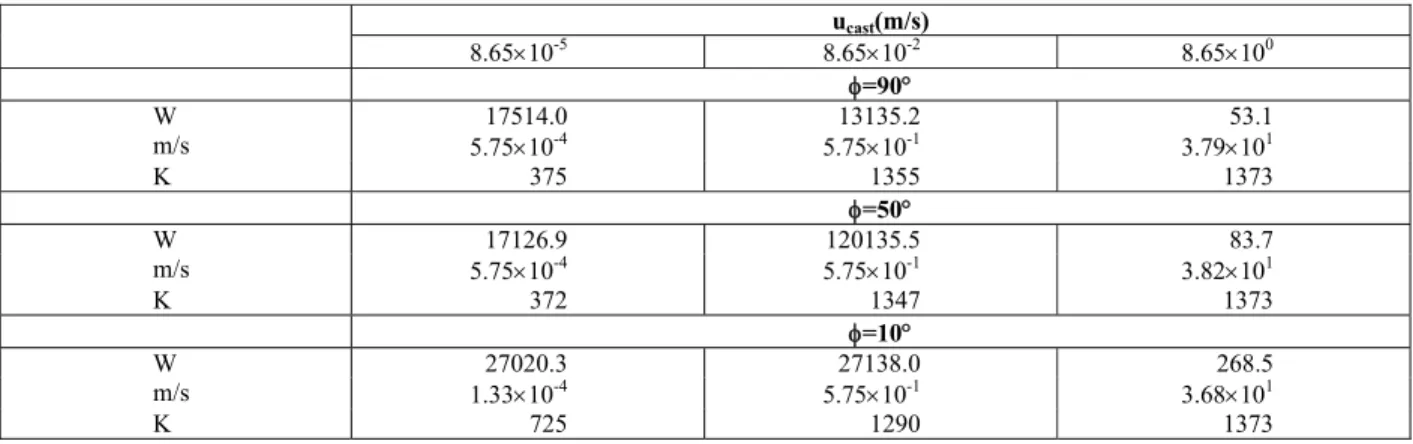
Table 2: Total heat transfer through the non-adiabatic boundary of the domain, inlet velocity and outlet temperature.
ucast(m/s)
8.65×10⁻⁵ 8.65×10⁻² 8.65×100
φ=90°
W 17514.0 13135.2 53.1
m/s 5.75×10⁻⁴ 5.75×10⁻¹ 3.79×101
K 375 1355 1373
φ=50°
W 17126.9 120135.5 83.7
m/s 5.75×10⁻⁴ 5.75×10⁻¹ 3.82×101
K 372 1347 1373
φ=10°
W 27020.3 27138.0 268.5
m/s 1.33×10⁻⁴ 5.75×10⁻¹ 3.68×101
K 725 1290 1373
CASE φ=50°
Figure 4 shows the temperature, streamline, phase change and pressure fields of the flow that exists from a short channel with a 50° inclined backward-facing step with three different outflow velocities of the fluid which are imposed to simulate the casting velocity or the jet outlet velocity of the fluid, depending on the phase change. In these cases, the step of the channel is smoothed to investigate the influence of the step geometry on the fluid behaviour. At low outflow velocity uout=8.65×10
-5
m/s (Re=0.00054), see top left panel of the figure, the mushy region where the liquid and solid phase coexist can be clearly observed and the latent heat of fusion is released during the solidification process. However, the pattern of the flow inside the whole domain is uniform. The glass temperature is high at the entrance of the channel and low after the middle
part of the domain, with a strong temperature gradient near the step region. The fluid flow is characterized by three different zones: liquid, mushy and solid zones, the cooling process that takes place in the mushy zone being of great importance from the point of view of material properties. The temperature and phase changes are due to the high heat fluxes just after the step of the channel. The pressure field indicates no change in the pressure of the flow inside the domain. Increasing the outflow velocity to uout=8.65×10⁻² m/s (Re=0.54), see top
panel of the figure, vortex formation is also observed due to the interaction of the high velocity flow with the step of the channel, which generates instabilities of the boundary layer located at the step wall. The pressure field shows slight changes in the step zone, the glass temperature is constant and the fluid remains in the liquid phase. The ratio between the maximum velocity in the center of the velocity profile at the inlet of the channel and the imposed outflow velocity of the glass and the ratio between the inlet temperature and the outlet temperature of the glass are practically the same as in the previous case (φ=90°). Values of the maximum velocity at the inlet of the channel and the outlet temperature of glass for this case can also be seen in Table 2.
CASE φ=10°
In order to describe in detail the effect of the step angle, simulations were done for the flow that exits from a short channel with a 10° inclined backward-facing step. The temperature, streamline, phase change and pressure fields are shown in Figure 5. Three different outflow velocities of the fluid are also explored and imposed at the inferior boundary of the domain to simulate the casting velocity or the jet outlet velocity of the fluid. For a low outflow velocity of uout=8.65×10⁻⁵ m/s (Re=0.00054), see top
left panel of the figure, the temperature field is more complex than the previous cases with the same outflow velocity. The glass experiments large temperature gradients along the whole domain, which produce an irregular mushy zone that also extends along the domain. This complex interaction between the thermal-fluid dynamic and the geometry of the channel generates liquid-solid interface-breaking. As a result of this irregular behaviour of the phase-change region, the material could modify its properties. The temperature field shows that the hot fluid extends almost until the central part of the domain, while the cold fluid is located in a narrow region near the inferior lower part of the domain. The pressure is high at the inflow region and the streamlines are uniform along the axis of the domain. Increasing the outflow velocity to uout=8.65×10⁻² m/s
(Re=0.54), see top right panel of the figure, a constant temperature is observed along the whole domain with no phase change and uniform patterns of the fluid. When the outflow velocity is increased to uout=8.65×100 m/s (Re=54), see bottom panel of
the figure, the vortex distribution and evolution are weaker than those of φ=90° and φ=50°. The size of the vortices is reduced due to the smooth transition
of the channel, the glass is liquid and its temperature is constant in the whole domain. The fluid experiments reduction of pressure at the step region, with a significant increase of pressure at the outlet of the domain. The pressure pattern at the inlet flow region for uout=8.65×10²m/s and φ=90° is different
from the pressure pattern of φ=50° and φ=10° with the same uout velocity because, for φ=90°, the fluid
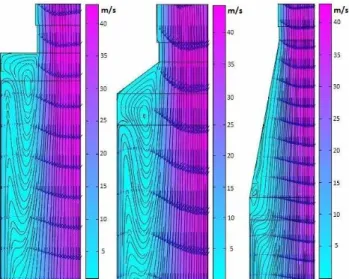
experiments an abrupt change in the channel step, generating a transversal pressure gradient at the inlet of the channel. The differences of the pressure patterns are due to the perturbation produced by the strong change in the transversal area of the channel with φ=90° on the fluid dynamics of glass. Figure 6 shows details of vortex formation due to the sudden change in the flow velocity at the step region for the three different step angles at the largest outflow velocity studied. The flow is characterized by the flow separation from the step corner, which is reduced as the step angle decreases. For φ=90° and
Figure 4: Temperature, streamline, phase change and pressure fields for a channel with inclined backward-facing step with φ=50°. Left: uout=8.65×10⁻⁵ m/s. Middle: uout=8.65×10⁻² m/s. Right uout=8.65×100 m/s.
Figure 5: Temperature, streamline, phase change and pressure fields for a channel with inclined backward-facing step with φ=10°. Left: uout=8.65×10⁻⁵ m/s. Middle: uout=8.65×10⁻² m/s. Right uout=8.65×100 m/s.
Figure 6: Detail of vortex formation for a channel with an inclined backward-facing step and uout=8.65×100 m/s.
The cooling process of the glass can be seen in Figures 7-9. For the highest outflow velocity, uout=8.65×100 m/s, there is a peak of the conductive
heat flux at a certain position of the boundary of the domain, these values being qmax=2541.08 W/m2 at
x=0.2 m for φ=90°, qmax=9290.27 W/m2 at x=0.2 m for
φ=50° and qmax=14598.06 W/m2 at x=1.6 m for φ=10°.
For uout=8.65×10⁻² m/s, the heat flux peaks are
qmax=37614.5 W/m2 at x=0.15 m for φ=90°,
qmax=96407.7 W/m2 at x=0.25 m for φ=50° and
qmax=129749.06 W/m2 at x=1.6 m for φ=10°. For the
lowest casting velocity, uout=8.65×10⁻⁵ m/s, the
maximum released heat occurs near the entrance channel, its values being qmax=60618.10 W/m2 at x=0.2
m for φ=90°, qmax=68508.4 W/m2 at x=0.2 m for
φ=50° and qmax=53180.7 W/m2 at x=0.5 m for φ=10°.
The instabilities observed in Figure 8 for uout=8.65×10 -2
m/s can be associated with the fluid temperature perturbation in a thin region in the inferior part near the boundary of the domain; in this region, the fluid starts to cool for φ=90°. When φ decreases to 50°, the instabilities are intensified due to a perturbation not only in the temperature field, but also in the phase change field. In the above two cases, the peak of the perturbation occurs near the exit of the short channel. However, when the step angle is reduced to 10°, the position of the perturbation is moved to the bottom end of the domain. This suggests that the φ parameter can be used to control the position of the heat flux instabilities, which can be of major importance for controlling the final properties of the material. In order to get insight into the global cooling process, we compute the total heat transfer through the non-adiabatic boundary of the domain:
Q=
∫
qdA,increasing the outflow velocity of the fluid, the total heat transfer decreases as expected because there is no
change of phase and the field temperature remains constant. For φ=10° the total heat transfer is practically the same for uout=8.65×10
-5
m/s and uout=8.65×10 -2
m/s. However, there are significant differences of total heat transfer for φ=50° and φ=90° in the range of uout=8.65×10
-5
m/s and uout=8.65×10 -2
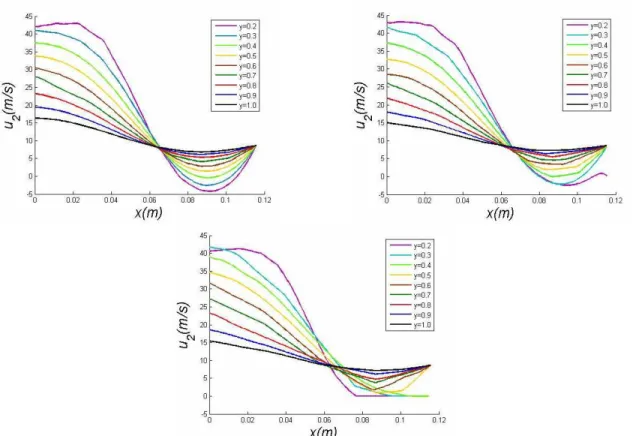
m/s. Reducing the step angle of the channel increases the total heat transfer. Table 2 shows the values of the total heat transfer for the cases analyzed. In Figures 10 and 11, the axial velocity profiles are shown as a function of the transversal coordinate just after the exit from the short channel for the three different step angles explored with two of the outflow velocities. In all cases, the maximum axial velocity is reached at the center axial line of the channel. Furthermore, this velocity decreases as the transversal coordinate is increased. Figure 12 shows the streamwise velocity profiles as a function of the transversal coordinate for the larger outflow velocity (uout=8.65×100 m/s) with
the three different configurations of the channel step at different positions of the axial coordinate. In the central part of the domain, the axial velocity of the flow decreases as the fluid moves far away from the step region. For φ=90° and φ=50°, there is an axial line where the velocity of the flow remains constant (9 m/s); see the point (x=0.065 m) where the profiles cross themselves in the upper and middle panel of the figure. After this point (x=0.065 m), the fluid reduces its axial velocity when φ=90° and, near the step, some of these velocities become negative, indicating recirculation of the flow; on the boundary of the domain, the axial velocity is equal to the imposed outflow velocity. This behaviour is maintained for
φ=50°; however, in this case the axial velocity on the boundary of the domain is zero due to the non-slip condition imposed at the wall of the channel. For
φ=10°, the axial velocity profiles cross near x=0.065 m without a constant velocity. In this case, the axial velocity profiles for y=0.2, y=0.3, y=0.4 are zero and correspond to the velocity of the wall of the channel.
Figure 7: Heat fluxes through the non-adiabatic boundary of the domain foruout=8.65×10⁻⁵ m/s.
Figure 9: Heat fluxes through the non-adiabatic boundary of the domain for uout=8.65×100 m/s.
Figure 10: Axial velocity profiles as a function of the transversal coordinate just after the exit of the short channel for uout=8.65×10⁻⁵ m/s.
Figure 11: Axial velocity profiles as a function of the transversal coordinate just after the exit from the short channel for uout=8.65×10⁻² m/s.
Figure 12: Axial velocity profiles as a function of the transversal coordinate for uout=8.65×100 m/s at different position of the axial
CONCLUSIONS
This study was carried out by the numerical solution of the Navier-Stokes equations coupled with the energy equation, using finite element and adaptive meshes. The Darcian approximation was implemented in order to take account of the damping of the velocity when the solidification occurs in a glass flow. We studied the interaction between fluid dynamics, heat transfer and phase change in an outflowing fluid from a short channel with hot temperature at the entrance of the channel. The outflow velocity of the fluid was imposed at the inferior boundary of the domain and on the left inferior lateral boundary of the domain to simulate the casting velocity when the fluid is solidified or the jet velocity when the fluid experiments no phase change. No-slip boundary conditions were imposed at all solid walls. Simulations were performed for three different outflow velocities, characterized by the Reynolds number [0.00054 ≤ Re ≤ 54]. In order to explore the influence of the geometry of the channel step, three different step inclination angles [φ=90°, φ=50°, φ=10°] were analyzed. For low casting or fluid jet velocities, phase change occurs and strong thermal gradients appear near the solidification front to release the latent heat; furthermore, the temperature of the glass decreases gradually along the domain. Upon increasing the step inclination angle, the solidification zone is located near the step region. An important result is given by the fact that breaking of the mushy region occurs for
φ=10°, characterized by the irregular behaviour of the phase change field. Hence, this fluid dynamics behavior has a significant influence on the final casting quality and solidification sequence. For high casting or fluid jet velocities, the total heat transfer in the fluid is reduced because the fluid does not have time to exchange heat with the surrounding. A low pressure zone appears just at the step region; as a result, the fluid is expanded, reducing the velocity in the process to accommodate for the larger cross-section. The above fluid behaviour produces vortex formation with flow separation from the main stream due to the geometry expansion and a recirculation region appears just in front of the step. The greater the step inclination angle, the greater the intensity of the vortex, which creates secondary vorticity with opposite sign downstream. For φ=90° and φ=50°, it was found that the heat flux peak occurs near the outlet of the short channel. However, for φ=10° the
flux peak occur near the inferior end of the domain as the fluid velocity is increased. Instabilities in the local heat fluxes were observed for uout=8.65×10⁻²
m/s. Furthermore, decreasing the step angle increases the intensity of the perturbation and the location of these instabilities changes in the domain. The model implemented in this work captures the effect of the fluid velocity associated with the step inclination angle on the phase change process and the conduction heat transfer phenomena for a glass flow in a short channel. So far, this study is limited to the Reynolds number range of [0.00054, 54], but it is useful for understanding heat transfer, phase change and vortex formation in the solidification process of a glass flow. The dynamic behavior beyond this range is the subject of ongoing research. We found that, for a Reynolds number of 0.54 and a step inclination angle of φ=50°, the order of magnitude of the heat flux is 104 W/m2; this agrees with the result reported by Jimenéz (2002).
NOMENCLATURE
a
c Liquid phase fraction
b
c Permeability constant
p
C Specific heat J/kg⋅K
0
c ( )Ω Continuous function in Ω f
G
Body forces N/m3 1
g
G Dirichlet boundary
condition of velocity
m/s
3 g
G Dirichlet boundary
condition of temperature
m/s
1h g
G Approximation of velocity
Dirichlet boundary
m/s
3h g
G Approximation of
temperature Dirichlet boundary
K
h Spatial step m
k thermal conductivity W/m⋅K
L Length m
oh
L Space of trial function for pressure
Pa
h
L Space of finite element trial function for pressure
Pa
p Pressure Pa
1
P Polynomial space of degree one
h
p Approximation of pressure finite element
Pa
h
Q Heating power per unit volume
W/m3 Re Reynolds number
T Temperature K
m
T Casting temperature K
out
T Outlet temperature K
in
T Inlet temperature
h
T Approximation of
temperature finite element
K
u
G Velocity vector m/s
1
u Transversal velocity component
m/s
2
u Axial velocity component m/s
h u
G Approximation of velocity
finite element
m/s
h
vG Trial function of velocity m/s oh
V Space of trial function for velocity
m/s
h
V Space of finite element trial function for velocity
m/s
oh
W Space of trial function for temperature
K
h
W Space of finite element trial function for temperature
K
XG Spatial coordinate vector m x Transversal coordinate m y Axial coordinate m
yΓ Boundary Γ on the domain
Greek Symbols
∇ Nabla operator
Δ Laplacian operator
ρ Density kg/m3
ν Kinematic viscosity m2/s
Ω Bidimensional region
δ Latent heat distribution function
1/k
ε Small number
T
Δ Phase change temperature range
K
H
Δ Enthalpy change J/kg
τ Finite element triangulation h
τ Finite element triangulation of size h
h 2
τ Finite element triangulation of size h/2
Ω Polygonal domain h
θ Trial function of temperature
K
1
Γ Dirichlet boundary of velocity
m/s
3
Γ Dirichlet boundary of temperature
K
ACKNOWLEDGEMENTS
This research was supported by PROMEP grant 103.5/08/2682.
REFERENCES
Alexiades, V., Hannoun, N. and Mai, T. Z., Tin melting: effect of grid size and scheme on the numerical solution. Fifth Mississippi State Conference on Differential Equations and Computational Simulations, Electronic Journal of Differential Equations, Conference 10, pp. 55-69 (2003).
Chorin, A., Numerical study of slightly viscous flow. J. Fluid Mech. 57, pp. 785-796 (1973).
Dean, E. J. and Glowinski, R., A wave equation approach to the numerical solution of the Navier-Stokes equations for incompressible viscous flow. C. R. Acad. Sci. Paris, 325, Serie I, pp. 789-797 (1997).
Dean, E. J., Glowinski, R. and Pan, T. W., A wave equation approach to the numerical simulation of incompressible viscous fluid flow modeled by the Navier-Stokes equations. Mathematical and numerical aspects of wave propagation. Edited by J. A. de Santo, SIAM, Philadelphia (1998).
Giannopapa, C. G., Development of a computer simulation model for blowing glass container. 2006 ASME Conference Proceeding PVP, Vancuver, Canada, pp. 165-172 (2006).
Giessler, C., Schlegelm, R. and Thess, A., Numerical investigation of the flow of a glass melt through a long circular pipe. International Journal of Heat and Fluid Flow 29, pp. 1462-1468 (2008).
Glowinski, R., Numerical methods for fluids. Part 3. Handbook of Numerical Analysis, vol. IX, P. G. Garlet and J. L. Lions eds., North-Holland, Amsterdam (2003).
Glowinski, R., Pironneau, O., Finite element methods for the Navier-Stokes equations, Annual rev. Fluid Mech. 24, pp. 167-204 (1992).
Glowinski, R. and Le Tallec, P., Augmented Lagrangian and operator-splitting methods in nonlinear mechanics. SIAM, Philadelphia (1989).
vidrio. M.Sc. Thesis, Veracruz Institute of Technology, Mexico (2002).
Marechuk, G. I., Splitting and alternate direction methods. Handbook of Numerical Analysis 1, P. G. Garlet and J. L. Lions eds., North-Holland, Amsterdam, pp. 197-462 (1990).
Mirbagheri, S. M. H., Esmaeileian, H., Serajzadeh, S., Varahram, N. and Davami, P., Simulation of melt flow in coated mould cavity in the casting process. Journal of Materials Processing Technology 142, pp. 493-507 (2003).
Salinas, C. H., Alloy aluminum solidification in square section. Rev. Fac. Ing. Univ. Tarapacá 14, pp. 16-25 (2006).
Shmueli, H., Ziskind, G. and Letan, R., Investigation of melting in a vertical circular tube: local heat fluxes. Proceedings of 2008 ASME Summer Heat Transfer Conference, Jacksonville, USA, pp. 1-5 (2008).