ISSN 0104-6632 Printed in Brazil
www.abeq.org.br/bjche
Vol. 26, No. 02, pp. 317 - 329, April - June, 2009
Brazilian Journal
of Chemical
Engineering
STUDY OF THE MICROWAVE VACUUM DRYING
PROCESS FOR A GRANULATED PRODUCT
M. N. Berteli
1,*, E. Rodier
2and A. Marsaioli Jr.
1,31
Grupo de Engenharia e Pós-Colheita, Instituto de Tecnologia de Alimentos, (ITAL), Fone: + (55) (19) 3743-1835, Fax: + (55) (19) 3743-1829, Av. Brasil 2880,
CEP: 13070-178, Jardim Chapadão, Campinas - SP, Brasil,
2
Centre de Poudres et Procédés, UMR CNRS 2392, École des Mines d’Albi, Carmaux, Albi, France.
3
Departamento de Termofluidodinâmica, (DTF), Faculdade de Engenharia Química, (FEQ), Universidade Estadual de Campinas (UNICAMP) Campinas - SP, Brazil.
E-mail: [email protected], E-mail: [email protected]
(Submitted: May 6, 2008 ; Revised: September 1, 2008 ; Accepted: September 26, 2008)
Abstract - The objectives of this work were to study and evaluate the process of drying a pharmaceutical granule from 21% to 3 % (d.b.) moisture, also determining the power absorbed by the product, using a microwave assisted vacuum dryer with two absolute pressures: 50 and 75 mbar. A specific objective was to compare the drying kinetics of the microwave assisted vacuum process (MAVP) with two other drying processes, one using hot air convection and the other combining microwaves with hot air convection. The results of such a study showed that the drying kinetics were not affected by the vacuum levels, whereas the absorbed microwave power was higher for smaller vacuum levels. It was also observed that the samples obtained by the microwave assisted vacuum process, when submitted to compression, complied with the required specifications. The drying kinetics of the MAVP showed the shortest drying times when compared to the other drying processes.
Keywords: Drying; Vacuum; Microwave; Granule.
INTRODUCTION
The wet granulation stage is a central unit operation in the processing industry, being used, for example, in the food, fertilizer and pharmaceutical sectors. In this method, powder particulates are agglomerated due to the interaction between particles caused by the addition of a granulation liquid, the solvent (Rantanen, et al., 1998). During granulation the particles are linked by atomic and inter-molecular interactions such as Van der Waals forces and hydrogen bonds (Lê Hir, 1997). According to Pietch (1991), cited by Bika et al (2005), an accepted view is that the liquid binder wets and spreads in the interstices between the primary particles, forming liquid bridges that hold them together by capillary and viscous forces. These wet or “green” granules are subsequently dried, and liquid evaporates from
the bridges to leave behind solid bridges that impart mechanical strength to the dry granule.
Such an operation is part of the process for countless pharmaceutical formulations. The granule is an intermediate stage very often present during the production of tablets, although it can be used directly as a multi-dose pattern, or divided into single doses.
One possible way of carrying out the drying of powders and granules is by convective hot air or under a flow of inert gas, combined with the application of microwaves. The energy is transmitted directly to the bulk of wet material almost instantaneously, in contrast to other heat transfer methods, where heat transfer from the surface to the interior of the product is ten to twenty times slower.
Brazilian Journal of Chemical Engineering
electromagnetic energy penetrates the dielectric material, a transformation into heat occurs by a number of mechanisms at the molecular and atomic levels, amongst which ionic conduction and dipolar rotation stand out (Schiffmann, 1987).
The parameters characterizing dielectric materials
are: the relative permittivity ε’ (or dielectric constant),
that represents the capacity of the material to store the electrical field in a reversible manner; the relative loss
factor ε”, indicating the capacity of the material to
dissipate electrical energy irreversibly in the form of heat; the loss tangent, which is the quotient between the
two previous parameters:tanα = ε ε" '.
Microwaves are not usually applied alone in the drying process, but are combined with conventional heating. The combined dielectric plus forced convection heating exhibits a synergistic effect on the drying process, that is, a higher drying speed as compared to forced convection drying or microwave drying, considered separately. This happens because the pressure gradient inside the product due to the dielectric heating favors the transport of moisture to the surface, from where it is removed by the hot air (Smith, 1979).
The use of vacuum in the microwave drying process could be of interest especially for thermo-labile products such as food and pharmaceutical powders and granules (Kelen et al., 2006a; Kelen et al., 2006b; Kelen et al., 2006c). In effect, the use of vacuum lowers the solvent boiling temperature, permitting operation at lower temperatures, directly influencing final product quality (Péré and Rodier, 2002).
Drouzas & Saravacos (1999) reported on the study of a combined process for drying by microwaves under vacuum, starting from a model fruit gel, aiming to dry from 38% d.b. to 3% d.b. The drying operation took just 4 minutes. By comparison, similar gel samples dried using hot air at 60°C under atmospheric pressure, took 8 hours to reduce the product moisture to 10%. This same product, when compared to that obtained by microwave assisted drying at atmospheric pressure,
exhibited a darker color.
In another example of microwave drying under vacuum carried out with carrots (Cui et al., 2004), a great influence of the power levels applied in relation to the drying kinetics curves of the product was observed. On the other hand, the variation in vacuum pressure showed little influence on the kinetics.
Microwave vacuum drying was also investigated as a potential method for obtaining high quality dried honey (Cui et al., 2008). In this study the drying curves and the temperature changes of the samples were tested during microwave vacuum drying at
different microwave powers and vacuum pressure levels. It was observed that the temperatures assumed by the honey being dried were very close to the water saturation temperatures corresponding to the vacuum levels applied (30 and 50mbar) at the beginning of the drying period, when much water needed to be evaporated. In the latter drying stages, when only a small amount of water was available, and the energy needed for moisture vaporization was much less than the thermal energy converted from the microwave power, the sample temperature was higher than the water saturation temperature. It could also be observed that the higher the microwave power density, the faster the drying rate. In the latter drying stages, the temperature of the low moisture sample rises rapidly if the microwave power is not properly supplied. Thus, sophisticated process controls are needed to obtain high evaporation rates under gentle conditions with minimal deterioration of temperature-sensitive compounds in the materials being dried. The study of the effect of vacuum pressure on the drying curves showed that the drying curves at 50 mbar were almost the same as those at 30 mbar.
In another study (Yu Li et al., 2007), fresh garlic slices were dried to a final moisture content of about 5% (wet basis) by two methods: freeze drying and microwave-vacuum combined with final vacuum drying MVD/VD. According to the authors, amongst others, freeze drying is still the best drying method to obtain high quality dried materials, although it was much more time-consuming than MVD/VD. However, the latter technology can provide a good quality finished product, comparable to the product prepared by freeze drying and conserving similarly high allicin contents. In addition, freeze drying shows other disadvantages in the drying of garlic slices, such as the use of expensive equipment, high energy consumption and high costs. They therefore concluded that garlic slices dried by MVD/VD would obviously be much more competitive on the market than those dried by freeze drying.
Study of the Microwave Vacuum Drying Process for a Granulated Product 319
them, and made it necessary to apply a greater compressing force in the case of the granules prepared from material obtained using the microwave-vacuum drying process. At the same time, the mass distribution and disintegration time were not affected.
The objectives of the present work were to study the drying kinetics of a pharmaceutical granule that is the basis of the drug hydrochlorthiazide (HCT), from the initial moisture content of around 21% (d.b.) to the final moisture content of 3% (d.b.), as well as determining the power absorbed by the product at 20 W of incident power, using a microwave assisted vacuum dryer under two absolute pressure conditions: 50 and 75 mbar. A specific objective was to compare the drying kinetics of the microwave assisted vacuum process with two other drying processes, one using hot air convection and the other combining microwaves with hot air convection.
MATERIAL AND METHODS
The raw material employed was the compositional basis of a pharmaceutical drug called hydrochlorthiazide (HCT). The initial moisture content was about 21 % d.b., which was to be reduced to 3 % d.b. HCT is composed of 30 % of the effective drug active principle, plus excipients of 28 % mannitol, 42 % corn starch and de-ionized water
as the moistening agent(Calligaris, 2001).
Characterization of the Constituent Powders
Density
The densities of the HCT, corn starch and mannitol were determined using a Micromeritics - USA, AccuPyc 1130 helium pycnometer, belonging to the Centre de Poudres et Procédés, École des Mines d’Albi Carmaux - France. The determinations were carried out starting from the dried materials at a temperature of around 27°C. The results obtained
were: HCT = 1.692 g/cm3; corn starch = 1.521
g/cm3; and mannitol = 1.486 g/cm3.
Calorimetric Measurements
These measurements were carried out in order to obtain information concerning any eventual structure evolution of the effective drug principle within the
granules during the drying process (Figure 1). Measurements were carried out in a Perkin Elmer DSC-7 (USA) equipment, of the Centre de Poudres et Procédés.
The measurements showed that no modifications were observed in the temperature range from 20 to 80°C. Thus, a similar temperature ramp was chosen because the temperature of the granule was not allowed to exceed 70°C, in order to preserve the effective drug principle (HCT) (Calligaris, 2001).
Granulation
HCT granules were obtained in the proportions described above, using a Laboratory Mixer – P1/6, Diosna (Germany) belonging to the Centre de Poudres et Procédés, using the following stages and operational parameters:
Blending of the powdered constituents:
blender speed: 360 rpm/min;
blending time: 5 min;
initial amount of powders: 0.5kg.
Moistened granulation, with the addition of de-ionized water as the solvent:
blender speed: 360 rpm;
granulator speed: 1500 rpm/min;
granulation time: 10 min, with a maximum time
of 5 min to add the water;
water flow rate: 0.025 l/min; amount of water:
0.12 l.
After granulation, the granules were submitted to sifting at 2mm mesh. The initial moisture content was maintained in the range from 20 to 22% d.b. (16.67 – 18.03% w.b.).
CHARACTERIZATION OF THE GRANULE
Particle Size Distribution
Brazilian Journal of Chemical Engineering
Figure 1: Calorimetric determination - HCT
0 10 20 30 40 50
0.0 0.5 1.0 1.5 2.0
Size of Opening (mm)
Pe
rc
ent
a
ge (%
)
0 20 40 60 80 100
0.0 0.5 1.0 1.5 2.0
Diameter (mm)
%,
sma
ller or
equal to
Figure 2: Particle size distribution of the granules. Figure 3: Granulometric curve for the granules.
Sorption Isotherm
The sorption isotherm curve was prepared using the Dynamic Vapor System (DVS) SMS, UK (Arlabosse, et al., 2003) of Centre de Poudres et Procédés. It can be observed that the granules are at equilibrium under conditions of high water activities and low water contents. The curve showed to be atypical when compared to the separated sorption curves of either corn starch or sugars (Iglesias & Chirife, 1982): the corn starch curves, for example, show the product in equilibrium with a water activity
near the value 0.9 at a moisture content of 0.25 kg water per kg dry matter.
As the behavior shown by Figure 4 was not expected, one single experiment was devised in order to confirm such a result: a sample of granules at 42% moisture (d. b.) was placed into a Petri dish under ambient conditions (average temperature 27°C and relative humidity ranging from 66 to 70%) and allowed to stay for 24 hours before another observation. The material moisture was then determined and a 3% d.b. value was found, demonstrating the equilibrium condition of a low moisture granule.
0.000 0.005 0.010 0.015 0.020 0.025 0.030
0 0.2 0.4 0.6 0.8 1
Water activity, aw
Moistu
re con
ten
t,
X
Adsorption Desorption
Study of the Microwave Vacuum Drying Process for a Granulated Product 321
Scanning Electronic Microscopy (SEM)
After microwave assisted vacuum drying, both the moistened and dry granules were analyzed by low vacuum SEM (FEI Company – USA, XL30ESEM FEG), of the Centre de Poudres et Procédés. A GSE (gaseous secondary electrons) detector was used to capture the images of the granules.
Laboratory Scale Microwave Vacuum Dryer
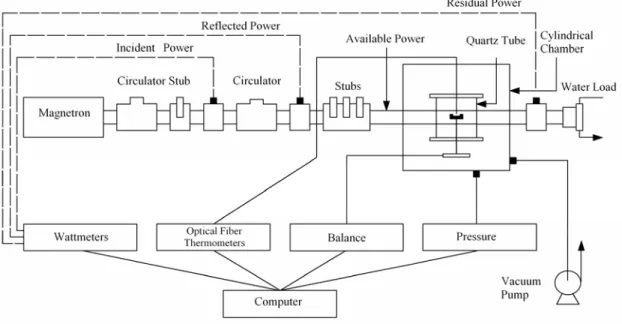
The experiments were carried out using an equipment, developed at the Centre de Poudres et Procédés, composed of a cylindrical vacuum chamber of about 100 liters volumetric capacity (Figure 5), crossed by a horizontal single mode microwave guide (Péré, Rodier, 2002). Most of the waveguide was at atmospheric pressure, except for inside a vertical quartz tube, where the pressure was reduced. Quartz was used since it does not absorb microwaves.
The microwaves were generated by a magnetron at one end of the waveguide, at a frequency of 2450 MHz. Four stubs and two circulators were located on the guide so as to protect the magnetron against reflected power and to control the incident power arriving in the product. The first stub reflected most of the power coming from the magnetron towards the first
circulator. The three other stubs allowed for the smooth regulation of the microwave power furnished to the product. Thus, since the magnetron provided 800W of a fixed power, the
product received a remainingpower that could be
varied from 10 to 100 W. In this study the incident power was adjusted to a fixed value of 20 W (Berteli et al., 2007).
During the drying operation, the values of mass (precision ± 0.001 g), microwave power (precision ± 0.1 W) and pressure (precision ± 5 mbar) were recorded continuously by a data acquisition system.
In order to study the drying kinetics and the microwave power absorbed by the HCT granules, the experiments were run at two absolute pressure levels, 50mbar and 75mbar, for samples weighing 1.4g, with an average moisture content of 21% d.b. Five repetitions were made at the two absolute pressure levels.
To monitor temperature evolution in the sample, after each microwave vacuum drying cycle, the system was turned off and a Testo 925 (Germany) type thermocouple inserted into the sample. The readings were taken at six different cycles times (3, 6, 9, 12, 15 and 20 minutes), in triplicate for each cycle, for each absolute operational pressure.
The final product moisture was determined with an infrared dryer LJ16 (Mettler-Toledo, France) at the end of each experiment.
Brazilian Journal of Chemical Engineering
Visualization and Behavior under Compression
The dry granule obtained from the microwave
vacuum drying process was compressed using an
Instron (USA) 5567 press, belonging to the Centre de Poudres et Procédés. The compression system of this single-axis press was based on the movement of an upper punch, whereas the lower punch was fixed. The press was equipped with a force catcher, being able to reach up to 30kN. The dies that were used had a cylindrical geometry and were made of stainless steel or of treated copper, having different diameters and heights. The compression speed ranged from 0 to 55mm/min.
The work was developed using the 25kN force at a compression speed of 15mm/min for the product dried at 75 mbar of absolute pressure and at a compression speed of 5mm/min for the product dried at 50 mbar of absolute pressure. Compression was carried out with and without the addition of lubricants, which were composed of 5% talcum and 5% magnesium stearate.
The images of the tablets were obtained by SEM - USA with a BSE detector (Electron Backscattering), providing images that were generated by chemical contrast, that is, elements with higher atomic numbers showed up more brilliant than those with lower atomic numbers.
RESULTS
Microwave Assisted Vacuum Drying
Drying Kinetics
The mass values of the material were registered by a data acquisition system at 5 second intervals. The graphical representations were plotted for an average of five tests for each pressure in order to check the influence of pressure on the drying kinetics of the HCT granule.
As can be seen in Figure 6, most of the moisture was eliminated at the beginning of the drying process. When drying at 50 mbar, the beginning of the process was considered to extend up to a mean time of 400 s. During this period the moisture content of the granule decreased from an initial average value of 24% d.b to an average value of 4% d.b. In the following 400 s the granules reached 3% of moisture. At the end of the total treatment time of 1200 s, the product presented a moisture content of 1.6% d.b. From the sorption isotherm, it can be seen that, with a moisture content above 3% d.b, the product possessed free or unbound water, thus explaining the greater ease of drying up to this moisture value. Also from Figure 6, it can be seen that, at 75 mbar, the product started from an average value of 27% d.b. and reached an average moisture content of about 4% d.b. during the first 500 s, and at
the end of the 1200 s the product reached a moisture content of 2% d.b.
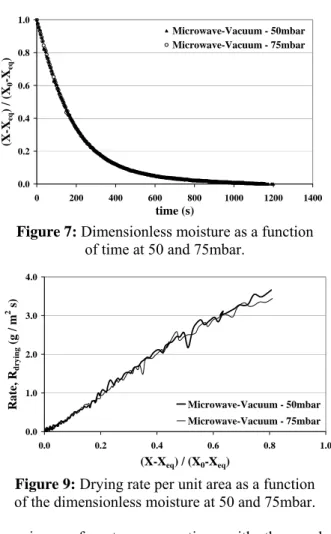
Figure 7 shows the drying curve obtained with a
dimensionless moisture ratio
(
X−Xeq) (
X0−Xeq)
onthe ordinate axis. The moisture X is defined as being the ratio of the mass of water in the product to
the mass of dried solids; Xeq as being the equilibrium
moisture under the air conditions andX0, the initial
moisture content of the product.
The equilibrium moistures applied to these calculations were equivalent to the final moisture values reached in the experiments at the pressures 50 and 75 mbar, being respectively 1.6 and 2.0% d.b. The curves were plotted starting from the same initial moisture content for both experiments.
According to Figure 7, it can be observed that the evolution of water loss as a function of time was equal for both absolute pressures.
Figures 8 and 9 show the curves obtained
considering the rate of evaporation density (Rdrying).
By definition, Rdrying is the mass of water evaporated
per unit of contact surface area of the product on the
support and per unit time (g / m2 s), being calculated
from the equation:
sol drying
M dX
R
A dt
= − ⋅
The drying rate as a function of the material moisture content is shown in Figure 8, and the drying rate per unit area as a function of the dimensionless moisture content is represented in Figure 9.
The derivative of X as a function of time was calculated between two consecutive points. The curves for each rate were then plotted from the average of ten consecutive points, so as to make them more visible.
It can be noticed that the evolution rate as a function of X was linear. Calculating the diffusivity constant
for 50 mbar, with k50 given in s-1, one obtains:
m dX
k .X
dt = , with k50mean = 4.891s
-1
An initially increasing rate can be observed in Figure 8 for the absolute pressure of 75 mbar. For the experiments at 75mbar, the initial moisture of the material was slightly higher than for the experiments at 50mbar. Also, the required unit energy for evaporation was less at the smaller pressure, the latent heat of evaporation for water at 50 mbar being equal to 2423.8 kJ/kg and at 75 mbar to 2406.1 kJ/kg. Probably such an initial gain was due to the higher water content and energy availability.
Study of the Microwave Vacuum Drying Process for a Granulated Product 323
0.00 0.10 0.20 0.30
0 200 400 600 800 1000 1200 1400
time (s)
M
o
isture con
tent, X (d. b.)
Microwave-Vacuum - 50mbar
Microwave-Vacuum - 75mbar
0.0 0.2 0.4 0.6 0.8 1.0
0 200 400 600 800 1000 1200 1400
time (s)
(X
-X
eq
) /
(X
0
-X
eq
)
Microwave-Vacuum - 50mbar Microwave-Vacuum - 75mbar
Figure 6: Product moisture as a function of time at 50 and 75 mbar
Figure 7: Dimensionless moisture as a function of time at 50 and 75mbar.
0.0 1.0 2.0 3.0 4.0
0.00 0.10 0.20 0.30
Moisture content (d.b.)
Rat
e, R
dr
y
ing
(g / m
2 *s
)
Microwave-Vacuum - 50mbar
Microwave-Vacumm - 75mbar
0.0 1.0 2.0 3.0 4.0
0.0 0.2 0.4 0.6 0.8 1.0
(X-Xeq) / (X0-Xeq)
Rate, R
dr
yi
n
g
(g /
m
2 s)
Microwave-Vacuum - 50mbar
Microwave-Vacuum - 75mbar
Figure 8: Drying rate per unit area as a function of the product moisture at 50 and 75mbar.
Figure 9: Drying rate per unit area as a function of the dimensionless moisture at 50 and 75mbar.
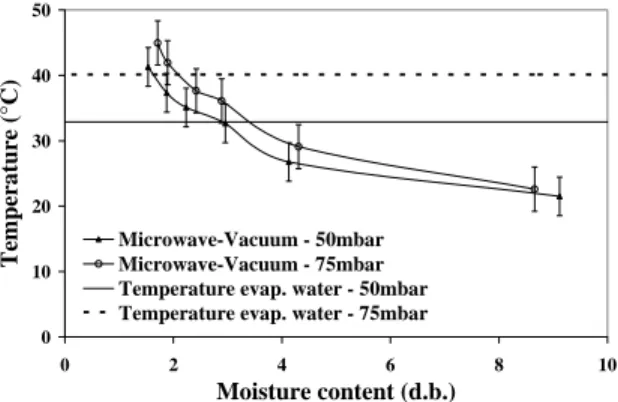
Temperature
Figure 10 shows the evolution of temperature as a function of product moisture content during the microwave assisted vacuum drying at pressures of 50 and 75mbar. The results were obtained using a thermocouple, taking the readings at six time intervals. At each temperature reading, a new experiment was started. The graph presents the average of all the tests, carried out in triplicate for every time interval, at the two working pressures.
Two boiling water temperatures are also shown in Figure 10, for the pressures of 50 and 75mbar, and were respectively 32.9 and 40.2°C. At a pressure of 75mbar the product temperature remained below the boiling water temperature up to the end of drying. In the case of the experiments carried out at 50mbar, the product temperature was higher than the boiling water temperature until almost 3% d.b. of product moisture content, that is, the other constituents of the granule started absorbing microwaves leading to an increase in product temperature. It should be pointed out that the temperature was not uniform inside the sample holder and that the maximum temperature values were registered for each time interval studied. Thus the drying procedures were carried out in a
regimen of water evaporation, with the product temperature below that of the boiling water.
Absorbed Power
Brazilian Journal of Chemical Engineering
The behavior of the curves shown in Figure 11 makes the higher power consumption of the sample at the higher absolute pressure (75 mbar) evident. Probably, the higher pressure differential (in the case of 50 mbar) caused increased mass diffusion, requiring less microwave energy for vaporization. On the other hand, the smaller pressure differential (in the case of 75 mbar), caused a higher absorption of microwave energy, responsible for keeping both drying rates similar for the two pressures studied.
Figure 12 indicates the ratio of the absorbed power to the available water in the product as a function of the real moisture values. According to the plot, it can be said that the absorbed power per unit of available water in the product was constant for the free water. When little water remains internally in the product, it is more strongly bound and the absorbed power per unit of available water in the product increases drastically, also being absorbed by the other constituents of the granule. Figure 13 presents the graph plotted with the dimensionless values for moisture.
Granule Visualization by SEM
Figure 14 shows the image of the moist granules obtained after granulation (25 - 28% d.b.). By making use of the electronic library coupled to the scanning electronic microscope, it was possible to identify the chemical elements present within a certain sample area. In both Figures (15 and 16) the identification was done inside the circled areas.
Due to the higher proportions of sulfur and chlorine found in the larger particles (circled areas in Figure 15), these particles are related to the HCT molecules. With respect to the smaller, rounded particles, it can be said they belonged to the excipients, considering the smaller proportion of these two chemical elements (Figure 16). Another observation that can be made is that the excipient molecules aggregated and glued around the active drug principle (Figure 17).
After the microwave assisted vacuum drying, the granules were analyzed by SEM in order to check for the presence of any structural changes. No apparent alterations were visualized, as can be observed in Figures 18 and 19.
0 10 20 30 40 50
0 2 4 6 8 10
Moisture content (d.b.)
Tem
p
erat
u
re (°C
)
Microwave-Vacuum - 50mbar Microwave-Vacuum - 75mbar Temperature evap. water - 50mbar Temperature evap. water - 75mbar
0 2 4 6 8 10
0.0 0.2 0.4 0.6 0.8 1.0
(X-Xeq) / (Xo-Xeq)
Ab
sorbed Pow
er (
W
)
Microwave-Vacuum - 50mbar Microwave-Vacuum - 75mbar
Figure 10: Temperature as a function of the product moisture at 50 and 75mbar.
Figure 11: Power absorbed as a function of the dimensionless moisture at 50 and 75mbar.
0 40 80 120 160
0.00 0.10 0.20 0.30
Moisture content (d.b.)
Ab
sorbed
Power (W) / g water
Microwave-Vacuum - 50mbar
Microwave-Vacuum - 75mbar
0 40 80 120 160
0.0 0.2 0.4 0.6 0.8 1.0
(X-Xeq) / (Xo-Xeq)
Ab
sorbed Powe
r (W)
/
g wate
r
Microwave-Vacuum - 50mbar
Microwave-Vacuum - 75mbar
Figure 12: Absorbed power / amount of available water in the product as a function of product
moisture content.
Figure 13: Absorbed power / amount of available water in the product as a function of the
Study of the Microwave Vacuum Drying Process for a Granulated Product 325
Figure 14: Moist granule (X= 25 – 28% d.b.).
Figure 15: Moist granule (X = 25 – 28% d.b.) and the ratio of chemical elements in the circled area - C =
72.14%; O = 26.17%; S = 1.11%; Cl = 0.58%.
Figure 16: Moist granule (25 – 28% d.b.) and the ratio of chemical elements in the circled area – C= 68.05%;
O = 12.90%; S = 13.69%; Cl = 5.36%.
Figure 17: Moist granule.
Figure 18: Granules after microwave assisted vacuum drying (X = 2% d.b.).
Brazilian Journal of Chemical Engineering
Figure 20: Image obtained in the interior of the tablet and the ratio of chemical elements in the lighter: C=57.43%; O=16.36%; S=16.36%; Cl=6.79; and darker regions: C=72.48; O= 26.10%; S = 0.69; Cl = 0.38%.
Figure 21: Image obtained in the interior of the tablet.
Visualization and Behavior under Compression
After microwave assisted vacuum drying, the granules were submitted to compression. Before the compression stage, two lubricants, talcum and magnesium stearate, were added to the granules, followed by manual homogenization inside a closed recipient, since the amount of product was too small to use a mixer.
The tablets, obtained using a compression force of 25kN and speed of 15mm/min, presented the following behavior:
tablets obtained without addition of a lubricant
broke immediately after compression;
tablets obtained with the addition of a lubricant
did not show fissures after compression, but broke the day after;
In the face of these results, the compression speed was changed, and thereafter a speed of 5 mm/min was used. In order to verify if the reason for fissuring of the tablets was water absorption from the environment, two tablets prepared with lubricants were conditioned in a desiccator with the relative humidity controlled by means of a probe. The relative humidity of the system was about 20 %. Another four tablets were conditioned at the environmental relative humidity, two prepared with lubricants and two without.
None of the six tablets showed fissures, even after several days. Thus it was concluded that the previous speed of 15mm/min was not suitable, and that the granules behaved well faced with the compression process. The SEM analyses were carried out to visualize the distribution of the active drug principle and the excipients (Figures 20 and 21), where the clearer regions show the
active drug principle and the darker regions represent the excipients.
Comparison Between the Drying Processes
Experiments were carried out on a laboratory scale in the Department of Food Engineering/FEA of the State University of Campinas - Brazil, using tray driers, one working with hot air alone, and the other combining microwaves with hot air (adapted domestic ovens) (Berteli and Marsaioli, 2004), also working with the granule consisting of HCT, mannitol and corn starch, with the same composition but with a greater initial moisture content. A comparison was made between the hot air processes with and without microwaves in the tray dryer and the microwave assisted vacuum process. The ratios of the initial amounts of material to the contact area of the sample holder for the three types of drying process were 4522.3
g/m2, 4709.6 g/m2 and 4682.3 g/m2, respectively,
that is, values of the same magnitude. The conditions of the hot air on entering were a temperature of 70°C+1 and flow rate of 2.5
m3/min, for the two tray dryer processes. The
power available for the product in the combined microwave and hot air process was 145.7W.
Study of the Microwave Vacuum Drying Process for a Granulated Product 327
0.0 0.2 0.4 0.6 0.8 1.0
0 2000 4000 6000 8000 10000 12000 14000 16000
time (s)
(X-X
eq
) / (X
o
-X
eq
)
Microwave-Hot Air - 145,7W Hot Air
Microwave-Vacuum - 75mbar
0 1 2 3 4 5
0.0 0.2 0.4 0.6 0.8 1.0
(X-Xeq) / (Xo-Xeq)
Rate
dry
in
g
(g w
a
ter /
m
2 s)
Microwave-Hot Air - 145,7W
Hot Air
Microwave-Vacuum - 75mbar
Figure 22: Dimensionless moisture as a function of time for the hot air processes with and without microwaves using the tray dryer and the microwave assisted vacuum process.
Figure 23: Drying rate per unit area as a function of the dimensionless moisture for the hot air processes with and without microwaves in the tray dryer and the microwave assisted vacuum process.
Considering the same moisture range, from 25 to 3% d.b., the following can be observed:
for the microwave assisted vacuum process: time
required = 9 minutes;
for the combined microwave and hot air process:
time required = 30 minutes;
for the convective hot air process alone: time
required = 205 minutes.
If the last two processes are compared with the microwave assisted vacuum process, it can be observed that the latter process showed an average 3-fold decrease in relation to the combined microwave and hot air processes and a 22-fold decrease in relation to the convective hot air process alone.
Concerning the available power levels, the combined microwave and hot air process worked with
a value for Pavail. = 145.7 W, for an initial power density
of 494.9W/kg; for the microwave assisted vacuum process the initial power density was 4929.6 W/kg for 50 mbar and 6690.1 W/kg for 75 mbar. It should be stressed that the wave configuration in a waveguide (monomode) is different from the configuration inside a cavity (multimode). Thus the real power absorbed by the product was not easy to evaluate, which is why it was not presented in this paper.
The big difference between the values of the drying rates was probably due to the equally big difference between the power densities of the two processes with the application of microwave energy. Microwaves can generate an additional rate due to the gaseous pressures inside the product, besides capillary and diffusional migration (Péré, 1999). In addition, the vacuum also helped mass transfer. As proof of this, an experiment was carried out in the microwave assisted vacuum dryer, but with only the vacuum connected. The corresponding time for the
vacuum process without the application of microwaves, was 2 hours, in contrast to 4 hours with the convective process.
Another issue to consider is the temperature. The product treated by hot air combined with microwaves at an initial power density of 484.9W/kg, showed a maximum temperature of 65°C (Berteli and Marsaioli, 2004) and the product submitted to the microwave assisted vacuum process at an initial power density of 6,690.1W/kg showed a maximum temperature of 45°C. The application of vacuum permitted working with higher power densities, although the product temperatures were lower.
CONCLUSIONS
Based on the results obtained it could be concluded that:
For the microwave assisted vacuum process, the
drying kinetics were similar for the two absolute pressures. The power absorbed at 75 mbar was slightly higher than that absorbed at 50 mbar. The drying process to reach 3 % d.b. moisture was accomplished in the regimen of water evaporation, because the product temperatures were smaller than the boiling water temperatures at the respective pressures.
The vacuum assisted microwave drying showed
good results as compared to the combined microwave and hot air drying process. Shorter drying times and lower product temperatures were observed.
With respect to the granules, in agreement with
Brazilian Journal of Chemical Engineering
equilibrium with the lower air humidity, showing a tendency to lose water to the environment as the main characteristic.
The amount of water in the material influenced
the power absorbed. For moistures close to 5% d.b., the power absorbed per unit of water mass in the product was constant, and then increased due to absorption by the granule constituents.
NOMENCLATURE
aw water activity
A contact area of the sample
support with the product
m2
dX/dt variation in water content at
instant t
(kg water/kg dry matter)/s
Msol, mass of product solids (g
dry solids)
HCT hydrochlorthiazide
k diffusivity constant s-1
Pabs power absorbed W
Pavail available power W
Pinc waveguide incident power W
Rdrying drying rate g/m2s
X product moisture g water/g dry
matter
Xd.b. product moisture content,
dry weight basis
g water/g dry matter
Xw.b. product moisture content,
wet weight basis
g water/g water + g dry
matter
Xeq product equilibrium
moisture content
g water/g dry matter
X0 initial moisture content g water/g dry
matter
ε’ relative permittivity dimensionless
ε” loss factor dimensionless
ACKNOWLEDGEMENTS
The authors are grateful to CAPES – Coordenação de Aperfeiçoamento de Pessoal de Nível Superior; CNPq - Conselho Nacional de Pesquisa; FURP - Fundação Para o Remédio Popular and to the École des Mines d’Albi Carmaux.
REFERENCES
Arlabosse, A., Rodier, E., Ferrase, J. H., Lecomte, D., Comparison between static and dynamic methods for sorption measurements, Drying
Technology, 21, N° 3, p. 479 (2003).
Berteli, M. N., Marsaioli, A. Jr., Rodier, E., Study of a microwave assisted vacuum drying process applied to the granulated pharmaceutical drug hydrochlorthiazide (HCT), Journal of Microwave Power & Electromagnetic Energy, 40, N° 4, p. 241 (2007).
Bika, D., Tardos, G. I., Panmai, S., Farber, L, Michaels, J., Strenght and morphology of solid bridges in dry granules of pharmaceutical powders, Powder Technology, 150, p. 104 (2005). Berteli, M. N., Marsaioli, A. Jr., Comparative drying
behavior of a granulated product when submitted to hot air, fluidized bed and microwave processes, ICEF – International Conference on Engineering and Food, Montpellier, France, CR-ROM (2004). Calligaris, D., personal communication, Furp –
Fundação para o Remédio Popular, Guarulhos, São Paulo (2001).
Cui, Z. W., Sun, L. J., Chen, W., Sun, D. W., Preparation of dry honey by microwave-vacuum drying, Journal of Food Engineering, 84, p. 582 (2008).
Cui, Z. W., Xu, S. Y., Sun, D. W., Microwave-vacuum drying kinetics of carrots slices, Journal of Food Engineering, 65, p. 157 (2004).
Drouzas, E. T., Saravacos, G. D., Microwave /
vacuum drying of model fruit gels, Journal of
Food Engineering, 39, p. 117 (1999).
Hegedus, Á., Pintye-Hóbi, K., Comparison of the effects of different drying techniques on properties of granules and tablets made on a production scale, International Journal of Pharmaceutics, 330, p. 99 (2006).
Iglesias, H. A., Chirife, J. Handbook of food isotherms: water sorption parameters for food components, Academic Press (1982).
Kelen, A., Ress, S., Nagy, T., Pallai, E., Pintye-Hódi, K. Mapping of temperature distribution in pharmaceutical microwave vacuum drying, Powder Technology, 162, p. 133 (2006).
Kelen, A., Pallai-Varsanyi, E., Ress, S., Nagy, T., Pintye-Hodi, K. Practical method for choosing diluent that ensures the best temperature uniformity in the case of pharmaceutical microwave vacuum drying of a heat sensitive product, European Journal of Pharmaceutics and Biopharmaceutics, 62, p. 101 (2006).
Study of the Microwave Vacuum Drying Process for a Granulated Product 329
Lê Hir, A., Noções de farmácia galênica. 6. ed. Organização Andrei Editora Ltda, São Paulo (1997).
Li, Y., Xu, S. Y., Sun, D. W., Preparation of garlic powder with high allicin content by using combined microwave-vacuum drying as well as microencapsulation, Journal of Food Engineering, 83, p. 76 (2007).
Péré, C., Rodier, E., Microwave vacuum drying of porous media: experimental study and qualitative considerations of internal transfers, Chemical Engineering and Processing, 41, 427 (2002). Péré, C., Étude du séchage sous vide et sous
micro-ondes de billes de verre et granulés
pharmaceutiques. Thèse de Doctorat, École de Mines de Paris (1999).
Rantanen, J., Lehtola, S., Ramet, P.; Mannermaa, J. P., Yliruusi, J., On-line monitoring of moisture content in an instrumented fluidized bed granulator with a multi channel NIR moisture
sensor, Powder Technology, 99, N° 2, p. 163
(1998).
Schiffmann, R. F., Microwave and dielectric drying. IN: Mujundar, A. S. Handbook of industrial
drying.New YorK: Marcel Dekker (1987).