Relationship between hand grip strength
and nutritional assessment methods
used of hospitalized patients
Relação entre a força do aperto da mão
e métodos de avaliação nutricional
em pacientes hospitalizados
1Monique Ferreira GARCIA2
Marion Schneider MEIRELES2
Letícia Maria FÜHR2
Amanda Brognoli DONINI3
Elisabeth WAZLAWIK2
A B S T R A C T
Objective
This study verified the association between hand grip strength and body mass index, subjective global assessment and nutritional risk screening 2002.
Methods
This cross-sectional study calculated the body mass index, measured hand grip strength and administered the subjective global assessment and nutritional risk screening 2002 to 118 patients hospitalized at the University Hospital of the Universidade Federal de Santa Catarina, Florianópolis, Brazil. Hand grip strength was compared with the reference values for the Brazilian population according to gender and age. The statistical analyses included the Student’s t-test or Mann-Whitney test and multiple linear regression. The results were considered significant when p<0.05.
Results
The prevalences of nutritional risk or malnutrition according to body mass index, global subjective assessment, nutritional risk screening 2002 and hand grip strength were 3.5%, 50.9%, 33.9% and 35.6%, respectively.
1
Article developed as part of the dissertation data MS MEIRELES, called “Comparação entre métodos de rastreamento nutricional e de composição corporal com a avaliação subjetiva global”. Universidade Federal de Santa Catarina; 2011. Support: Programa de Pós-Graduação em Nutrição da Universidade Federal de Santa Catarina, Programa de Apoio ao Plano de Reestruturação e Expansão das Universidades Federais e Coordenação de Aperfeiçoamento de Pessoal de Nível Superior.
2
Universidade Federal de Santa Catarina, Centro de Ciências da Saúde, Programa de Pós-Graduação em Nutrição. Campus Universitário, Trindade, 88040-900, Florianópolis, SC, Brasil. Correspondence to/Correspondência para: E WAZLAWIK. E-mails: <[email protected]>; <[email protected]>.
3
Malnourished individuals according to body mass index had, on average, 11.0kg less hand grip strength than the nourished individuals (p=0.008). There was no association between hand grip strength and the subjective global assessment (malnourished individuals had -2.8kg; p=0.078) and nutritional risk screening 2002 (malnourished individuals had -1.5kg; p=0.352).
Conclusion
Hand grip strength was associated with body mass index but not with the subjective global assessment or nutritional risk screening 2002.
Indexing terms: Nutritional assessment. Nutritional status. Hand strength. Body mass index. Inpatients.
R E S U M O
Objetivo
Verificar a associação da força do aperto da mão com o índice de massa corporal, a avaliação subjetiva global e o rastreamento de risco nutricional 2002.
Métodos
Estudo transversal com 118 pacientes internados no Hospital Universitário da Universidade Federal de Santa Catarina, Florianópolis, Brasil. Foi calculado o índice de massa corporal e foram aplicados a avaliação subjetiva global, o rastreamento de risco nutricional 2002 e a força do aperto da mão. Esta última foi comparada aos valores de referência da população brasileira, segundo sexo e idade. Para análise estatística, foi utilizado o teste t Student ou Mann-Whitney e regressão linear múltipla, considerando uma significância estatística de p<0,05.
Resultados
A prevalência de risco nutricional ou desnutrição pelo índice de massa corporal, avaliação subjetiva global, rastreamento de risco nutricional 2002 e força do aperto da mão foi de 3,5%, 50,9%, 33,9% e 35,6%, respectivamente. Os indivíduos, identificados como desnutridos pelo índice de massa corporal, tiveram, em média, 11,0kg a menos na força do aperto da mão do que os nutridos (p=0,008). Não houve associação da força do aperto da mão com a avaliação subjetiva global (desnutridos tiveram -2,8kg; p=0,078) e com o rastreamento de risco nutricional 2002 (desnutridos tiveram -1,5kg; p=0,352).
Conclusão
A força do aperto da mão foi associada com o índice de massa corporal, mas não com avaliação subjetiva global ou com o rastreamento de risco nutricional 2002.
Termos de indexação: Avaliação nutricional. Estado nutricional. Força da mão. Índice de massa corporal. Pacientes internados.
I N T R O D U C T I O N
An ideal method for assessing the nutritional status of patients should include dietary intake, nutritional requirements, functional status
and body composition1. However, in the absence
of a gold standard, scientists tried to identify new methods capable of accurately diagnosing
malnutrition2-4. Many tools have been used; however,
their validity is still controversial5.
In clinical practice and in the hospital
setting, Body Mass Index (BMI)6, Subjective Global
Assessment (SGA)7 and Nutritional Risk Screening
2002 (NRS 2002)8 are frequently used while Hand
Grip Strength (HGS) is often reported as an
indicator of functional capacity9.
Body Mass Index indirectly assesses nutritional status and depends on weight and height. It is a simple index and an easy-to-use method, commonly used for classifying
malnutrition, overweight and obesity6.
considered a simple, inexpensive and easy-to-use technique, and provides important nutritional
information2.
The Nutritional Risk Screening 2002 is used for determining the risk of malnutrition by assessing the severity of the disease, BMI, percentage of weight loss and food intake. Hence, malnutrition and/or severe disease may indicate
the need of nutritional support8.
Hand Grip Strength is determined by dynamometry. It is a noninvasive, simple and quick method that can be used in clinical and
epidemiological studies10,11. It may be useful for
the assessment of nutritional status11-13, since
malnourished patients present lean mass
depletion and low muscle strength10,11.
Given the importance of scientific evidence proving the efficiency of HGS for assessing nutritional status, the objective of this study was to verify its association with BMI, SGA and NRS 2002 in hospitalized patients.
M E T H O D S
This is a cross-sectional study of patients
aged u19 years of the University Hospital of the
Universidade Federal de Santa Catarina (HU/UFSC) hospitalized between July 2010 and July 2011. Patients unable to understand instructions and communicate, pregnant or breastfeeding women and those with amputated or atrophied limbs were excluded.
The project was approved by the UFSC Human Research Ethics Committee under protocol n° 333/08, and all participants signed an informed consent form before the interview and assessment of their nutritional status.
The patients’ clinical data were obtained from their hospital records. All nutritional status assessments were done on the same occasion. The researchers were previously trained for ensuring the reliability of the nutritional status assessment and data collection.
Hand grip strength
Hand grip strength was measured using a
hydraulic hand dynamometer Saehan® model SH
5001 (Saehan Corporation - Yangdeok-Dong,
Masan, Korea) with a capacity of 90kg.
The evaluation was done with the patient seated, with hips and knees at 90° of flexion, adducted shoulder close to the trunk, flexed elbow at 90° with the forearm in neutral position (between pronation and supination) and wrist between 0° and 30° of extension and 0° and 15°
of ulnar deviation12.
A pretest was done allowing the participant to become familiar with the apparatus. The researcher verbally instructed the participant to exert maximum palmar prehension three times
and the highest value was used12. HGS was
evaluated on the arm side without vascular access. The results were compared with the reference
values for the Brazilian population11 and the
patients were classified as malnourished when
their HGS was below the tenth percentile11.
Body mass index
Weight (kg) and height (m) were determined as recommended by the World Health
Organization14. BMI was calculated by dividing the
weight by the square of the height. Patients were
classified as malnourished6 when BMI <18.5kg/m²,
normal weight when 18.5kg/m²eBMIe24.9kg/m²,
overweight when 25.0kg/m²eBMIe29.9kg/m² and
obese when BMIu30kg/m². For the statistical
analysis, the patients were classified as malnourished (BMI<18.5kg/m²) or nourished
(BMIu18.5kg/m²).
Weight and height were measured using an electronic scale with stadiometer (Welmy,
W300, Santa Bárbara D’Oeste, São Paulo, Brazil).
Subjective global assessment
The Subjective Global Assessment was
done as recommended by Detsky et al.7,
intake, gastrointestinal symptoms, functional capacity, metabolic stress and physical examination. The patients were classified as A (nourished); B (moderately or possibly malnourished); and C (severely malnourished). For the statistical analysis, the categories B and C were grouped.
Nutritional Risk Screening 2002
The Nutritional Risk Screening 2002 was
performed as recommended by Kondrup et al.8
Nutritional risk was determined by two components: impaired nutritional status (BMI, weight loss, food intake) and disease severity. The following scores were given for nutritional status and disease severity: 0 - absent; 1 - mild; 2 - moderate; and 3 - severe. Patients with a total score of 3 or more were considered at nutritional risk, and
patients aged u70 years received an extra point
in the total score8.
Statistical analysis
The results were expressed as relative and absolute frequencies, mean and 95% confidence interval.
The Chi-square or Fisher’s exact test was used for analyzing the association between the
categorical variables and the Student’s t-test or
Mann-Whitney test for verifying the differences between the means of the groups, depending on the homogeneity of the variances, since the outcome variable was symmetrical. Multiple linear regression adjusted for age and gender was used for verifying the association between HGS and
the other nutritional indicators. P-values <0.05
were considered statistically significant. All analyses were done by the software Stata, version 11.0 for Windows (Stata Corporation, College Station, TX, USA).
R E S U L T S
The sample consisted of 118 patients with a mean age of 50.4±15.0 years (19 to 85 years). Most were females (72.0%) aged <60 years (71.7%). The most common diagnoses were cancer (11.9%), pulmonary diseases (11.6%), heart disease (10.2%) and liver disease (7.6%). Two-thirds (66.1%) of the sample had some comorbidity (men=34.4% and women=76.6%;
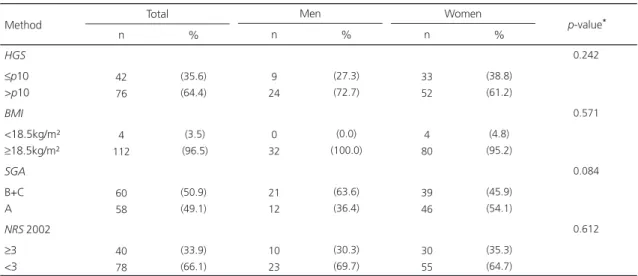
Table 1. Prevalence of malnutrition according to Hand Grip Strength (HGS), Body Mass Index (BMI), Subjective Global Assessment (SGA) and Nutritional Risk Screening 2002 (NRS 2002) by gender. Florianópolis (SC), Brazil, 2011.
HGS
ep10 >p10
BMI <18.5kg/m² u18.5kg/m² SGA B+C A
NRS 2002
u3 <3 Method 42 76 4 112 60 58 40 78 (35.6) (64.4) (3.5) (96.5) (50.9) (49.1) (33.9) (66.1) 9 24 0 32 21 12 10 23 (27.3) (72.7) (0.0) (100.0) (63.6) (36.4) (30.3) (69.7) n % Total n % Men 33 52 4 80 39 46 30 55 (38.8) (61.2) (4.8) (95.2) (45.9) (54.1) (35.3) (64.7) n % Women 0.242 0.571 0.084 0.612 p-value*
*Chi-square or Fisher’s exact test for the association between genders.
p<0.001), and of these, 20.3% had Diabetes Mellitus (DM) and 39.8% had High Blood Pressure (HBP). HBP was significantly more common in women.
Table 1 shows the classification of the nutritional status of the patients according to gender. According to HGS, BMI, SGA and NRS 2002, 35.6%, 3.5%, 50.9% and 33.9%, respectively were at nutritional risk or malnourished. The prevalences of malnutrition of men and women did not differ.
The mean HGS of the sample was 25.0±11.6kg, and that of the women (20.2±6.6
kg) was significantly lower than that of the men
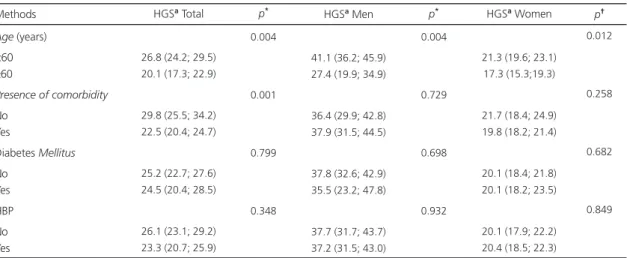
(37.3±12.6kg; p<0.001). HGS was significantly
lower in patients aged u60 years, in those with
some comorbidity (Table 2) and in malnourished patients according to BMI (Table 3).
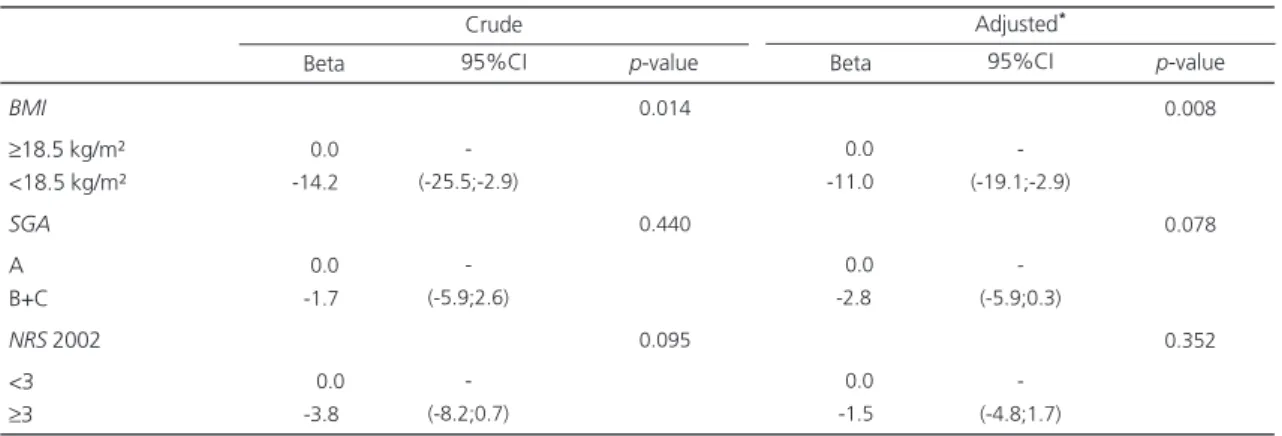
After adjusting for age and gender, the mean HGS of malnourished patients according to BMI was 11kg lower than that of nourished patients. Among those malnourished according to the SGA, the mean HGS was 2.8kg lower than that of the nourished. Among those at nutritional risk according to the NRS 2002, the mean HGS was 1.5kg lower than that of the nourished.
Table 2. Relationship between Hand Grip Strength (HGS) and age, presence of comorbidities, diabetes mellitus and High Blood Pressure (HBP) by gender. Florianópolis (SC), Brazil, 2011.
Age (years) <60
u60
Presence of comorbidity
No Yes
Diabetes Mellitus
No Yes HBP No Yes Methods
26.8 (24.2; 29.5) 20.1 (17.3; 22.9)
29.8 (25.5; 34.2) 22.5 (20.4; 24.7)
25.2 (22.7; 27.6) 24.5 (20.4; 28.5)
26.1 (23.1; 29.2) 23.3 (20.7; 25.9)
0.004
0.001
0.799
0.348
41.1 (36.2; 45.9) 27.4 (19.9; 34.9)
36.4 (29.9; 42.8) 37.9 (31.5; 44.5)
37.8 (32.6; 42.9) 35.5 (23.2; 47.8)
37.7 (31.7; 43.7) 37.2 (31.5; 43.0)
0.004
0.729
0.698
0.932
21.3 (19.6; 23.1) 17.3 (15.3;19.3)
21.7 (18.4; 24.9) 19.8 (18.2; 21.4)
20.1 (18.4; 21.8) 20.1 (18.2; 23.5)
20.1 (17.9; 22.2) 20.4 (18.5; 22.3)
0.012
0.258
0.682
0.849
HGSa Total p* HGSa Men p* HGSa Women p†
aMean and 95% confidence interval. *Student’s t-test or Mann-Whitney test.
Table 3. Mean Hand Grip Strength (HGS) according to Body Mass Index (BMI), Subjective Global Assessment (SGA) and Nutritional Risk Screening 2002 (NRS 2002) by gender. Florianópolis (SC), Brazil, 2011.
BMI
<18.5 kg/m²
u18.5 kg/m²
SGA
B+C A
NRS 2002
u3 <3 Methods
11.3 (7.7; 14.8) 25.4 (23.3; 27.5)
24.2 (21.3; 27.1) 25.9 (22.7; 29.0)
22.5 (19.2; 25.7) 26.3 (23.6; 29.0)
0,003
0.440
0.095
-34.4 (29.6; 39.1) 42.6 (33.2; 51.9)
34.0 (26.3; 41.7) 38.8 (33.1; 44.6)
-0.070
0.322
11.3 (7.7; 14.8) 20.8 (19.3;22.2)
18.7 (16.5; 20.9) 21.5 (19.7; 23.3)
18.7 (16.1; 21.4) 21.1 (19.4; 22.7)
0.004
0.054
0.117
HGSa Total p* HGSa Men p* HGSa Women p*
However, the difference between the mean HGS of nourished and malnourished patients according to the SGA and NRS 2002 was not significant, even after adjustment (Table 4).
D I S C U S S I O N
The relationship between HGS and BMI, SGA and NRS 2002 was investigated to verify its use for the diagnosis of malnutrition. Malnourished patients or those at risk of malnutrition should be identified at hospital admission to receive nutritional support, reduce their nutritional deficiencies and contribute to the improvement of their clinical prognosis3,15,16.
Body cell mass may decrease in malnourished patients, leading to functional loss. Therefore, it is important to use a technique capable of
assessing functional capacity17 and detecting
malnutrition early18.
Hand grip strength is a method that assesses muscle strength and functional
capacity11,19. It has been described as an
appropriate tool for the nutritional screening and
diagnosis of healthy populations11,12 and
hospitalized individuals17.
The prevalence of malnutrition in the present study varied from 3.5% to 50.9%, confirming that the assessment method may
affect nutritional diagnosis20. The low prevalence
of malnutrition according to BMI corroborated
other studies21,22. On the other hand, the
prevalence of malnutrition according to the SGA (50.9%) was higher than that reported by other
studies (22.0%, 28.0%, 18.7% and 29.6%)21,23-25.
Likewise, the classification of nutritional risk according to the NRS 2002 (33.9%) was also higher than that reported by other studies (20.0%
and 27.5%)21,25.
The different prevalences of malnutrition in the present study may be attributed to the specificities of each method, which can assess distinct characteristics. BMI considers only the
relationship between weight and height6.
Meanwhile, the SGA and NRS 2002 investigate aspects associated with weight loss, food intake and disease-related stress. Furthermore, the SGA also takes into account gastrointestinal symptoms, functional capacity and physical examination, and
the NRS 2002 considers BMI7,8. Finally, HGS
estimates muscle strength by determining the prehension force that an individual exerts on the
dynamometer11.
The higher prevalence of malnutrition according to the SGA compared with other studies of patients with similar ages may stem from the smaller impact of the latter’s diagnoses on nutritional status.
Table 4. Multiple linear regression of hand grip strength and nutritional indicators. Florianópolis (SC), Brazil, 2011.
BMI
u18.5 kg/m² <18.5 kg/m²
SGA
A B+C
NRS 2002 <3
u3
-00.0 -14.2
0-0.0
0-1.7
-0-00.0
0-3.8
-(-25.5;-2.9)
-(-5.9;2.6)
-(-8.2;0.7)
0.014
0.440
0.095
-00.0 -11.0
0-0.0
--2.8
-00.0
0-1.5
-(-19.1;-2.9)
-(-5.9;0.3)
-(-4.8;1.7)
0.008
0.078
0.352
Beta 95%CI p-value
*Adjusted for age and gender.
BMI: Body Mass Index; SGA: Subjective Global Assessment; NRS 2002: Nutritional Risk Screening 2002.
Crude
Beta 95%CI p-value
Cut-off points for the determination of malnutrition according to HGS are scarce. The present study used the reference values for the
Brazilian population proposed by Schlüssel et al.11.
The prevalence of malnutrition according to HGS was low (38.1%) when compared with other studies that found a prevalence of 73.3% in
patients with Crohn’s disease24 and 63% in
patients with cyrrhosis23. One of the justifications
is the different cut-off points used and, possibly, disease severity.
The presence of malnutrition did not differ between the genders. However, in other studies, men were more often malnourished according to
HGS24 and SGA17,26. In the present study, none of
the men was malnourished according to BMI.
The prevalence of malnutrition according to HGS was greater than that according to BMI.
A similar result was obtained by Gottschall et al.10
for patients with cirrhosis; they found that HGS was more sensitive for the detection of malnutrition than BMI. This probably occurred because BMI does not distinguish between lean
and fat mass6. Hence, an individual may often
seem to have an appropriate nutritional status
(BMI>18.5kg/m2) but have low lean body mass27,
which can be directly verified by HGS11. Moreover,
some diseases, such as liver cirrhosis and pulmonary diseases, may cause hydration
changes, and consequently affect BMI10,14,22.
The hand grip strength of men was significantly higher than that of women, as was those of patients aged <60 years compared with older patients, which is in agreement with
Brazilian studies of healthy11 and hospitalized
individuals28,29.
Álvares-da-Silva & Silveira23 showed that
HGS was capable of predicting clinical complications, which may explain the lower HGS of individuals with comorbidities in the present study. In the malnourished and nourished patients according to BMI, SGA and NRS 2002, regardless of confounding factors (age and gender), only BMI was associated with HGS, that is, the mean HGS of the malnourished individuals according to BMI
were significantly lower than those of the nourished individuals, which is in agreement with
Norman et al.9 and Schlüssel et al.11. Meanwhile,
a study done with hemodialysis patients found that the mean BMI of patients above and within
the tenth percentile for HGS did not differ4.
On the other hand, many patients with
BMI u18.5kg/m² had low HGS, indicating that
normal BMI values do not reflect adequate muscle
mass27. There were only four malnourished
women according to BMI.
The absence of an association between
HGS and SGA is not confirmed by other studies9,17,23
which showed that malnourished patients according to the SGA had lower HGS. Regarding
the NRS 2002, Matos et al.30 found that
malnourished patients also presented lower HGS.
Hence, this study contradicts those that showed that HGS was capable of diagnosing
nutritional risk or malnutrition17,23,24,28. A probable
explanation is that HGS values were appropriate for most patients, contrary to the findings of other studies23,24.
The limitation of the present study may have been the variety of diseases of the study sample. Additional studies are needed to identify the efficiency of the method as a nutritional parameter, comparing HGS with other nutritional assessment methods in hospitalized patients.
C O N C L U S I O N
Hand grip strength was associated with BMI but not with the SGA or NRS 2002. Hence, the present results suggest that HGS is not a good indicator of nutritional risk and malnutrition in hospitalized patients.
A C K N O W L E D G M E N T S
C O N T R I B U T O R S
MFG helped to analyze and interpret the data. MSM helped to conceive and design the study, and collect and review data. LMF helped to analyze and interpret the data. ABD helped to collect the data. EW helped to conceived and design the study and review the data.
R E F E R E N C E S
1. Davies M. Nutritional screening and assessment in cancer-associated malnutrition. Eur J Oncol Nurs. 2005; 9(Suppl 2):S64-S73. doi:10.1016/j.ejon.2 005.09.005.
2. Barbosa-Silva MCG, Barros AJD. Indications and limitations of the use of subjective global assessment in clinical practice: an update. Curr Opin Clin Nutr Metab Care. 2006; 9(3):263-9. doi: 10.1097/01.mco.0000222109.53665.ed. 3. Beghetto MG, Manna B, Candal A, Mello ED,
Polanczyk CA. Triagem nutricional em adultos hospitalizados. Rev Nutr. 2008; 21(5):589-601. doi: 10.1590/S1415-52732008000500011.
4. Leal VO, Stockler-Pinto MB, Farage NE, Aranha LN, Fouque D, Anjos L, et al. Handgrip strength and its dialysis determinants in hemodialysis patients. Nutrition. 2011; 27(11-12):1125-9. doi:10.1016/ j.nut.2010.12.012.
5. Fürstenberg A, Davenport A. Comparison of multifrequency bioelectrical impedance analysis and dual-energy x-ray absorptiometry assessments in outpatient hemodialysis patients. Am J Kidney Dis. 2010; 57(1):123-9. doi:10.1053/j.ajkd.2010.0 5.022.
6. World Health Organization. Global database on body mass index. Geneva: WHO; 2008 [cited 2012 Jan 29]. Available from: <http://apps.who.int/bmi/ index.jsp>.
7. Detsky AS, McLaughlin JR, Baker JP, Johnston N, Whittaker S, Mendelson RA, et al. What is subjective global assessment of nutritional status? J Parenter Enteral Nutr. 1987; 11:8-13. doi: 10.11 77/014860718701100108.
8. Kondrup J, Alisson SP, Elia M, Vellas B, Plauth M. Educational and clinical practice committee, european society of parenteral and enteral nutrition (ESPEN). ESPEN guidelines for nutrition screening 2002. Clin Nutr. 2003; 22(4):415-21. doi:10.1016/S0 261-5614(03)00098-0.
9. Norman K, Schütz T, Kemps M, Lübkle JH, Lochs H, Pirlich M. The subjective global assessment
reliably identifies malnutrition-related muscle disfunction. Clin Nutr. 2005; 24(1):143-50. doi: 10.1016/j.clnu.2004.08.007.
10. Gottschall CBA, Álvares-da-Silva MR, Camargo ACR, Burtett RM, Silveira TR. Avaliação nutricional de pacientes com cirrose pelo vírus da hepatite C: a aplicação da calorimetria indireta. Arq Gastroenterol. 2004; 41(4):220-4. doi:10.1590/ S0004-28032004000400004.
11. Schlüssel MM, Anjos LA, Vasconcellos MT, Kac G. Reference values of handgrip dynamometry of healthy adults: a population-based study. Clin Nutr. 2008; 27(4):601-7. doi: 10.1016/j.clnu.2008.04.0 04.
12. Schlüssel MM, Anjos LA, Kac G. A dinamometria manual e seu uso na avaliação nutricional. Rev Nutr. 2008; 21(2):223-35. doi: 10.1590/S1415-5273 2008000200009.
13. Vilaça KHC, Ferriolli E, Lima NKC, Paula FJA, Marchini JS, Morigitu JC. Força muscular e densi-dade mineral óssea em idosos eutróficos e desnu-tridos. Rev Nutr. 2011; 24(6):845-52. doi: 10.1590/ S1415-52732011000600005.
14. World Health Organization. Physical status: the use and interpretation of anthropometry. Geneva: WHO; 1995.
15. Cabral PC, Burgos MGPA, Medeiros AQ, Tenório AKT, Feitoza CCF. Avaliação do estado nutricional de pacientes internados em um hospital univer-sitário. Rev Nutr. 1998; 11(2):125-32. doi: 10.1590/S 1415-52731998000200003.
16. Sena FG, Taddeo EF, Andrade Neto ER, Ferreira MSR, Rolim EG. Estado nutricional de pacientes internados em enfermaria de gastroenterologia. Rev Nutr. 1999; 12(3):233-9. doi: 10.1590/S1415-52 731999000300004.
17. Pham NV, Cox-Reijven PL, Wodzig WK, Greve JW, Soetes PB. SGA and measures for muscle mass and strength in surgical Vietnamese patients. Nutrition. 2007; 23(4):283-91. doi: 10.1016/j.nut.2006.12.0 12.
18. Wiroth JB, Filippi J, Schneider SM, Al-Jaouni R, Horvais N, Gavarry O, et al. Muscle performance in patients with Crohn’s disease in clinical remission. Inflamm Bowel Dis. 2005; 11(3):296-303. doi: 10.1 097/01.MIB.0000160810.76729.9c.
19. Leal VO, Mafra D, Fouque D, Anjos LA. Use of handgrip strength in the assessment of the muscle function of chronic kidney disease patients on dialysis: a systematic review. Nephrol Dial Transplant. 2010; 26(4):1354-60. doi: 10.1093/ndt/gfq487. 20. Karaoz S, Aydin N. Nutritional assessment of
21. Cardinal TR, Wazlawik E, Bastos JL, Nakazora LM, Scheunemann L. Standardized phase angle indicates nutritional status in hospitalized preoperative patients. Nutr Res. 2010; 30(9):594-600. doi: 10.10 16/j.nutres.2010.08.009.
22. Beghetto MG, Koglin G, Mello ED. Influence of the assessment method on the prevalence of hospital malnutrition: a comparison between two periods. Nutr Hosp. 2010; 25(5):774-80. doi: 10.3 305/nh.2010.25.5.4511.
23. Álvares-da-Silva MR, Silveira TR. Comparison between handgrip strength, subjective global assessment, and prognostic nutritional index in assessing malnutrition and predicting clinical outcome in cirrhotic outpatients. Nutrition. 2005; 21(2):113-7. doi: 10.1016/j.nut.2004.02.002. 24. Bin CM, Flores C, Álvares-da-Silva MR, Francesconi
CF. Comparison between handgrip strength, subjective global assessment, anthropometry, and biochemical markers in assessing nutritional status of patients with Crohn’s disease in clinical remission. Dig Dis Sci. 2010; 55(1):137-44. doi: 10.1007/s106 20-008-0692-1.
25. Scheunemann L, Wazlawik E, Bastos JL, Cardinal TR, Nakazora LM. Agreement and association between the phase angle and parameters of nutritional status assessment in surgical patients.
Nutr Hosp. 2011; 26(3):480-7. doi: 10.3305/nh.2 011.26.3.4816.
26. Vidal A, Iglesias MAJ, Pertega S, Ayúcar A, Vidal O. Prevalence of malnutrition in medical and surgical wards of a university hospital. Nutr Hosp. 2008; 23(3):263-7.
27. Anjos LA. Índice de massa corporal (massa corporal.estatura-2) como indicador do estado nutricional de adultos: revisão da literatura. Rev Saúde Pública. 1992; 26(6):431-6.
28. Pieterse S, Manandhar M, Ismail S. The association between nutritional status and handgrip strength in older Rwandan refugees. Eur J Clin Nutr. 2002; 56(10):933-9. doi:10.1038/sj.ejcn.1601443. 29. Humphreys J, De La Maza P, Hirsch S, Barrera G,
Gattas V, Bunout D. Muscle strength as a predictor of loss of functional status in hospitalized patients. Nutrition. 2002; 18:616-20. doi: 10.1016/S0899-9 007(02)00756-6.
30. Matos LC, Tavares MM, Amaral TF. Handgrip strength as a hospital admission nutritional risk screening method. Eur J Clin Nutr. 2007; 61(9): 1128-35. doi:10.1038/sj.ejcn.1602627.