Nutritional Risk in the Urban Population of Ouro Preto, Southeastern
Region of Brazil: The Ouro Preto Heart Study
Silvia Nascimento de Freitas, Waleska Teixeira Caiaffa, Cibele Comini César, Valéria Andrade Faria, Raimundo Marques
do Nascimento, George Luiz Lins Machado Coelho
Universidade Federal de Ouro Preto, Universidade Federal de Minas Gerais e Instituto de Hipertensão Arterial - Belo Horizonte – Ouro Preto, MG - Brazil
Mailing Address: George Luiz Lins Machado Coelho •
R. Domingos Barroso, 170 – 35400-000 – Ouro Preto, MG - Brazil E-mail: [email protected]
Manuscript received January 23, 2006; revised manuscript received March 29, 2006; accepted June 1, 2006
Summary
Objective: To estimate the prevalence of combined nutritional risk [body mass index (BMI) and waist circumference (WC)] according to sociodemographic and sedentarism characteristics of the urban population of Ouro Preto, state of Minas Gerais, Brazil.
Methods: This cross-sectional study was conducted with a probability sampling of 768 subjects aged 15 years or older. Nutritional risk (NR) was defined according to the BMI and WC classification criteria adopted by the National Institutes
RI+HDOWK,VRODWHG15,15ZDVGHILQHGDVZRPHQZLWK:&FPDQGPHQZLWK:&FPDQGWKHFRPELQHG
QXWULWLRQDOULVN&15DVWKHVDPH:&YDOXHVPHQWLRQHGDERYHDQGRU%0,NJP2. Binary logistic regression and
the Hosmer & Lemeshow test were used to construct and adjust these models.
Results: INR was observed in several BMI categories for both women and men, with the following results: 19.1% and 1.4% among those with normal weight, 91.7% and 56% in overweight patients, and 98.5% and 80% in obese patients, respectively. Age and level of education were independently associated with the CNR. Odds ratios (OR) for CNR in women and men over 60 years of age were 9.94 and 14.35, respectively, when compared to younger patients. For women with < 4 years of schooling, the OR was 1.83 compared to patients with more than 4 years of school attendance, while among men with an average number of years of school attendance, the OR was 2.55 relative to those with more years of schooling.
Conclusion: These findings show that age and education have an independent effect on the probability of CNR occurrence, and also that a joint analysis of BMI and WC is important in screening groups for nutritional risk.
Key words: Overweight; obesity; body mass index; abdominal circumference; prevalence.
Introduction
Obesity is a chronic multifactor disease characterized by excess adipose body tissue. It has been simultaneously cited as an important risk factor for increased mortality and the onset of non-transmissible chronic diseases1,2. Several studies have documented the relevance of anthropometric indicators for diagnosing obesity and assessing the nutritional risk for comorbidities2-4.
In epidemiological studies, body mass index (BMI) is the indicator most commonly used due to its good correlation with total body fat, easy applicability, and low-cost5. However, this index has clear limitations when it comes to defining overweight/obesity according to the different categories of gender, age, race, and physical activity, and evaluating the nutritional risk for comorbidity3,6,7, as well as differentiating and quantifying body fat distribution5,8.
Diabetes, arterial hypertension, and metabolic syndrome are risks known to be associated with the distribution of body
fat and, more specifically, the increase of central fat 2,3,9,10. The most commonly used method to evaluate central obesity has been the waist circumference (WC) measurement due to its good correlation with visceral fat3,11,12. Some authors have shown that in normal-weight, overweight, and grade-I obesity individuals, as defined by their BMI, the nutritional risk for the occurrence of non-transmissible comorbidities may be underestimated when there is an increased WC3,7,12.
Recently, the combined use of BMI and WC has been proposed for assessing the nutritional risk in a given population3,7,9,13,14, considering that this procedure increases the accuracy of the diagnosis. However, it should be noted that the nutritional risk might vary according to social, economic, demographic, and behavioral characteristics of different population groups15,16. All this considered, this study had the goal of estimating the prevalence of the combined nutritional risk [body mass index (BMI) and waist circumference (WC)] of the urban population of Ouro Preto, state of Minas Gerais, southeastern Brazil, according to their sociodemographic and sedentarism characteristics.
Methods
with a population aged 15 years or older living in private homes of the city of Ouro Preto, Minas Gerais, totaling 25,222 individuals.
Study design and sample - This is an epidemiological sectional-type study designed to estimate the prevalence of risk factors for cardiovascular diseases in this population. The sample consisted of 929 households and was calculated using an estimated prevalence of systemic arterial hypertension of 25%17, a desirable accuracy of 3%, a significance level of 95%, and an estimated loss of 20%. Households were selected from the list of addresses distributed over 33 census districts, and according to household density by district as defined by the Instituto Brasileiro de Geografia e Estatística (IBGE) (Brazilian Institute of Geography and Statistics)18. From each sample household, one individual aged 15 years or older whose date of birth was closest to the interview date was selected. If the chosen individual did not wish to take part of the study, that household was eliminated and replaced by the next house to its right. Collective or commercial buildings, or those whose residents did not wish to participate, were substituted by the next house to their right.
Data collection - Individuals interviewed were scheduled to undergo clinical and anthropometric examinations from 7:00 am to 10:00 am after a 12-hour fast. Participants were weighed on a TANITA BF 542™ scale (maximum weight 136 kg with a 0.2 kg variation), calibrated for each measurement, with subjects wearing light clothing, no jewelry and/or costume jewelry, having an empty bladder and after having fasted for 12 hours.
Participants’ height was measured according to Frisancho’s19 method using a field anthropometer. The criterion for the classification of body mass index (BMI) of adults and elderly people was that established by the World Health Organization and adapted by the National Institutes of Health (NIH)20. According to this criterion, individuals with BMI < 18.5 kg/m2 are underweight, those from 18.5 to 24.9 are normal-weight, WRNJP2DUHRYHUZHLJKWDQGSHRSOHNJP2 are obese. For adolescents, the international Cole et al.21 standard was used, which classifies teenagers with BMI < 5th SHUFHQWLOHDVXQGHUZHLJKWEHWZHHQth to < 95th percentile
DVRYHUZHLJKWDQGLQWKHth percentile as obese. Waist circumference (WC) was measured at the midway point between the coastal margin and iliac crest, or natural waist, with the patient in the supine position. Women with YDOXHVWRFPDQGPHQZLWKWRFP were classified as having excess central fat (central overweight), therefore bearing a moderate isolated nutritional risk (INR) IRUQRQWUDQVPLVVLEOHPRUELGLWLHV:RPHQZLWK:&YDOXHV DQGPHQZLWKFPZHUHFODVVLILHGDVKDYLQJFHQWUDO obesity, or a high INR according to the criteria proposed by Lean et al 22. The term INR was adopted in order to check for the presence of risk in the different BMI categories.
WC and BMI classification criteria were used to define the combined nutritional risk (CNR). Subjects were classified as being ‘no-risk’ when they had normal WC measurements (WC < 80 for women and < 94 cm for men) and underweight or normal BMI (BMI < 25 kg/m2 or below the 85th percentile >DGROHVFHQWV@6XEMHFWVDWULVNZHUHWKRVHZLWK,15:& FPIRUZRPHQDQG:&FPIRUPHQUHJDUGOHVVRIWKH BMI category, and also those considered overweight or obese as per their BMI, for the definition of the final explanatory model using multivariate logistics.
Sociodemographic and sedentarism data were obtained by direct personal interviews using a structured and pre-coded questionnaire. Educational level was classified as low (from illiterate to incomplete primary education), middle (complete primary education to incomplete secondary education), and high (complete secondary education to higher education). The socioeconomic class was defined by criteria proposed by the Associação Nacional de Pesquisa23 according to the number of consumer goods, domestic aid, number of bathrooms in the house, and level of education of the head of the family. Socioeconomic classes were grouped as A and B (high and middle), C (middle-low), D and E (low and very low). Occupational activity was categorized as light (activities easily performed or that can be performed seated, e.g., secretarial work), moderate (work that required walking and sitting, e.g., stock keeping work), or heavy (heavy work, such as civil construction work). In this study, sedentarism was defined as the combination of occupational activity and duration of
Gender Age group (years) IBGE % Sample % Weight
Male 15 a 19 2,932 7.21 41 4.33 1.6329
20 a 39 9,276 22.80 111 12.01 1.9082
40 a 59 5,390 13.24 86 9.31 1.4311
60 ou + 1,870 4.59 41 4.44 1.0415
Female 15 a 19 2,870 7.05 45 4.76 1.4563
20 a 39 9,763 24.00 242 25.87 0.9212
40 a 59 5,816 14.30 229 24.78 0.5799
60 ou + 2,767 6.80 134 14.50 0.4715
Total 40,684 100.00 929 100.00
physical activity during leisure time24,25. Those who had a light or moderate occupational activity, such as students, office clerks, teachers, among others, and less than 150 minutes of physical activity per week during their leisure time, were classified as sedentary.
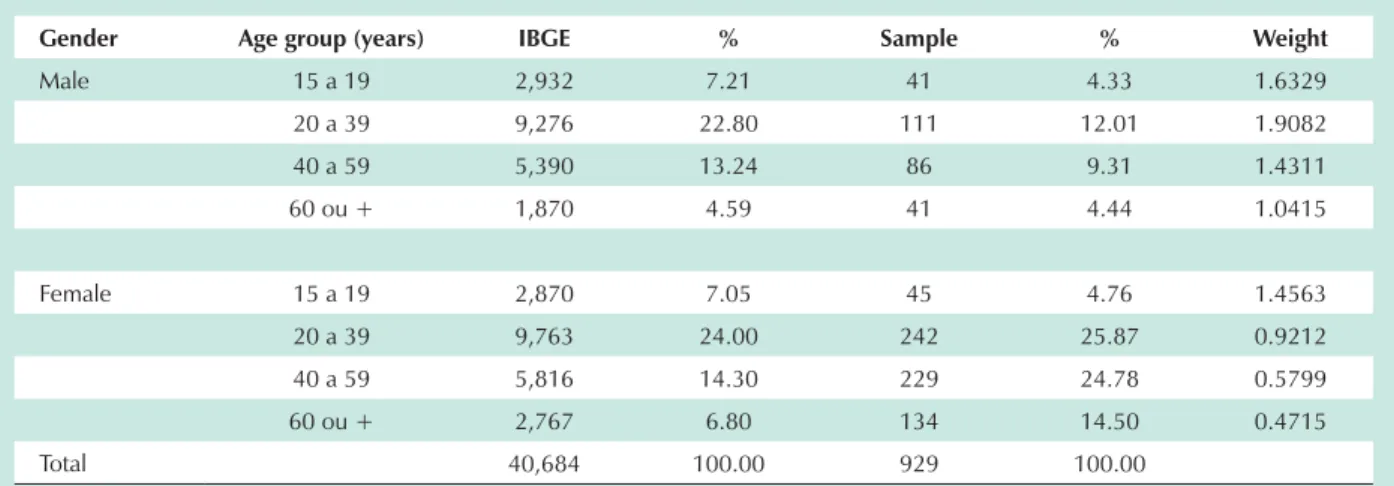
Statistical analysis - The analysis was weighted26 by gender and age, and the weights were determined by the ratio between the proportions of individuals in the IBGE and in the sample (Table 1). Pearson’s chi-square test (F2) was used to compare the proportions of individuals in the sample and estimated by IBGE, and compare subjects with a CNR according to sociodemographic variables and sedentarism. Variance analysis was used to compare the anthropometric measurement means, and Student’s minimum significant difference test was used to compare paired groups. Binary logistic regression and the Hosmer & Lemeshow’s test were utilized to construct and verify the adjustment of the models of factors independently associated with the combined QXWULWLRQDO ULVN :& DQG %0, $ S YDOXH DQG epidemiological and biological plausibility were the criteria used for the inclusion of variables in the multivariate model.
$SYDOXHZDVDGRSWHGDVDVWDWLVWLFDOO\VLJQLILFDQWOHYHO for defining the final model.
The project was approved by the Universidade Federal de Ouro Preto Research Ethics Committee, under the number 2001/26.
Results
Comparing the characteristics of the study sample with information about the population estimated by IBGE in the city, a significantly larger proportion (70%) of women over men and adults (71.9%) over young people was observed. The sample was then weighted by gender and age and consisted of 768 individuals, 50.8% women and 49.2% men; 16.5% of the participants were between 15 and 19 years of age, 45.3% between 20 to 39 years of age, 27.2% between 40 and 59 years of age, and 10.9% were 60 years or older. Refusals to continue participating in the second phase of the study when clinical and anthropometric examinations were being performed, after three systematic invitations, totaled 17.2%.
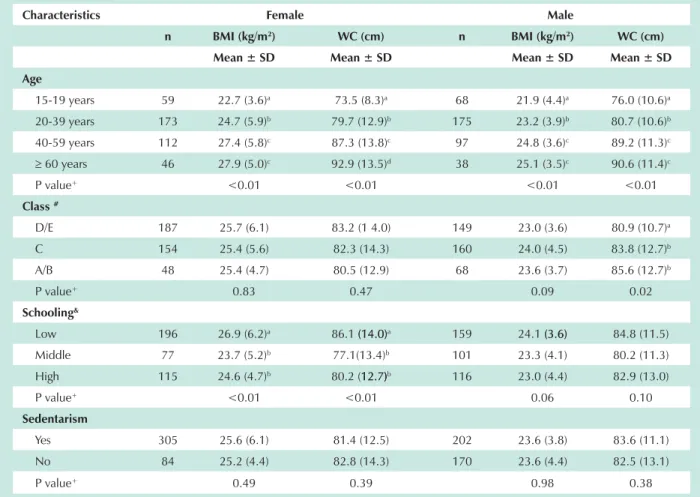
Table 2, stratified by gender, displays means and
Characteristics Female Male
n BMI (kg/m2) WC (cm) n BMI (kg/m2) WC (cm)
Mean ± SD Mean ± SD Mean ± SD Mean ± SD
Age
15-19 years 59 22.7 (3.6)a 73.5 (8.3)a 68 21.9 (4.4)a 76.0 (10.6)a
20-39 years 173 24.7 (5.9)b 79.7 (12.9)b 175 23.2 (3.9)b 80.7 (10.6)b
40-59 years 112 27.4 (5.8)c 87.3 (13.8)c 97 24.8 (3.6)c 89.2 (11.3)c
t 60 years 46 27.9 (5.0)c 92.9 (13.5)d 38 25.1 (3.5)c 90.6 (11.4)c
P value+ <0.01 <0.01 <0.01 <0.01
Class#
D/E 187 25.7 (6.1) 83.2 (1 4.0) 149 23.0 (3.6) 80.9 (10.7)a
C 154 25.4 (5.6) 82.3 (14.3) 160 24.0 (4.5) 83.8 (12.7)b
A/B 48 25.4 (4.7) 80.5 (12.9) 68 23.6 (3.7) 85.6 (12.7)b
P value+ 0.83 0.47 0.09 0.02
Schooling&
Low 196 26.9 (6.2)a 86.1 (14.0)(14.0)a 159 24.1 (3.6)(3.6) 84.8 (11.5)
Middle 77 23.7 (5.2)b 77.1(13.4)b 101 23.3 (4.1) 80.2 (11.3)
High 115 24.6 (4.7)b 80.2 (12.7)12.7))b 116 23.0 (4.4) 82.9 (13.0)
P value+ <0.01 <0.01 0.06 0.10
Sedentarism
Yes 305 25.6 (6.1) 81.4 (12.5) 202 23.6 (3.8) 83.6 (11.1)
No 84 25.2 (4.4) 82.8 (14.3) 170 23.6 (4.4) 82.5 (13.1)
P value+ 0.49 0.39 0.98 0.38
#Socioeconomic class: A/B: high-middle, C: middle-low, D/E: low-very low. &Schooling: Low: illiterate to incomplete primary level; Middle: complete
primary to incomplete secondary level; High: complete secondary level to higher education.
P value (ANOVA) as per sociodemographic and gender characteristics.
a,b,c,d: the same letters indicate similarity of means among the strata of the same indicator.
standard deviations of the anthropometric indicators by sociodemographic and sedentarism characteristics. In summary, BMI and WC means in women varied significantly according to age and level of education, and the variation was more significant among women 60 years of age or older and with lower levels of schooling. No significant differences as to socioeconomic class and sedentarism were observed. Among men, the mean BMI varied according to age; however, the mean WC increased significantly with age and according to socioeconomic class improvement.
Table 3 displays the nutritional profile, from BMI and WC classifications according to social, demographic, and sedentarism characteristics. A significant variation of the nutritional profile according to gender, age, schooling, and sedentarism was observed.
Using BMI, the overall prevalence observed of underweight was 6.4% (n=49), overweight was 30% (n=230), and obesity was 11.9% (n= 92). Overweight and obesity were more
frequent among women, 31% and 17.2%, respectively, among SDUWLFLSDQWV\HDUVRIDJHDQGDQGDPRQJ those with less years of schooling (35.8% and 15.2%).
As to the overall prevalence of central overweight, 19.1% (n= 146) of the participants met this criterion, as well as 19.4% (n= 149) for central obesity; among women, central overweight was present in 21.9% and central obesity in 32.4%, whereas in men it occurred in 16.4% e 6.1%, respectively. 7KHVHWZRLQGLFDWRUVZHUHDOVRJUHDWHULQWKRVHDJHG years (29.8% and 40.5%) and in those classified as sedentary (20.3% e 21.5%). As to the educational levels, approximately 50% of the individuals with little schooling presented a prevalence of central overweight or central obesity, whereas it was 40% among high-class individuals.
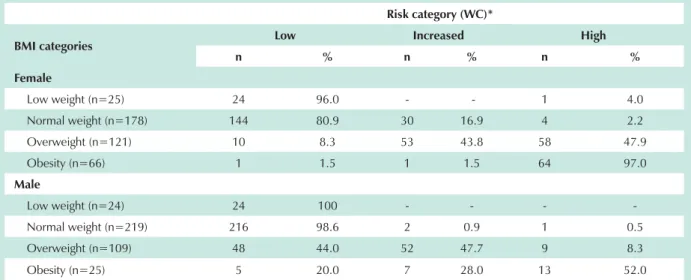
Concerning the frequency of the isolated nutritional risk associated with different BMI and WC categories (Table 4), individuals at nutritional risk due to WC values were found in all BMI classifications. That is, even though classified as people with
BMI (kg/m2) WC (cm)***
UW N OW OB p+ N COW CO p+
n % n % n % n % n % N % n %
% Total* 6.4 51.7 30.0 11.9 61.5 19.1 19.4
Gender
Female 25 6.4 177 45.4 121 31.0 67 17.2
<.01 178 45.8 85 21.9 126 32.4 <.01
Male 24 6.4 219 58.1 109 28.9 25 6.6 294 77.6 62 16.4 23 6.1
Age
15-19 years 14 11.0 90 70.9 17 13.4 6 4.7
<.01
112 87.5 11 8.6 5 3.9
<.01
20- 39 years 24 6.9 198 56.9 96 27.6 30 8.6 239 68.7 66 19.0 43 12.4
40- 59 years 7 3.4 81 38.9 81 38.9 39 18.8 96 45.9 45 21.5 68 32.5
> 60 years 4 4.7 28 32.9 37 43.5 16 18.8 25 29.8 25 29.8 34 40.5
Schooling&
Low 16 4.5 158 44.5 127 35.8 54 15.2
<.01
176 49.6 89 25.1 90 25.4
<.01
Média 17 9.6 105 59.0 37 20.8 19 10.7 137 77.0 21 11.8 20 13.4
High 16 6.9 131 56.5 66 28.4 19 8.2 158 68.4 34 14.7 39 26.2
Class#
D/E 19 5.7 180 53.6 98 29.2 39 11.6
0.34
203 60.6 64 19.1 68 20.3
0.74
C 23 7.3 156 49.5 91 28.9 45 14.3 197 62.7 55 17.5 62 19.7
A/B 8 6.8 59 50.4 42 35.9 8 6.8 71 61.2 26 22.4 19 16.4
Sedentarism
Yes 30 5.9 258 50.9 147 29.0 72 14.2
0.05 296 58.3 103 20.3 109 21.5 0.04
No 19 7.5 135 52.9 82 32.2 19 7.5 173 67.8 42 16.5 40 15.7
* n varies due to unknown data.
** BMI: UW (underweight) N (Normal); OW (Overweight); O (Obesity). *** WC: N (normal); COW (central overweight); CO (central obesity).
# Socioeconomic class: A/B: high to middle, C: low middle, D/E: low to very low.
&Level of schooling: Low: from illiterate to incomplete primary; Middle: complete primary to incomplete secondary, High: complete secondary to higher
education.
P value (F2 Pearson): proportion comparison between strata of the same indicator.
Risk category (WC)*
BMI categories Low Increased High
n % n % n %
Female
Low weight (n=25) 24 96.0 - - 1 4.0
Normal weight (n=178) 144 80.9 30 16.9 4 2.2
Overweight (n=121) 10 8.3 53 43.8 58 47.9
Obesity (n=66) 1 1.5 1 1.5 64 97.0
Male
Low weight (n=24) 24 100 - - -
-Normal weight (n=219) 216 98.6 2 0.9 1 0.5
Overweight (n=109) 48 44.0 52 47.7 9 8.3
Obesity (n=25) 5 20.0 7 28.0 13 52.0
*Low risk: WC <80 cm (women) and <94 cm (men); increased risk: WC ³ 80 cm to < 88 cm (women) and > 94 to < 102 cm (men) and high risk: CC >88 cm (women) and > 102 cm (men).
Table 4 - Frequency distribution of nutritional risk associated with different categories of BMI (kg/m2) and WC (cm), according to gender
normal BMI, mean values of participants’ WC measurements were above normal: 19.1% for women and 1.4% for men. As to overweight BMI, the percentage of high risk (central obesity) was 47.9% for women and 8.3% for men. Most women in this group classified as obese, according to the BMI, had central obesity (97%) due to their WC, whereas among men this percentage was 52%. In the underweight category according to the BMI, only one woman with a high nutritional risk was found, that is, she was obese; no men fit the INR category.
Table 5 displays the prevalence of combined nutritional risks (BMI and WC). Men and women presented a significant rise in this risk indicator with age, and a drop with higher levels of schooling.$PRQJSDWLHQWV\HDUVRIDJHRUROGHUWKH prevalence of CNR was 84.8% for women and 63.2% for men, and 70.6% and 43.4% for women and men, respectively, with lower educational levels. It is worth mentioning that among women, a significant difference (p< 0.01) was observed in all schooling categories, whereas among men with middle and high education levels, the CNRs were similar (p = 0.53).
The lack of physical activity was not significantly related to CNR in both genders, as well as socioeconomic class categories among women (p>0.20).
Table 6 displays bivariate and multivariate analyses. Combined nutritional risk was significantly associated with age and education in both genders, and with the socioeconomic class among men. The CNR increased with age in both genders, with more marked magnitudes among men when compared to women. As to schooling, a different behavior was observed for each gender. At the time of construction of the multivariate models, it was decided that two classification categories of schooling would be used for women. Women ZLWK\HDUVRIVFKRROLQJKDGDJUHDWHU&15ZKHQFRPSDUHG to those with a higher level of education, whereas in men this index was significant among those in the middle range of years of schooling in comparison with those with higher education levels.
A trend towards a lower CNR risk was observed among men from D and E socio-economic classes (OR: 0.46; p= 0.058) when compared to those from classes A and B, which is what justified the inclusion of the socioeconomic class in the final model. The model adjustments by the Hosmer & Lemeshow’s test were p=0.90 for women and p=0.47 for men.
Discussion
In this study, regardless of the indicator used, a high prevalence of obesity and overweight was observed in the population over 15 years of age in Ouro Preto. Among women, overweight/obesity was 48.2% and among men, 35.5%, when using BMI. When the waist circumference was the criterion, the results were approximately 54.2% and 22.4%, respectively, for women and men. These data suggest that individuals with normal or overweight BMIs, particularly women, may show central obesity indicating that characteristics of fat distribution should be taken into consideration when evaluating nutritional risks.
Some studies have shown that the BMI score may underestimate or overestimate overweight and obesity5,8, since despite its correlation with excess body fat, the index would only reflect body proportions without estimating adiposity and the distribution of body fat.5 On the other hand, WC measurement has recently started to be used as a health risk indicator4,9,14,22,27.
Characteristics Female Male
Combined risk* Combined risk*
W/o % (n) W/% (n) p+ W/o % (n) W/ % (n) p+
Age
15-19 years 72.9 (43) 27.1 (16) 88.2 (60) 11.8 (8)
<0.01
20-39 years 50.9 (88) 49.1 (85) 67.4 (118) 32.6 (57)
40-59 years 25.9 (29) 74.1 (83) 50.0 (49) 50.0 (49)
t 60 years 15.2 (7) 84.8 (39) <0.01 36.8 (14) 63.2 (24)
Schooling&
Low 29.4 (58) 70.6 (139) 56.6 (90) 43.4 (69)
0.05
Middle 64.9 (50) 35.1 (27) 67.6 (69) 32.4 (33)
High 50.9 (59) 49.1 (57) <0.01 69.8 (81) 30.2 (35)
Socioeconomic class#
D/E 39.0 (73) 61.0 (114) 70.5 (105) 29.5 (44)
0.10
C 46.8 (72) 53.2 (82) 60.0 (96) 40.0 (64)
A/B 47.9 (23) 52.1 (25) 0.28 58.8 (40) 41.2 (28)
Sedentarism
No 42.4 (36) 57.6 (49) 64.9 (111) 35.1 (60)
0.61
Yes 43.1 (132) 56.9 (174) 0.90 62.4 (126) 37.6 (76)
:LWKRXWULVN:&FPZRPHQDQGFPPHQDQGORZZHLJKWRUQRUPDO%0,:LWKULVN:&FPZRPHQDQG:&FPPHQ
regardless of BMI category or individuals in the overweight or obesity BMI categories. &Schooling: Low: illiterate to incomplete primary; Middle:
complete primary to incomplete secondary; High: complete secondary to higher education. #Socioeconomic class: A/B: high to middle. C: low middle.
D/E: low to very low. P value (F2 Pearson): proportion comparison among strata of the same indicator.
Table 5 - Prevalence of combined nutritional risk (BMI and WC) by gender, according to sociodemographic characteristics
increasing the release of free fatty acids to the portal venous system, stimulating gluconeogenesis, and inhibiting insulin clearance in the liver, as well as contributing to increased glycemia, insulinemia, and insulin resistance4,29,30, with the resulting increase in arterial hypertension, cardiovascular diseases, and cancer9,31 .
,Q WKLV VWXG\ DFFRUGLQJ WR WKH ,15 FODVVLILFDWLRQ :& FPDPRQJZRPHQDQGFPLQPHQDQG%0,WKUHH different categories of individuals were found. The first two consisted of individuals with central overweight (moderate INR) or central obesity (high INR), but with normal/overweight or obesity BMI scores, and those with a normal WC (low INR), but classified as overweight or obesity according to the BMI. Possible explanations for these inconsistencies could be attributed to the uneven distribution of body fat or muscle mass that could be increased by the type of physical activity adopted by some individuals classified as being overweight or even obese, according to the BMI5,8. However, no health risks were reported in the second hypothesis 8,32. Nevertheless, it is probable that this hypothesis is not applicable to Ouro Preto, particularly if we take into account the high prevalence of sedentarism in this population, be it among normal weight individuals or in those overweight or obese33. Therefore, the first hypothesis remains, in which the results suggest, once again, that BMI alone could be under- or overestimating the prevalence of risks, making it difficult to screen the population with a nutritional risk if WC is not taken into consideration3,7.
In the population studied, women aged 40 years or older with low education levels had a higher prevalence of CNR when compared to those in other strata. These data are similar to those reported by other national studies10,15,16. Among men, in addition to what was observed among women, a low and very low economical status was also associated with RNC; however, its prevalence was lower than in other classes. These results are also consistent with findings in literature regarding socioeconomic classifications, i.e., that men in higher socioeconomic classes show a higher prevalence of nutritional risk15,34.
The adjusted analysis confirmed the independent roles of age and level of education in a higher nutritional risk for women and men, findings similar to those observed by other authors35,36. It also showed that among young adult men (20 to 39 years of age), there was a high odds ratio (OR) for CNR which could suggest an early risk for hypertension, diabetes mellitus, and cardiovascular diseases for men. Additionally, it might possibly explain the higher rates of mortality due to circulatory tract diseases in the city of Ouro Preto among these individuals in all age groups, relative to women under 50 years of age37.
Gross OR Adjusted OR
WOMEN OR (IC 95%) p+ OR (IC 95%) p+
Age
15-19 years 1.00 1.00
20-39 years 2.66 (1.39; 5.10) <0.01 2.41 (1.24; 4.66) <0.01
40-59 years 7.69 (3.76; 15.70) <0.01 6.04 (2.81; 13.00) <0.01
t 60 years 14.61 (5.50; 38.91) <0.01 9.95 (3.55; 27.88) <0.01
Schooling&
> 4 years 1.00 1.00
d 4 years 3.16 (2.07; 4.78) <0.01 1.74 (1.06; 2.87) 0.03
Class#
A/B 1.00 1.00
C 1.04 (0.55; 1.99) 0.90 0.86 (0.42;1.77) 0.69
D/E 1.42 (0.75; 2.68) 0.28 1.15 (0.55; 2.40) 0.71
MEN OR (IC 95%) p+ OR (IC 95%) p+
Age
15-19 years 1.00 1.00
20-39 years 3.64 (1.63; 8.12) <0.01 5.02 (2.09; 12.08) <0.01
40-59 years 7.54 (3.26; 17.42) <0.01 10.14 (3.87; 26.59) <0.01
t 60 years 12.62 (4.65; 32.24) <0.01 14.35 (4.67; 44.08) <0.01
Schooling&
High 1.00 1.00
Middle 1.12 (0.63; 1.98) 0.71 2.55 (1.24; 5.23) 0.01
Low 1.80 (1.08; 2.98) 0.02 1.91 (0.96; 3.78) 0.06
Class#
A /B 1.00 1.00
C 0.95 (0.53; 1.70) 0.87 0.88 (0.43; 1.77) 0.71
D/E 0.60 (0.33; 1.09) 0.09 0.46 (0.21; 1.03) 0.058
#Socioeconomic class: A/B: high to middle. C: middle to low. D/E: low to very low. &Middle and high levels of schooling pooled. P value of the adjusted model (Wald test)
Table 6 - Odds ratios (95% CI) of combined nutritional risk (BMI and WC) by gender according to sociodemographic variables
One possibility to be investigated would be that the gradient of this association could have been influenced by the type of occupational activity undertaken by men5,8,38,39. That is, men in low or very low socioeconomic classes could have heavy occupational activities demanding intense physical activity, which could contribute to the trend towards lower risks in this study. However, the indicators employed in this study did not allow an accurate verification of the type of physical activity undertaken, since only occupational and leisure activities of the individuals, and not their functional capacity, were taken into account, and neither did these indicators allow a measurement of the direction of the correlation.
It is also worth pointing out that the utilization of adult reference standards for the classification of WC in adolescents may have lead to the systematic underestimation of the
population with CNR, since as per reports in literature, the proportion of body fat is age-dependent and adolescents tend to have a smaller proportion of intra-abdominal fat when compared to adults29. However, there are very few studies that establish the relationship between nutritional risk for non-transmissible diseases in this group, and in the absence of specific criteria, values determined for adults have been employed for the younger population11.
References
1. Katzmarzyk PT, Craig CL, Bouchard C. Underweight, overweight and obesity: relationships with mortality in the 13-year follow-up of the Canada Fitness Survey. J Clin Epidemiol. 2001; 54: 916-20.
2. Doll S, Paccaud F, Bovet P, Burnier M, Wietlisbach V. Body mass index, abdominal adiposity and blood pressure: consistency of their association across developing and developed countries. Int J Obes. 2002; 26: 48-57.
3. Janssen I, Katzmarzyk PT, Ross R. Waist circumference and not body mass index explains obesity-related health risk. Am J Clin Nutr. 2004; 79: 379-84.
4. Misra A, Vikram NK. Clinical and pathophysiologial consequences of abdominal adiposity and abdominal adipose tissue depots. Nutrition. 2003; 19 (5): 457-66.
5. Prentice AM, Jebb SA. Beyond body mass index. Obes Rev. 2001; 2: 141-7.
6. Bray GA. Evaluation of obesity: who are the obese? Postgrad Med. 2003; 114 (6): 19-27.
7. Ardern CI, Katzmarzyk PT, Janssen I, Ross R. Discrimination of health risk by combined body mass index and waist circumference. Obes Res. 2003; 11 (1): 135-42.
8. Frankenfield DC, Rowe WA, Cooney RN, Smith JS, Becker D. Limits of body mass index to detect obesity and predict body composition. Nutrition. 2001; 17: 26-30.
9. Bigaard J, Tjonneland A, Thomsen BL, Overad K, Heitmann BL, Sorensenet TIA. Waist circumference, BMI, smoking, and mortality in middle-aged men and women. Obes Res. 2003; 11 (7): 895-903.
10. Olinto MTA, Nacul LC, Gigante DP, Costa JSD, Menezes AMB, Macedo S. Waist circumference as a determinant of hypertension and diabetes in Brazilian women: a population-based study. Public Health Nutr. 2004; 7 (5): 629-35.
11. Velásquez-Meléndez G, Kac G, Valente JG, Tavares R, Silva CQ, Garcia ES. Evaluation of waist circumference to predict general obesity and hypertension in women in great metropolitan Belo Horizonte, Brazil. Cad Saúde Pública. 2002; 18 (3): 765-71.
12.Zhu SK, Wang Z, Heshka S, Heo M, Faith MS, Heymsfield SB. Waist circumference and obesity-associated risk factors among whites in the third National Health and Nutrition Examination Survey: clinical action thresholds. Am J Clin Nutr. 2002; 76: 743-9.
13. Zhu S, Heshka S, Wang Z Shen W, Allison DB, Ross R. Combination of BMI and waist circumference, and health risk for identifying cardiocascular risk factors in whites. Obes Res. 2004; 12: 633-45.
14.Wannamethee SG, Shaper AG, Morris RW, Whincup PH. Measures of adiposity in the identification of metabolic abnormalities in elderly men. Am J Clin Nutr. 2005; 81: 1313-21.
15. Monteiro CA, Conde WL, Castro IRR. A tendência cambiante da relação entre
escolaridade e risco de obesidade no Brasil (1975-1997). Cad Saúde Pública. 2003; 19 (Supl. 1): S67-S75.
16. Instituto Brasileiro de Geografia e Estatística (IBGE). Pesquisa de orçamentos familiares - POF 2002-2003. [citado 2004, Março 20]. Disponível em: http://www.ibge.gov.br/.
17.Freitas OC, Carvalho RF, Neves JM, Prevalência da hipertensão arterial sistêmica na população urbana de Catanduva, SP. Arq Bras Cardiol. 2001; 77: 9-15.
18. Instituto Brasileiro de Geografia e Estatística (IBGE). Contagem populacional 1996: dados agregados por setores censitários 1996 (CD-ROM). Rio de Janeiro; 1996.
19. Frisancho AR. Anthropometric standards for the assessment of growth and nutritional status. Ann Arbor: The University of Michigan Press; 1990.
20. Clinical guidelines on the identification, evaluation, and treatment of overweight and obesity in adults: the evidence report. Bethesda; NIH Publication nº 98-4083. National Institutes of Health. National Heart, Lung and Blood Institute, 1998.
21. Cole TJ, Bellizzi MC, Flegal KM, Dietz WH. Establishing a standard definition for child overweight and obesity worldwide: international survey. BMJ. 2000; 320: 1240-3.
22. Lean M, Hans T, Morrison C. Waist circumference as a measure for indicating need for weight management. BMJ. 1995; 311: 158-61.
23. Associação Nacional de Empresas de Pesquisa. Critério de classificação econômica Brasil [citado em 2003 fevereiro 12]. Disponível em: http://www. anep.org.br.
24. FAO / OMS. Necessidades de energia y proteinas. Genebra: FAO / OMS, 1985. (Série de Informes Técnicos, 724).
25. Barnes PM, Schoenborn CA. Physical activity among adults: United States, 2000. (Advance data from vital and health statistics, nº 333).
26. Henry GT. Practical sampling. Newbury Park: Jage Publication LTD, 1990.
27. Carneiro G, Faria AN, Ribeiro FF Filho, Guimarães A, Lerario D, Ferreira SR. Influência da distribuição da gordura corporal sobre a prevalência de hipertensão arterial e outros fatores de risco cardiovascular em indivíduos obesos. Rev Assoc Med Bras. 2003; 49 (3): 306-11.
28. Wajchenberg BL. Subcutaneous and visceral adipose tissue: their relation to the metabolic syndrome. Endocr Rev. 2000; 21 (6): 697-738.
29. Scarsella C, Després PJ. Tratamiento de la obesidad: necessidad de centrar la atención en los pacientes de alto riesgo caracterizados por la obesidad abdominal. Cad Saúde Pública. 2003; 19 (Supl. 1): S7-S19.
30. Pi-Sunyer FX. The obesity epidemic: pathophysiology and consequences of obesity. Obes Res. 2002; 10 (Suppl 2): 97S-104S.
31. Bertsias G, Mammas I, Linardakis M, Kafatos A. Overweight and obesity in relation to cardiovascular disease risk factors among medical students in
showed an increased nutritional risk evaluated as per their WC measurements.
These findings, therefore, along with those reported by other authors, aggregate evidence for the possible underestimation of nutritional risk when only one indicator is used in the evaluation3,7,40, as is the case with the BMI. The proposal made by Zhu et al13, for a combination of the two indices (BMI and WC) in the process of identifying factors of cardiovascular risk, with specific combined risk points for white women and men, adjusted for co-variables such as physical activity, smoking, alcohol consumption, and schooling, is corroborated by the findings in our study.
Moreover, the findings in this study allow us to reflect on the
relevance of the combined use of BMI and WC at health care units in order to increase accuracy in diagnosing nutritional risks, and the importance of considering age and schooling.
Acknowledgements
To CNPq, Universidade Federal de Ouro Preto, Prefeitura Municipal de Ouro Preto, Unimed dos Inconfidentes, Alcan Alumínio do Brasil.
Potential Conflict of Interest
Crete, Greece. BMC Public Health. 2003; 3 (3): 1-9.
32. Forbes G. Longitudinal changes in adult fat-free mass: influence of body weight. Am J Clin Nutr. 1999; 70: 1025-31.
33. Ferreira S. Prevalência dos fatores de risco para doenças cardiovasculares em Ouro Preto. Projeto Corações de Ouro Preto [Dissertação]. Ouro Preto: Universidade Federal de Ouro Preto; 2004.
34. Kain J, Vio F, Albala C. Obesity trends and determinant factors in Latin America. Cad Saúde Pública. 2003; 19 (supl. 1): S77-S86.
35. Hugles VA, Frontera WR, Roubenoff R, Evans WJ, Singh MAF. Longitudinal changes in body composition in older men and women: role of body weight change and physical activity. Am J Clin Nutr. 2002; 76: 473-81.
36. Martins IS, Marinho SP. The potential of central obesity antropometric
indicators as diagnostic tools. Rev Saúde Pública. 2003; 37 (6): 760-7.
37. Ministério da Saúde. Datasus. Sistema de informações sobre mortalidade. Brasília, 2000.
38. Yamada Y, Ishizaki M, Tsuritani I. Prevention of weight gain and obesity in occupational populations: a new target of health promotion services at worksites. J Occup Health. 2002; 44 (6): 373-84.
39. Hu G, Sarti C, Jousilahti P, Silventoinen K, Barengo NC, Tuomilehto HJ. Leisure time, occupational, and commuting physical activity and risk of stroke. Stroke. 2005; 36: 1994-9.