Relationship between adductor pollicis muscle
thickness and subjective global assessment in a
cardiac intensive care unit
INTRODUCTION
In Brazil, the World Health Organization (WHO) estimates that in 2008, about 17.3 million people died from cardiovascular diseases, among which 7.3 million due to coronary heart disease.(1)
Patients with cardiovascular disease often require treatment in intensive care units (ICU), and malnutrition then becomes a common problem.(2) he state
of malnutrition is usually diagnosed using tools such as the subjective global assessment (SGA) and the mini nutritional assessment (MNA®
).(3) A literature
review for the period 1998 to 2012 showed that the prevalence of malnutrition in hospitalized seniors ranges from 2% to 80%. his diversity is due to several factors, including the heterogeneity of the population.(4)
Fernanda Pickrodt Karst1, Renata Monteiro Vieira1, Sandra Barbiero1
1. Instituto de Cardiologia, Fundação Universitária de Cardiologia do Rio Grande do
Sul - Porto Alegre (RS), Brazil. Objective: To verify the relationship
between the adductor pollicis muscle thickness test and the subjective global assessment and to correlate it with other anthropometric methods.
Methods: his observational
cross-sectional study was conducted in the intensive care unit of a cardiology hospital in the state of Rio Grande do Sul, Brazil. he hospitalized patients underwent subjective global assessment and adductor pollicis muscle thickness tests on both hands, along with measurement of the right calf circumference. Laboratory parameters, length of stay, vital signs and electronic medical record data and tests were all collected.
Results: he study population
included 83 patients, of whom 62% were men. he average age was 68.6 ± 12.5 years. he most common reason for hospitalization was acute myocardial infarction (34.9%), and the most
Conflicts of interest: None. Submitted on August 11, 2015 Accepted on November 17, 2015
Corresponding author:
Sandra Barbiero
Unidade de Pesquisa da Fundação Universitária de Cardiologia
Avenida Princesa Isabel, 370 - Santana Zip code: 90620-000 - Porto Alegre (RS), Brazil E-mail: [email protected]
Responsible editor: Flávio Ribeiro Machado
Relação da espessura do músculo adutor do polegar e avaliação
subjetiva global em unidade de terapia intensiva cardiológica
ABSTRACT
Keywords: Muscles; humb; Nutritional
assessment; Risk measurement
common pathology was systolic blood pressure (63.9%), followed by diabetes mellitus (28.9%). According to subjective global assessment classiications, 62.7% of patients presented no nutritional risk, 20.5% were moderately malnourished and 16.9% were severely malnourished. Women had a higher nutritional risk, according to both the subjective global assessment and the adductor pollicis muscle thickness test, the cutof for which was < 6.5mm (54.8%; p = 0.001). he pathology presenting the greatest nutritional risk was congestive heart failure (p = 0.001). Evaluation of the receiver operating characteristic (ROC) curve between adductor pollicis muscle thickness and subjective global assessment showed the accuracy of the former, with an area of 0.822.
Conclusion: Adductor pollicis muscle thickness proved to be a good method for evaluating nutritional risk.
he SGA is currently widely used and is considered to be the gold standard for subjective evaluation, as it includes questions relating to weight loss, eating habits, gastrointestinal symptoms, functional capacity, stress of the base disease and physical examination.(5) However,
a survey of 526 patients in an institution specializing in cardiology evaluated the use of diferent nutritional assessment tools and suggested that the use of a single tool of this nature is insuicient for a correct and reliable diagnosis of malnutrition in cardiac patients.(6)
An evaluation technique that has been used to estimate muscle loss and hence malnutrition is the measurement of adductor pollicis muscle thickness (APMT).(7) Numerous
studies involving clinical patients,(8) hospitalized
patients,(9) cirrhotic patients,(10) stroke victims,(11) surgical
patients,(12) cancer(13) and kidney patients(14) have been
conducted with APMT; however, there are few studies evaluating severe cardiac patients.(15) herefore, there is no
established cutof point for all populations.(16)
Body composition abnormalities are more diicult to clearly characterize in the intensive care environment; therefore, a strategy that combines diferent tools may be more appropriate. he present study aimed to verify the relationship between the adductor pollicis muscle thickness test and SGA and to correlate it with other anthropometric methods.
METHODS
his cross-sectional observational study evaluated patients admitted to the ICU of a reference cardiology hospital in the state of Rio Grande do Sul, Brazil. he study was conducted in accordance with the principles of the current revision of the Declaration of Helsinki, the most recent version of the Good Clinical Practice Guidelines and Resolution 466/12. It was approved by the Research Ethics Committee of the Fundação Universitária de Cardiologia under number UP 4957/14.
All patients of both genders admitted to the ICU of the institution who were more than 18 years old, who agreed to undergo the assessment and who signed the Terms of Free and Informed Consent (TFIC) were included in the study. In case of a patient’s inability to respond to and sign the TFIC, this agreement was solicited from the family or guardian. Patients with diseases that could exert a negative inluence on muscle tropism (except malnutrition), chronic degenerative or inlammatory disorders, peripheral neuropathy, cancer, acquired immune deiciency syndrome, inlammatory bowel disease, neurological and motor disorders, with amputation of any limb, anasarca and those whose data
collection was not possible within the irst 48 hours of admission were excluded.
he nutritional status assessment and anthropometric measurements were performed by the nutritionist responsible for the research in the ICU. Data were collected for SGA(5)
and APMT measurements.(7) Laboratory parameters, length
of stay and vital signs were collected later from the electronic medical records and nursing spreadsheet. To evaluate the SGA, the patient or family member answered questions relating to weight loss, eating habits, gastrointestinal symptoms, functional capacity, disease and physical examination. he patients were then classiied by SGA into well nourished (A), moderately malnourished (B), and severely malnourished (C).(5) For statistical analysis, these data were transformed
into dichotomous variables: no nutritional risk (nourished) and at nutritional risk (moderately malnourished and severely malnourished).
he weight and height measurements were either reported or estimated, as the ICU did not have an available bed scale or stadiometer, and patients were not clinically able to walk. Body mass index (BMI) was calculated and classiied according to age. For seniors ≥ 60 years, Lipschitz’s(17) criteria for BMI were used, and for those
between 18 and 59 years of age, the 1998 World Health Organization (WHO) criteria were used.(18)
Calf circumference (CC) was obtained with an inelastic and lexible tape measure with an accuracy of 1 mm and was measured at the midpoint of the right leg, lexed at 90°. Male and female patients with a circumference of < 31cm were considered to be at nutritional risk.(19) he APMT
measurement was performed with the patient seated, with arms lexed at approximately 90°, using a Cescorf® brand skinfold caliper (Porto Alegre, RS, Brazil), exerting a continuous pressure of 10g/mm2 to pinch the adductor
muscle in an imaginary triangle vertex formed by the extension of the thumb and foreinger. he procedure was performed on both hands three times, and the average value was used as the APMT measurement.(7) As there is no cut-of
point deined for this population, an article on valve surgery patients was used, which reported that an APMT thickness of < 6.5mm was associated with infectious complications.(15)
RESULTS
A total of 86 patients were evaluated between August and November 2014. One patient was excluded due to a positive diagnosis for acquired immunodeiciency syndrome (AIDS) and two because it was not possible to evaluate the APMT, for a total of 83 patients included in the study. he study population consisted of 52 men with an average age of 68.6 ± 12.5 years, with a minimum of 35 years and a maximum of 98 years. Other anthropometric and laboratory data are shown in table 1.
(21.6% of total sample), and 4.8% of the total sample were between 18 and 60 years old and eutrophic.
According to the SGA, 62.7% of patients were well nourished, 20.5% moderately malnourished and 16.9% severely malnourished. Upon combining the moderately malnourished and severely malnourished groups, 54.8% of women were at higher risk of malnutrition (p = 0.011); the same result occurred with those who had an APMT score of < 6.5 (Table 2). As expected, according to both SGA and APMT, older patients were at higher nutritional risk. Mortality was also higher in the SGA nutritional risk group, even though this inding was not statistically signiicant.
CHF showed a higher nutritional risk according to the SGA and the APMT - 9 of 10 CHF patients were at nutritional risk (p = 0.001) (Table 2).
he length of ICU hospitalization had an asymmetric distribution, hence the need for a median (Table 2).
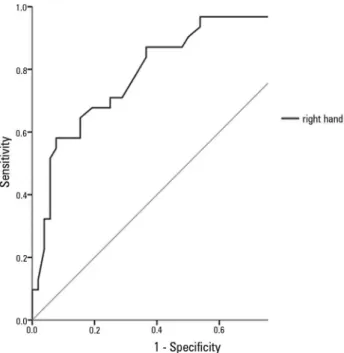
In assessing the ROC curve of the right-hand APMT.R correlation with SGA, the area under the curve was 0.822 (Figure 1), which demonstrates the accuracy of the APMT test.
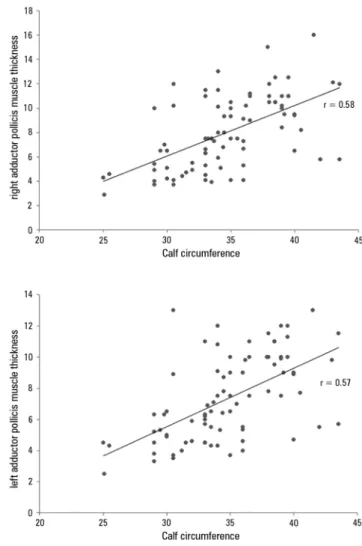
In correlating the APMT of the right hand with BMI (Figure 2), BMI and APMT.L (r = 0.44; p < 0.001) and BMI and APMT.R (r = 0.45; p < 0.001), the association was weak but signiicant, with a positive correlation. Figure 3 shows that there were also correlations between APMT.L and CC (r = 0.57; p < 0.001) and BMI and APMT.D (r = 0.58; p < 0.001).
DISCUSSION
In the present study, the population mostly consisted of elderly individuals (73.5%), with an average age of 68.6 years. As the elderly population is more prone to hospital malnutrition,(2) the importance of implementing screening
is evident, along with speciic nutritional assessment for this population. hese measures could help in early diagnosis and proper nutritional intervention(4) given that,
globally, the majority of severely ill patients do not receive proper nutrition during hospitalization in the ICU.(20)
Correct nutritional assessment is a challenge. More research is being conducted to identify the best tool to be used, as they vary in terms of diagnosis, overestimating or underestimating nutritional risk.(6,21,22) Upon analysis of
the methods used in the present study, the tools showed small diagnostic diferences, but both SGA and APMT showed relationships of accuracy, with areas under the curve (AUC) of 0.822 for both sensitivity and speciicity. hese data corroborate a cross-sectional study of patients eligible
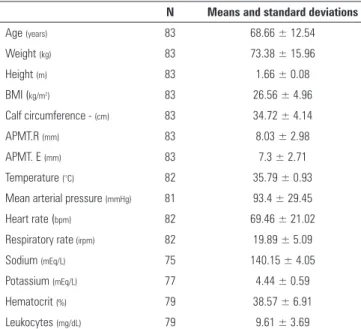
Table 1 - General characteristics of patients
N Means and standard deviations
Age (years) 83 68.66 ± 12.54
Weight (kg) 83 73.38 ± 15.96
Height (m) 83 1.66 ± 0.08
BMI (kg/m2) 83 26.56 ± 4.96
Calf circumference - (cm) 83 34.72 ± 4.14
APMT.R (mm) 83 8.03 ± 2.98
APMT. E (mm) 83 7.3 ± 2.71
Temperature (°C) 82 35.79 ± 0.93
Mean arterial pressure (mmHg) 81 93.4 ± 29.45
Heart rate (bpm) 82 69.46 ± 21.02
Respiratory rate (irpm) 82 19.89 ± 5.09
Sodium (mEq/L) 75 140.15 ± 4.05
Potassium (mEq/L) 77 4.44 ± 0.59
Hematocrit (%) 79 38.57 ± 6.91
Leukocytes (mg/dL) 79 9.61 ± 3.69
BMI - body mass index; APMT.R - adductor pollicis muscle thickness - right hand; APMT.L - adductor pollicis muscle thickness - left hand.
he most frequent cause of hospitalization was acute myocardial infarction (34.9%), followed by angina (24.1%), complete atrioventricular block (10.8%), pacemaker exchange (6%), aortic aneurysm (4.8%), congestive heart failure (CHF) (2.4%), stroke (1.2%) and other cardiac comorbidities (11.6%).
he following pathologies were among the most common pathologies observed: systemic arterial hypertension (SAH) in 63.9% of patients, followed by
diabetes mellitus (DM) in 28.9%, coronary artery disease (CAD) in 25.3%, CHF in 12%, stroke in 12% and other cardiac pathologies in 27.7%.
Table 2 - Subjective global assessment and adductor pollicis muscle thickness (dominant hand)
Variables
SGA APMT
No nutritional risk N = 52
With nutritional risk
N = 31 p value
No nutritional risk > 6.5mm*
N = 55
With nutritional risk < 6.5mm*
N = 28
p value
Age (years)
≥ 60 34 (53.1) 30 (45.9) 38 (59.4) 26 (40.5)
18 - 59 18 (94.7) 01 (5.3) 0.003 17 (89.5) 02 (10.5) 0.03
Gender
Female 14 (26.9) 17 (54.8) 13 (23.6) 18 (64.3)
0.001
Male 38 (73.1) 14 (45.2) 0.011 42 (76.4) 10 (35.7)
BMI (Lipschitz(17); WHO(18))
Malnourished 1 (1.9) 14(15.2) 4 (7.3) 11 (39.3)
Eutrophic 13(25.2) 10 (32.3) 0.001† 14 (25.5) 9 (32.1) 0.001†
Overweight 38 (73.1) 7 (22.6) 37 (67.3) 8 (28.6)
CAD 14 (29.8) 7 (22.6) 0.483 18 (36) 3 (10.7) 0.016
SAH 32 (69.6) 21 (67.7) 0.865 31 (63.3) 22 (78.6) 0.163
DM 13 (28.3) 11 (35.5) 0.502 12 (24.5) 12 (42.9) 0.094
Dyslipidemia 14 (30.4) 5 (16.1) 0.153 12 (24.5) 7 (25) 0.96
CHF 1 (2.2) 9 (29) 0.001 1 (2) 9 (32.1) 0.001
Stroke 4 (58.7) 6 (19.4) 0.172 5 (10.2) 5 (17.9) 0.337
Other pathologies 14 (30.4) 9 (29) 0.895 14 (28.6) 9 (32.1) 0.742
Death 1 (25) 3 (75) 0.127 2 (3.8) 2 (7.1) 0.519
Time in ICU** 3 (2 - 5.75) 3.5 (2 - 6) 0.845 4 (3 - 6) 3 (2 - 4.77) 0.183
Hospitalization time** 7 (5 - 9.8) 9 (4 - 14) 0.236 8 (6 - 13) 7 (4 - 10) 0.411
SGA - subjective global assessment; APMT - adductor pollicis muscle thickness; BMI - body mass index; DAC - coronary artery disease; SAH - systemic arterial hypertension; DM - diabetes mellitus; CHF - congestive heart failure; ICU - intensive care unit. * Cutoff point suggested for this population(15); † Pearson chi square test; ** median and interquartile range, Mann-Whitney U-test. The results expressed as number (percentage).
Figure 1 - ROC curve for right-hand adductor pollicis muscle thickness in relation to nutritional risk evaluated by subjective global assessment (area under the curve relative to a right-hand measurement of 0.82; 95% confidence interval from 0.73 to 0.91).
for surgical procedures, which evaluated SGA, APMT and other anthropometric and biochemical measures. In that study, APMT proved to be a reliable method for assessing the nutritional status of surgical patients when the results of this method were compared with the gold standard, SGA (area under the curve of 0.93).(12)
In research with valve surgery patients, APMT showed an association with postoperative complications, using sensitivity and speciicity assessment with an area under the curve of 0.624, characterizing the presence of septic complications in APMT < 6.5mm.(15) In our indings,
values of < 6.5mm were related to greater nutritional risk according to the SGA.
When we evaluated average APMT among our patients, from 7.3 ± 2.71mm to 8.03 ± 2.98mm (left hand and right, respectively), lower values were found compared to other studies. In a study investigating APMT in healthy people with an average age of 44.9 ± 18.5 years, the averages for men and women were 26.1 ± 4.4mm and 19.8 ± 3.3mm, respectively.(23) In surgical patients, the average
Figure 2 - Relationship between adductor pollicis muscle thickness values of both hands and body mass index. p < 0.05 in all correlations; r = 0.45.
Figure 3 - Correlation of adductor pollicis muscle thickness for both hands with anthropometric calf circumference measurements. p < 0.05 in all correlations; r = 0.58.
studying valve surgery patients, Andrade et al. found an average APMT value of 11.5mm.(15)
We believe that the low APMT value encountered in our results is because most of the studied population consisted of individuals over 60 years old (73%) and therefore with decreased muscle mass.
When correlated with BMI and CC, APMT.R showed a positive correlation, which is in line with the indings of Bragagnolo et al., according to whom APMT correlated with all of the classic anthropometric measurements, demonstrating the eiciency of the test.(12)
he SGA results were similar to those of a prospective cohort study with elderly patients with an average age of 74.2 years. he SGA in that study identiied 21% as moderately malnourished at ICU admission and was associated with increased length of hospital stay, a lower
propensity to be discharged, a greater need for palliative care and death at discharge (all p values < 0.05). hese results did not correspond with the present study, which did not observe a relationship with hospitalization time.(21)
Among the investigated conditions, the disorder that showed signiicance with nutritional risk (SGA) and muscle loss by APMT was CHF, afecting mainly the elderly. hese two nutritional assessment methods corroborate physiological changes caused by this syndrome, changes in cardiac output and impaired systemic circulation, leading to dyspnea, edema, fatigue(24) and loss of muscle mass,
regardless of total body mass.(25)
CONCLUSION
All nutritional assessment methods (subjective global assessment, body mass index, calf circumference and adductor pollicis muscle thickness) showed diferences in their results; however, they were eicient and positively correlated with the diagnosis of nutritional risk. Subjective global assessment was the most reliable method of classifying nutritional risk.
Adductor pollicis muscle thickness proved to be a good method for evaluating nutritional risk, as it was accurate
when compared to the gold standard, which is subjective global assessment. However, studies with a larger population that are able to establish a cutof and to demonstrate a relationship with outcomes and complications in the cardiac intensive care unit are required.
ACKNOWLEDGEMENTS
he authors would like to thank everyone who contributed to this work, especially the families and staf of the Cardiology Institute (Instituto de Cardiologia), RS.
Objetivo: Veriicar a relação do teste de espessura do
músculo adutor do polegar com avaliação subjetiva global e correlacioná-lo a outros métodos antropométricos.
Métodos: Estudo transversal observacional realizado em
unidade de terapia intensiva de um hospital de cardiologia no Estado do Rio Grande do Sul. Os pacientes internados foram submetidos à avaliação subjetiva global, da espessura do músculo adutor do polegar em ambas as mãos e da circunferência da panturrilha da perna direita. Foram coletados parâmetros laboratoriais, tempo de internação, sinais vitais, dados e exames do prontuário eletrônico.
Resultados: População composta de 83 pacientes, sendo
62% homens, com idade de 68,6 ± 12,5 anos. O motivo de internação mais frequente foi infarto agudo miocárdio (34,9%), e a patologia mais comum foi a hipertensão arterial sistólica
(63,9%) seguida de diabetes mellitus (28,9%). Conforme a classiicação da avaliação subjetiva global, 62,7% dos pacientes apresentaram-se sem risco nutricional, 20,5% moderadamente desnutridos e 16,9% gravemente desnutridos. As mulheres apresentaram maior risco nutricional, tanto pela avaliação subjetiva global quanto pela espessura do músculo adutor do polegar, que foi < 6,5mm (54,8%; p = 0,001). A patologia com maior risco nutricional foi a insuiciência cardíaca congestiva (p = 0,001). A avaliação da curva ROC entre espessura do músculo adutor do polegar e avaliação subjetiva global teve acuidade, com área de 0,822.
Conclusão: A espessura do músculo adutor do polegar
demonstrou ser um bom método de avaliação de risco nutricional.
RESUMO
Descritores: Músculos; Polegar; Avaliação nutricional;
Medição de risco
REFERENCES
1. World Health Organization (WHO). The top 10 causes of death. Fact sheet nº 310. Updated May 2014. [citado 2012 Out 10]. Disponível em:. http:// www.who.int/mediacentre/factsheets/fs310/en/index2.html
2. Vanderwee K, Clays E, Bocquaert I, Verhaeghe S, Lardennois M, Gobert M, et al. Malnutrition and nutritional care practices in hospital wards for older people. J Adv Nurs. 2011;67(4):736-46.
3. Borghi R, Meale MM, Gouveia MA, França JI, Damião AO. Perfil nutricional de pacientes internados no Brasil: análise de 19.222 pacientes (Estudo BRAINS). Rev Bras Nutr Clin. 2013;28(4):253-63.
4. Fidelix MS, Santana AF, Gomes JR. Prevalência de desnutrição hospitalar em idosos. Rev Assoc Bras Nutr. 2013;5(1):60-8.
5. Detsky AS, McLaughlin JR, Baker JP, Johnston N, Whittaker S, Mendelson RA, et al. What is subjective global assessment of nutritional states? JPEN J Parenter Enteral Nutr. 1987;11(1):8-13.
6. Pathirana AK, Lokunarangoda N, Ranathunga I, Santharaj WS, Ekanayake R, Jayawardena R. Prevalence of hospital malnutrition among cardiac patients: results from six nutrition screening tools. Springerplus. 2014;3:412.
7. Lameu EB, Gerude MF, Campos AC, Luiz RR. The thickness of the adductor pollicis muscle reflects the muscle compartment and may be used as a new anthropometric parameter for nutritional assessment. Curr Opin Clin Nutr Metab Care. 2004;7(3):293-301.
8. Andrade PV, Lameu EB. Espessura do músculo adutor do polegar: um novo índice prognóstico em pacientes clínicos. Rev Bras Nutr Clin. 2007; 22 (1): 28-35.
9. Cobêro FE, Gomes MC, Silva AP, Bernardi JL, McLellans KC. A medida do músculo adutor do polegar está associada com indicadores antropométricos de avaliação de massa magra e de massa gorda em pacientes hospitalizados. Nutrire Rev Soc Bras Aliment Nutr. 2012;37(2):174-82.
10. Nunes FF, Fernandes SA, Bertolini CM, Rabito EI, Gottschall CB. Avaliação nutricional do paciente cirrótico: comparação entre diversos métodos. Sci Med. 2012;22(1):12-7.
12. Bragagnolo R, Caporossi FS, Dock-Nascimento DB, Aguilar-Nascimento JE. Espessura do músculo adutor do polegar: um método rápido e confiável na avaliação nutricional de pacientes cirúrgicos. Rev Col Bras Cir. 2009;36(5):371-6.
13. Freitas BJ, Mesquita LC, Teive NJ, Souza SR. Antropometria clássica e músculo adutor do polegar na determinação do prognóstico nutricional em pacientes oncológicos. Rev Bras Cancerol. 2010;56(4):415-22.
14. Pereira RA, Caetano AL, Cuppari L, Kamimura MA. Espessura do músculo adutor do polegar como preditor da força de preensão manual nos pacientes em hemodiálise. J Bras Nefrol. 2013;35(3):177-84.
15. Andrade FN, Lameu EB, Luiz RR. Musculatura adutora do polegar: um novo índice prognóstico em cirurgia cardíaca valvar. Rev SOCERJ. 2005;18(5):384-91.
16. Pereira CA, Moreno JG, Kik RM. Utilização da espessura do músculo adutor do polegar na avaliação nutricional. Ciênc Saúde. 2014;7(2):109-14. 17. Lipschitz DA. Screening for nutritional status in the elderly. Prim Care.
1994;21(1):55-67. Review.
18. World Health Organization (WHO). Obesity: preventing and managing the global epidemic. Report of a WHO Consultation on Obesity. Geneva, 3-5 June 1997. Geneva: World Health Organization; 1998.
19. Sociedade de Geriatria e Gerontologia: I Consenso Brasileiro de Nutrição e Disfagia em Idosos Hospitalizados. Barueri, SP: Minha Editora; 2011. 20. Heyland DK, Dhaliwal R, Wang M, Day AG. The prevalence of iatrogenic
underfeeding in the nutritionally ‘at-risk’ critically ill patient: Results of an international, multicenter, prospective study. Clin Nutr. 2015;34(4):659-66. 21. Sheean MP, Peterson SJ, Chen Y, Liu D, Lateef O, Braunschweig CA.
Utilizing multiple methods to classify malnutrition among elderly patients admitted to the medical and surgical intensive care units (ICU). Clin Nutr. 2013;32(5):752-7.
22. Coltman A, Peterson S, Roehl K, Roosevelt H, Sowa D. Use of 3 tools to assess nutrition risk in the intensive care unit. JPEN J Parenter Enteral Nutr. 2015;39(1):28-33.
23. Gonzalez MC, Duarte RR, Budziareck MB. Adductor pollicis muscle: reference values of its thickness in a healthy population. Clin Nutr. 2010;29(2):268-71.
24. Bocchi EA, Braga FG, Ferreira SM, Rohde LE, Oliveira WA, Almeida DR, et al. III Diretriz Brasileira de Insuficiência Cardíaca Crônica. Arq Bras Cardiol. 2009;93(1 supl 1):3-70.