Anthropometry versus subjective nutritional assessment in cancer patients
Antropometria versus avaliação subjetiva nutricional no paciente oncológico Antropometría versus evaluación subjetiva nutricional en el paciente oncológico
Juliana Milani1
Estefânia Maria Soares Pereira1 Maria Helena Barbosa1 Elizabeth Barichello1
Corresponding author Elizabeth Barichello
https://orcid.org/0000-0001-7764-032X Email: [email protected]
DOI
http://dx.doi.org/10.1590/1982-0194201800035
1Universidade Federal do Triângulo Mineiro, Uberaba, MG, Brazil.
Confl icts of interest: none.
Abstract
Objective: Compare the results of anthropometry and subjective nutritional assessment applied to cancer patients.
Methods: Cross-sectional study with patients undergoing chemotherapy between March and June 2017. The instruments applied were anthropometry (body mass index, body fat percentage, muscle mass and edema) and the Patient-Generated Subjective Global Assessment (PG-SGA). Data were entered into a Microsoft Excel® spreadsheet. Statistical analyses were performed using SPSS® version 21.0. Central tendency (mean and standard deviation), absolute frequency and corresponding percentages were measured. The analyses used the t-test and Pearson correlation, considering a signifi cance level of 5%.
Results: Of all 99 participants and based on the body mass index, 60.6% were healthy, 24.2% presented fat depletion, 51.5% had severe or moderate muscle depletion, and 87.9% had edema. According to the Patient-Generated Subjective Global Assessment, 31.3% were well-nourished participants, 37.4% moderately malwell-nourished and 31.3% severely malwell-nourished. Incompatibility of nutritional diagnosis was observed when comparing the body mass index and the Patient-Generated Subjective Global Assessment due to the high frequency of edema in the participants.
Conclusion: The results indicated that the body mass index should not be considered as the only assessment for cancer patients, requiring a complete anthropometric evaluation associated with the Patient-Generated Subjective Global Assessment.
Resumo
Objetivo: Comparar os resultados da antropometria e avaliação subjetiva nutricional aplicadas ao paciente oncológico.
Métodos: Estudo transversal com pacientes em tratamento de quimioterapia entre março e junho de 2017. Os instrumentos aplicados foram a antropometria (Índice de Massa Corporal, percentual de gordura corporal, massa muscular e edema) e a Avaliação Subjetiva Global Produzida pelo Próprio Paciente. Os dados foram digitados no programa Microsoft Excel®. As análises estatísticas foram realizadas no programa SPSS® 21.0. Realizaram-se medidas de tendência central (média e desvio-padrão), frequência absoluta e percentual. As análises ocorreram por meio do Teste t e Correlação de Pearson, adotando-se um nível de signifi cância de 5%.
Resultados: Dentre os 99 participantes, 60,6% apresentaram eutrofi a, segundo o Índice de Massa Corporal, 24,2% com depleção de gordura, 51,5% com depleção muscular grave ou moderada e 87,9% com edema. A categorização da Avaliação Subjetiva Global Produzida pelo Próprio Paciente foi de 31,3% participantes bem nutridos, 37,4% desnutridos moderadamente e 31,3% desnutridos graves. Houve incompatibilidade do diagnóstico nutricional proveniente do Índice de Massa Corporal e Avaliação Subjetiva Global Produzida pelo Próprio Paciente, em decorrência da alta frequência de edema nos participantes.
Conclusão: Os resultados apontaram que o Índice de Massa Corporal não deve ser considerado um indicador único de avaliação do paciente oncológico, necessitando-se de avaliação antropométrica completa associada à Avaliação Subjetiva Global Produzida pelo Próprio Paciente.
Resumen
Objetivo: Comparar resultados de antropometría y evaluación subjetiva nutricional aplicados al paciente oncológico.
Métodos: Estudio transversal con pacientes en tratamiento quimioterápico entre marzo y junio de 2017. Se aplicaron los instrumentos Antropometría (Índice de Masa Corporal, porcentaje de grasa corporal, masa muscular y edema) y la Evaluación Subjetiva Global Producida por el Propio Paciente. Datos introducidos en planilla Microsoft Excel®. Los análisis estadísticos fueron realizados con el programa SPSS® 21.0. Se aplicaron medidas de tendencia central (promedio y Desvío Estándar), frecuencia absoluta y porcentual. Análisis realizados mediante Test de t y Correlación de Pearson, adoptándose nivel de signifi catividad del 5%.
Resultados: De los 99 participantes, 60,6 presentó eutrofi a según el Índice de Masa Corporal, 24,2% con depleción de grasa, 51,5% con depleción muscular grave o moderada, y 87,9% con edema. La categorización de la Evaluación Subjetiva Global Producida por el Propio Paciente fue de 31,3% participantes bien nutridos, 37,4% moderadamente desnutridos y 31,3% gravemente desnutridos. Existió incompatibilidad del diagnóstico nutricional derivada del Índice de Masa Corporal y Evaluación Subjetiva Global Producida por el Propio Paciente, determinada por la alta frecuencia de edema en los participantes.
Conclusión: Los resultados expresan que el Índice de Masa Corporal no debe considerarse indicador único de evaluación del paciente oncológico, precisándose de evaluación antropométrica completa asociada a la Evaluación Subjetiva Global Producida por el Propio Paciente.
Keywords
Neoplasms; Anthropometry; Nutritional status; Malnutrition; Edema
Descritores
Neoplasias; Antropometria; Estado nutricional; Desnutrição; Edema
Descriptores
Neoplasias abdominales; Antropometría; Estado nutricional; Desnutrición; Edema
Submitted January 19, 2018 Accepted May 28, 2018
How to cite:
Introduction
Cancer is an abnormal (malignant) cell growth that can invade or spread to tissues and organs. Th is pro-cess involves metastasis when it spreads through the body. Th is evolution can happen quickly, leading to the formation of tumors (accumulation of cancer cells) or malignant neoplasms. If the tumor is classi-fi ed as benign, it is rarely considered a life-threaten-ing condition, a local mass of cells that is similar to the original tissue.(1)
Cancer has no symptoms in its early stage; how-ever the fi rst signs appear with the disease evolution and can be very distinct based on the neoplasm lo-cation. Symptoms may be classifi ed as local eff ects (ulceration), systemic symptoms (weight loss, fever, excessive tiredness, epithelial changes), symptoms of metastasis (lymphadenopathy, hepatomegaly or splenomegaly, pain or fracture of aff ected bones), and neurological symptoms.(2)
Chemotherapy, which aims to control and treat cancer, has an impact on the patients’ nutritional status. Symptoms such as nausea, vomiting, diar-rhea, constipation and anorexia are possible conse-quences. Although some drugs can minimize the eff ects of this procedure, the symptoms are still a major obstacle for patients.(3)
Nutritional status is a very important aspect, as it has a direct infl uence on the evolution of can-cer patients. Malnutrition is very frequent in these individuals, which may be a result of changes in metabolism caused by the disease and treatment, as well as reduced total intake and increased energy demand for tumor evolution.(4)
One of the evaluation instruments to determine the nutritional status is anthropometry, which in-cludes the evaluation of weight, height, edema, skin folds and circumferences. Th is instrument indicates the presence of malnutrition, eutrophy or obesi-ty. As its method of analysis, the reference values should be compatible with the population evaluat-ed to identify and quantify the nature and severity of nutritional diseases.(5)
As an instrument for cancer patient screening, the Patient-Generated Subjective Global Assessment (PG-SGA) has 98% sensitivity and 82% specifi city.
It was translated into Portuguese and validated in Brazil in 2010, demonstrating its usefulness. Its use consists in the categorization of the nutritional sta-tus and screening of the degree of required profes-sional intervention.(6)
In order to promote the recovery of cancer pa-tients, several health areas should be supported. Nutrition professionals should conduct a nutrition-al assessment and defi ne an intervention for the re-sulting diagnosis.(7)
Th erefore, the objective of this study was to compare the results of the anthropometric assess-ment and the PG-SGA applied to cancer patients.
Methods
Th is is an observational cross-sectional quantitative study with 99 patients in outpatient chemothera-py in the Triângulo Mineiro region, Minas Gerais. Data collection was conducted from March to June 2017.
Th e inclusion criteria were: cancer patients
undergoing chemotherapy in the third cycle or af-ter, of both sexes, adults over 20 years old, elderly patients who knew how to read and write for the self-applied instrument. Individuals who present-ed mental confusion were excludpresent-ed from the study, since the instrument required patient collaboration for data collection.
According to the procedures requested by the Research Ethics Committee, formal contact with the institution and participants occurred only af-ter approval by the committee no. 1.974.551. Data collection started after the signature of an informed consent form. Guidance was provided on the bene-fi ts of the scientibene-fi c study to the society.
Participants were contacted in the outpatient clinic and after agreement with the study terms; each participant was individually taken to a pri-vate room so that the instruments were applied by a qualifi ed professional, spending on average 60 minutes.
Th e following methods were used to collect
The procedures were applied according to the
Anthropometry Manual.(8) Height was measured
with a stadiometer (WCS®, 2016, Paraná, Brazil), weight was measured with a wireless digital scale (Bioland®, 2016, São Paulo, Brazil), a caliper (CESCORF® Innovare, 2016, Porto Alegre, Brazil) was used to measure skin folds, and a meter tape (WCS®, 2016, Paraná, Brazil) was used to measure the circumference of limbs.
The BMI classification was based on cut-off points, according to the World Health Organization
(WHO)(9) which is considered appropriate for
healthy adult subjects. For the elderly, the reference values were those proposed by Lipschit.(10)
For the participants who were unable to walk, calculation formulas were used to estimate their height and weight.(11,12)
Regarding body composition, the Petroski Protocol was used(13), which evaluated four skin folds:
medial axillary, supra iliac, medial calf and thigh for female participants, and subscapular, triceps, supra iliac, and medial calf for male participants. Data were calculated by providing the body density value. This value was applied to a final formula that determined the fat percentage. The ideal fat percentage was clas-sified according to sex and age of each participant.(14)
Mid-arm circumference (MAC) and mid-arm muscle circumference (MAMC) (triceps fold) were considered in the analysis of muscle mass, whose values were used in a formula that provides the per-centage of muscle mass (without bone correction), according to the percentile by age and sex.(15,16)
Godet signal was used for edema assessment, which consists of palpation with intense pressure for one or two seconds, classifying the degree ac-cording to a scale.(17)
PG-SGA is divided into two parts; the first is answered by the patient. Issues such as weight changes, gastrointestinal symptoms and changes in food intake were addressed. The results provid-ed two types of classification: nutritional status and scores that identify four levels of nutritional risk, allowing different interventions for each of them.(6)
Participants were taken to a nutrition clinic in the Triângulo Mineiro region, Minas Gerais, ac-cording to the nutritional status diagnosed.
Data obtained from the application of both instruments were carefully described and analyzed with the development of a database in Microsoft Excel®, in a double-typing process to avoid inconsis-tency. Then, the variables were submitted to statisti-cal analyses and testing using the Statististatisti-cal Package for the Social Sciences - SPSS Statistics® 21.0.
In the statistical analysis, absolute frequen-cy and percentage measurements were used. The t-test was performed for the bivariate analysis of categorical variables, considering a significance level of 5%.
Pearson correlation was performed for the quan-titative variables, considering ρ=1 perfect positive correlation between the two variables, ρ=-1 perfect negative correlation between the two variables, and
ρ=0 meaning that the two variables do not
linear-ly depend on one another. The level of significance was 5%.
Results
Of the 99 cancer patients undergoing chemother-apy, 56.6% were male. The age group of 20 to 60 years included 40.4% of the participants. Regarding the types of cancer, gastrointestinal cancer ed a higher frequency (36.4%), and 24.2% present-ed metastasis.
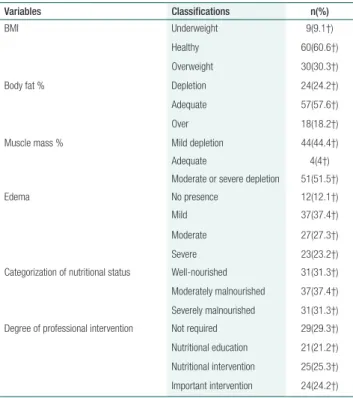
Of all participants, 60.6% were healthy, that is, proper total body weight in relation to height, fol-lowed by 30.3% of overweight and 9.1% of under-weight participants. Regarding body fat percentage, 57.6% were classified as adequate, 24.2% presented depletion and 18.2% were above the recommend-ed level. For the percentage of muscle mass, 51.5% had severe or moderate depletion, 44.4% presented mild and 4% adequate depletion. The edema classi-fication was as follows: 37.4% of the patients with mild edema, 27.3% with moderate edema, 23.2% had severe edema, and 12.1% were free from this condition (Table 1).
‘severe-ly malnourished.’ Regarding the degree of profes-sional intervention, 29.3% did not need nutritional intervention at the moment, but reassessment was required, 21.2% lacked individual and family nutri-tional education, 25.3% required nutrinutri-tional inter-vention, and 24.2% required significant nutritional intervention to control symptoms.
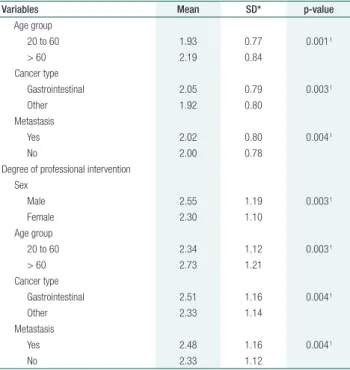
Table 2 shows the comparison of mean values from the results of anthropometry and PG-SGA ac-cording to the variables of sex, age group, type of cancer and metastasis. For BMI, and percentage of fat and muscle mass, the lowest mean values were for males, individuals aged over 60 years, with gas-trointestinal cancer and the presence of metastasis. Regarding the edema severity and the PG-SGA scores for the categorization of the nutritional sta-tus and degree of intervention, higher mean values were obtained for men, elderly, with gastrointesti-nal cancer and metastasis.
Table 3 shows the correlation between anthro-pometry and the PG-SGA. The percentage of mus-cle mass (ρ=0.68, p=0.001) and presence of edema (ρ=0.61, p=0.003) can be considered as moderate-ly positive. The percentage of body fat (ρ=0.41,
Table 1. Nutritional status according to anthropometry and the
Patient-Generated Subjective Global Assessment
Variables Classifications n(%)
BMI Underweight 9(9.1†)
Healthy 60(60.6†)
Overweight 30(30.3†)
Body fat % Depletion 24(24.2†)
Adequate 57(57.6†)
Over 18(18.2†)
Muscle mass % Mild depletion 44(44.4†)
Adequate 4(4†)
Moderate or severe depletion 51(51.5†)
Edema No presence 12(12.1†)
Mild 37(37.4†)
Moderate 27(27.3†)
Severe 23(23.2†)
Categorization of nutritional status Well-nourished 31(31.3†)
Moderately malnourished 37(37.4†)
Severely malnourished 31(31.3†) Degree of professional intervention Not required 29(29.3†)
Nutritional education 21(21.2†)
Nutritional intervention 25(25.3†)
Important intervention 24(24.2†)
†Each relative frequency was calculated using the total sample (99 subjects)
Table 2. Comparison of mean values from the results of anthropometry and the Patient-Generated Subjective Global Assessment, according to the variables of sex, age group, type of cancer and metastasis
Variables Mean SD* p-value
BMI Sex
Male 21.4 0.61 0.004t
Female 23.0 0.55
Age group
20 to 60 20.8 0.60 0.001t
> 60 19.5 0.56
Cancer type
Gastrointestinal 21.7 0.56 0.002t
Other 22.4 0.61
Metastasis
Yes 21.3 0.53 0.004t
No 22.4 0.61
Body fat % Sex
Male 18.4 0.68 0.003t
Female 20.7 0.59
Age group
20 to 60 20.1 0.65 0.004t
> 60 17.3 0.60
Cancer type
Gastrointestinal 17.8 0.54 0.004t
Other 20.3 0.69
Metastasis
Yes 19.2 0.71 0.003t
No 19.5 0.63
Muscle mass % Sex
Male 64.6 0.53 0.002t
Female 66.0 0.62
Age group
20 to 60 65.8 0.59 0.003t
> 60 63.8 0.49
Cancer type
Gastrointestinal 65.2 0.61 0.001t
Other 65.3 0.50
Metastasis
Yes 64.8 0.52 0.002t
No 66.7 0.70
Edema Sex
Male 2.05 0.89 0.004t
Female 2.46 0.99
Age group
20 to 60 2.26 0.98 0.003t
> 60 2.35 0.89
Cancer type
Gastrointestinal 2.37 1.02 0.003t
Other 2.14 0.83
Metastasis
Yes 2.31 0.97 0.003t
No 2.21 0.93
Categorization of nutritional status Sex
Male 2.09 0.81 0.004 t
Female 1.88 0.76
p=0.001) presented a weak positive correlation. BMI presented the lowest positive correlation
(ρ=0.06, p=0.003), which shows a low degree of
correlation between the methods.
Discussion
This study had a predominance of male participants (56.6%), which is similar to a study with 70 sub-jects (54.3%).(18) Regarding nutritional status, male
participants presented higher severity. This repre-sentativeness may be associated with their resistance to seeking health services, a behavior rooted in our society and still frequent.(19,20)
Regarding age, 40.4% were aged 20 to 60 years, in disagreement with most studies. The inclusion criterion of knowing how to read and write was
de-terminant, since most illiterates correspond to the elderly. In this study, the higher the age group, the worse their nutritional status. According to the lit-erature, about 70% of deaths caused by cancer oc-cur among elderly people aged 65 or over.(21)
Regarding the type of cancer, gastrointestinal cancer presented a higher frequency (36.4%) and the most severe results in anthropometry and the PG-SGA. This type of cancer causes inappetence, malabsorption and poor digestion, leading to com-plications in the nutritional situation, such as malnu-trition, anemia and changes in body composition.(22)
Another study used the PG-SGA with gastro-intestinal cancer patients, and 98% of the cases required intervention, with improved nutritional status in 54% of these individuals.(23)
As for metastasis, 24.2% of the participants pre-sented this condition, predisposing them to a great-er nutritional risk, thus indicating greatgreat-er attention and care required in this aspect.(24)
Some researchers have reported that insufficient food intake, type of cancer, disease progression, and chemotherapy are responsible for the loss of fat and muscle mass.(18)
This study found 24.2% of patients with body fat depletion and 51.4% with severe or moderate muscle mass depletion, in agreement with the esti-mated prevalence of malnutrition in cancer patients
from 40 to 80%.(7) Another study detected
malnu-trition in 60% of patients based on arm circumfer-ence, and 73.3% using muscle circumference.(25)
The presence of edema affects the accuracy of nutritional diagnosis through BMI. Only 12.1% of the patients did not present the condition: 37.4% were mild, 27.3% moderate, and 23.2% severe. Chemotherapy increases the occurrence of edema, so a positive correlation was observed in more ad-vanced stages of the disease.(26)
In the BMI assessment, most participants were classified as healthy (60.6%). In a study with 50 breast cancer patients, about 50% of the sample presented obesity according to the BMI.(27)
In the PG-SGA categorization, 31.3% were clas-sified as ‘well-nourished,’ 37.4% as ‘moderately mal-nourished,’ and 31.3% as ‘severely malnourished. In a prospective study with 416 cancer patients, 47%
Table 3. Correlation between anthropometry and the Patient-Generated Subjective Global Assessment
Variables Categorization of nutritional status
ρ p-value
BMI 0.06 0.003 ρ
Body fat % 0.41 0.001ρ
Muscle mass % 0.68 0.001ρ
Edema 0.61 0.003ρ
ρ – Pearson correlation
Variables Mean SD* p-value
Age group
20 to 60 1.93 0.77 0.001 t
> 60 2.19 0.84
Cancer type
Gastrointestinal 2.05 0.79 0.003 t
Other 1.92 0.80
Metastasis
Yes 2.02 0.80 0.004 t
No 2.00 0.78
Degree of professional intervention Sex
Male 2.55 1.19 0.003 t
Female 2.30 1.10
Age group
20 to 60 2.34 1.12 0.003 t
> 60 2.73 1.21
Cancer type
Gastrointestinal 2.51 1.16 0.004 t
Other 2.33 1.14
Metastasis
Yes 2.48 1.16 0.004 t
No 2.33 1.12
*SD – Standard deviation; t-test
were ‘well-nourished,’ 29% were ‘moderately mal-nourished,’ and 24% were ‘severely malmal-nourished,’ with higher mortality in these individuals.(28)
Discrepancies were observed in the nutritional status evaluated by both instruments, 9.1% were considered malnourished according to the BMI, but 37.4% as ‘moderately malnourished’ and 31.3% as ‘severely malnourished’ according to PG- SGA.
In a study with 96 elderly individuals, the BMI indicated 29.2% of underweight individuals, while with PG-SGA, the percentage of malnutrition (moderately and severely malnourished) reached 43.8%.(29)
The inconsistent prognosis between the BMI and PG-SGA methods for cancer patients undergo-ing chemotherapy is due to the presence of edema, body composition assessment, and calculation of involuntary weight loss, underestimating the BMI diagnosis.(30)
One of the limitations of this study was its sample size, which is associated with the inclusion criterion of knowing how to read and write, a fac-tor that was required for the self-applied part of the PG-SGA.
Conclusion
The results of this study showed an incompatibility in the nutritional diagnosis from the BMI and the PG-SGA, due to the high frequency of edema in the participants. Finally, BMI should not be considered as a single indicator of cancer patient evaluation, requiring a complete anthropometric evaluation as-sociated with the PG-SGA.
Collaborations
Milani J participated in the study design and proj-ect, and data analysis and interpretation. Pereira EMS and Barbosa MH collaborated with the rel-evant critical review of its intellectual content. Barichello E collaborated with the study design and project, data analysis and interpretation, and final approval of the version to be published.
References
1. Malzyner A, Caponero R. Câncer e prevenção. São Paulo: Editores; 2013. p. 117.
2. O’dell MD, Stubblefield MW. Cancer rehabilitation principles and practice. New York: Demos Medical; 2009. p. 983.
3. Lee HO, Lee JJ. Nutritional intervention using nutrition care process in a malnourished patient with chemotherapy side effects. Clin Nutr Res. 2015;4(1):63–7.
4. Barbosa LB, Fortes RC, Toscano BA. Impacto de fórmulas enterais imunomoduladoras em pacientes com câncer do trato gastrointestinal enteral: uma revisão da literatura. J Health Sci Inst. 2017;35(1):49–54. 5. Vitolo MR. Nutrição: da gestação ao envelhecimento. 2a ed. revisada e
ampliada. Rio de Janeiro: Rúbio LTDA; 2014.
6. Gonzalez MC, Borges LR, Silveira DH, Assunção CF, Orlandi SP. Validação da versão em português da avaliação subjetiva global produzida pelo paciente. Rev Bras Nutr Clin. 2010;25(2):102–8. 7. Cardoso DH, Muniz RM; Schwartz E. Cuidados paliativos na assistência
hospitalar: a vivência de uma equipe multiprofissional. Texto Contexto Enferm. 22(4):1134-41.
8. Manual de antropometria. Rio de Janeiro: Instituto Brasileiro de Geografia e Estatística (IBGE); 2013
9. Obesity: Preventing and Managing the Global Epidemic. Geneva: Organização Mundial de Saúde (OMS); 2000.
10. Lipschitz DA. Screening for nutritional status in the elderly. Prim Care. 1994;21(1):55–67.
11. Chumlea WC, Guo S, Roche AF, Steinbaugh ML. Prediction of body weight for the nonambulatory elderly from anthropometry. J Am Diet Assoc. 1988;88(5):564–8.
12. Chumlea WC, Guo SS, Steinbaugh ML. Prediction of stature from knee height for black and white adults and children with application to mobility-impaired or handicapped persons. J Am Diet Assoc. 1994;94(12):1385–8.
13. Petroski EL. Desenvolvimento e validação de equações generalizadas para a estimativa da densidade corporal em adultos. Santa Maria: UFSM; 1995.
14. 1986 Annual Meeting of the American College of Sports Medicine. Phys Sportsmed. 1986;14(4):56-8.
15. Frisancho A. Anthropometric standards for the assessment of growth and nutritional status. Clin Nutr. 1991;10(2):131–2.
16. Cuppari L. Guia de nutrição: nutrição clínica no adulto. 2nd ed. São Paulo: Manole; 2005. p. 578.
17. Barros AL. Anamnese e exame físico: avaliação diagnóstica de enfermagem no adulto. 3a ed. Porto Alegre: Artmed; 2015. p. 472. 18. Dallacosta FM, Carneiro TA, Velho SF, Rossoni C, Baptistella AR.
Avaliação nutricional de pacientes com câncer em atendimento ambulatorial. Cogitare Enferm. 2017;4(22):e51503.
19. Vale IA, Bergmann RB, Duval PA. Avaliação e indicação nutricional em pacientes oncológicos no início do tratamento quimioterápico. Rev Bras Cancerol. 2015;61(4):367–72.
21. de Brito DT, Macedo E, Agra G, Sousa AT, Pimentel ER, Costa MM. Neoplastic wounds: socio-demographic, clinical and therapeutic profile of patients with skin cancer. J Nurs UFPE. 2017;11 Suppl. 7:2916–28.
22. Oliveira FP, Santos A, Viana MS, Alves JL, Pinho NB, Reis PF. Perfil nutricional de pacientes com câncer de cavidade oral em pré-tratamento antineoplásico. Rev Bras Cancerol. 2015;61(3):253–9. 23. Zhang L, Lu Y, Fang Y. Nutritional status and related factors of patients
with advanced gastrointestinal cancer. Br J Nutr. 2014;111(7):1239– 44.
24. Poziomyck AK, Cavazzola LT, Coelho LJ, Lameu EB, Weston AC, Moreira LF. Métodos de avaliação nutricional preditores de mortalidade pós-operatória em pacientes submetidos à gastrectomia por câncer gástrico. Rev Col Bras Cir. 2017; 44(5):482–90.
25. Hackbarth L, Machado J. Estado nutricional de pacientes em tratamento de câncer gastrointestinal. Rev Bras Nutr Clin. 2015;30(4):271–5.
26. Thoresen L, Frykholm G, Lydersen S, Ulveland H, Baracos V, Prado CM, et al. Nutritional status, cachexia and survival in patients with advanced colorectal carcinoma. Different assessment criteria for nutritional status provide unequal results. Clin Nutr. 2013;32(1):65–72.
27. Figueiredo AC, Ferreira RN, Duarte MA, Coelho AF, Cabral KM. Prevalência da obesidade em mulheres tratadas de câncer de mama numa UNACOM em Juiz de Fora. Rev Bras Mastologia. 2016;26(4):169–74.
28. Khoshnevis N, Ahmadizar F, Alizadeh M, Akbari ME. Nutritional assessment of cancer patients in Tehran, Iran. Asian Pac J Cancer Prev. 2012;13(4):1621–6.
29. Santos CA, Ribeiro AQ, Rosa CO, Ribeiro RC. Influência do gênero e do tipo de tratamento nos parâmetros nutricionais de idosos em oncologia. Rev Bras Cancerol. 2014;60(2):143–50.