ABSTRACT
Objective: To evaluate the correlation between thickness of the muscle adductor pollicis and anthropometric measurements, body mass index and Subjective Global Assessment in the nutritional assessment of
surgical patients. Methods: The study population comprised patients
admitted to the general and reconstructive surgery unit of a university hospital in the city of Vitória (ES), Brazil. The inclusion criteria were
patients evaluated in the first 48 hours of admission, aged ≥20
years, hemodynamically stable, with no edema or ascites. Data analysis was performed using the software Statistical Package for
Social Science 21.0, significance level of 5%. Results: The sample
consisted of 150 patients that were candidates to surgery, mean age of 42.7±12.0 years. The most common reasons for hospitalization
were surgical procedures, gastrintestinal diseases and neoplasm. Significant association was observed between thickness of adductor
pollicis muscle and Subjective Global Assessment (p=0.021) and body mass index (p=0.008) for nutritional risk. Significant correlation
was found between thickness of adductor pollicis muscle and arm muscle circumference, corrected arm muscle area, calf circumference and body mass index. There were no significant correlations between thickness of adductor pollicis muscle and triceps skinfold and age.
Conclusion: The use of thickness of adductor pollicis muscle proved to be an efficient method to detect malnutrition in surgical patients and it should be added to the screening process of hospitalized patients, since it is easy to perform, inexpensive and noninvasive.
Keywords: Nutrition assessment; Malnutrition; Thumb/anatomy & histology; Muscles/anatomy & histology; Surgical procedures operative/ methods
RESUMO
Objetivo: Avaliar a correlação entre a medida da espessura do músculo adutor do polegar com medidas antropométricas, índice de massa corporal e Avaliação Subjetiva Global no diagnóstico nutricional de
pacientes cirúrgicos. Métodos: Participaram do estudo pacientes
internados em uma unidade de cirurgia geral e reparadora de um hospital universitário de Vitória (ES), Brasil. Os critérios de inclusão foram pacientes avaliados nas primeiras 48 horas de internação,
idade ≥20 anos hemodinamicamente estáveis, sem edema ou ascite.
A análise dos dados foi realizada pelo software Statistical Package
for Social Science, versão 21.0, com nível de significância de 5%. Resultados: Compuseram a amostra 150 pacientes candidatos à cirurgia, com média de idade de 42,7±12,0 anos. Os motivos de
internação mais comuns foram procedimentos cirúrgicos, doenças do trato gastrointestinal e neoplasias. Observou-se associação significativa entre a espessura do músculo adutor do polegar com a Avaliação
Subjetiva Global (p=0,021) e com o índice de massa corporal para risco nutricional (p=0,008). Foram encontradas correlações significativas
entre a espessura do músculo adutor do polegar com circunferência muscular do braço, área muscular do braço corrigida, circunferência da panturrilha e índice de massa corporal. Não foram encontradas
correlações significativas entre a espessura do músculo adutor do polegar com prega cutânea triciptal e idade. Conclusão: O uso da espessura do músculo adutor do polegar mostrou-se um método eficiente na detecção de desnutrição em pacientes cirúrgicos e deve ser acrescentado ao processo de triagem de pacientes hospitalizados, uma vez que é de fácil execução, baixo custo e não invasivo.
Descritores: Avaliação nutricional; Desnutrição; Polegar/anatomia &
histologia; Músculos/anatomia & histologia; Procedimentos cirúrgicos
operatórios/métodos
Thickness of the adductor pollicis muscle in
nutritional assessment of surgical patients
Espessura do músculo adutor do polegar na avaliação nutricional de pacientes cirúrgicos
Katarina Papera Valente1, Naira Marceli Fraga Silva1, Amanda Barcelos Faioli1,
Marina Abelha Barreto1, Rafael Araújo Guedes de Moraes2, Valdete Regina Guandalini1
1 Universidade Federal do Espírito Santo, Vitória, ES, Brazil. 2 Hospital Universitário Cassiano Antonio Moraes, Vitória, ES, Brazil.
Corresponding author: Valdete Regina Guandalini – Avenida Marechal Campos, 1468 – Maruípe – Zip code: 29040-090 – Vitória, ES, Brazil – Phone: (55 27) 3335-7017 – E-mail: valdete.guandalini@ufes.br Received on: Nov 25, 2015 – Accepted on: Jan 22, 2016
INTRODUCTION
To date, there is still no accepted consensus in clinical practice as to which diagnostic tool is capable of
satisfactorily identifying malnutrition in adults.(1) In
its latest update, the European Society for Clinical
Nutrition and Metabolism (ESPEN) determined two alternatives for the diagnosis of malnutrition. The first takes into account only the body mass index (BMI), and the second considers the percentage of weight loss, BMI and loss of fat-free mass. This highlights the need for and the importance of body composition and anthropometric evaluations in identifying malnutrition, including patients presenting low weight or not within
parameters for thinness index.(2)
The Inquérito Brasileiro de Avaliação Nutricional Hospitalar (IBRANUTRI) [Brazilian Inquiry for Hospital Nutritional Evaluation] assessed 4,000 inpatients at public hospitals in large Brazilian cities, and showed 1,924 patients (48.1%) presented with some degree of malnutrition. Among these malnourished patients, 504 (12.6%) were severely malnourished, and 1,420 (35.5%)
were moderately malnourished.(3) In Brazil, an average
of 15 to 20% of inpatients are malnourished upon admission, due to several factors, such as underlying disease, poor social and economic conditions, and
healthcare system deficiencies.(4)
There are various methods to evaluate inpatients, including dietary history, anthropometric and biochemical data, clinical history and physical examination, with specific limitations, advantages, and disadvantages. Anthropometric data are frequently used for nutritional assessment of inpatients, although there is no gold
standard that is completely accurate.(4) Among the
conventional anthropometric measurements, assessment of the adductor pollicis muscle thickness (APMT) is an important variable to assess the muscle compartment, since it is considered an objective, quick, and low-cost
measurement, besides being noninvasive.(5)
The measurement of the adductor pollicis muscle of the dominant hand is always superior relative to the adductor pollicis muscle of the non-dominant hand, due to the fact of its being the first to suffer the influence of daily activities, which are preferably performed by this limb. Therefore, it is better to measure the non-dominant hand, for the most activated muscles tend to present atrophy more rapidly in a situation of malnutrition, and may not faithfully represent the nutritional status.(6)
Melo et al.,(7) carried out a study with 151 patients
who are candidates for elective surgical procedures in order to estimate the prevalence of malnutrition using the APMT. The classic anthropometric measurements
were used, along with percentage of weight loss and measurement of the adductor pollicis muscle in both hands. In this study, a high prevalence of malnutrition was found, besides a significant association between the nutritional diagnosis as per the APMT and the measurement of the arm circumference (AC), triceps skinfold (TS), and BMI, showing that the adductor muscle appears as a good method for diagnosing muscle depletion and malnutrition in surgical patients.
Associated with the anthropometric measurements, screening and subjective nutritional evaluation are used to detect patients at risk of malnutrition upon admission. Among them, especially the Subjective Global Assessment (SGA) and the Nutritional Risk Screening stand out. These protocols should be applied and used in the first hours of intervention, seeking an early detection of malnutrition, so that intervention might begin quickly, improving the patient’s general status and thus decreasing expenses related to hospital stay. SGA classifies the patients as well- nourished, moderately malnourished, and severely malnourished; on the other hand, the Nutritional Risk Screening classifies the
priority of nutritional intervention.(8) For this study,
we chose to work with SGA, since it is considered the gold-standard procedure in nutritional assessment
of inpatients.(9) However, adequate training of all
observers who desire to use it is crucial, because its precision depends on the capacity of the observer to detect significant nutritional alterations by means of subjective evaluation.(10)
Faced with this and the many nutritional evaluation methods that already exist, further studies are needed, with simple and practically noninvasive methods, such as the APMT, in order to implement new tools that might accelerate the identification of nutritional risk.
OBJECTIVE
To evaluate the correlation between thicknesses of adductor pollicis muscle with anthropometric measurements, body mass index, and Subjective Global Assessment in the nutritional diagnosis of surgical patients.
METHODS
This is a cross-sectional study carried out between August 2014 and March 2015, at a General and Reconstructive Surgery Unit of a university hospital located in the city of Vitória (ES). This study is a part of the research project entitled “Malnutrition and associated factors at
approved by the Research Ethics Committee of the
Universidade Federal do Espírito Santo, under number CAAE: 27954014.0.0000.5060.
The participants of the study were all patients admitted to the two units abovementioned, who could be evaluated within the first 24 and 48 hours after admission and who met the following inclusion criteria: aged ≥20 years; hemodynamically stable; no edema and ascites; and agreed to participate by signing the Informed Consent Form (ICF).
For nutritional status evaluation, the following parameters were used: conventional anthropometric data, APMT, and SGA.
Anthropometric evaluation
The patients included in the study answered a structured questionnaire to gather social and demographic data, followed by SGA and the collection of anthropometric data by previously trained evaluators, based on a pilot study. The clinical history was collected from the medical records in patient´s charts.
For the nutritional status evaluation, current weight, height, calf circumference (CC), AC, TS, arm muscle circumference (AMC), corrected arm muscle area (CAMA), and BMI.
For the anthropometric evaluation, data were collected regarding weight (in kilograms) and height (in meters), according to the techniques proposed by Lohman et
al.(11) Weight was checked using a tetrapolar Tanita®
bioimpedence scales, with maximum capacity for 150kg and precision of 100g. For the measurement of height,
the AlturExata® portable stadiometer, with bilateral
scales in millimeters and capacity for use of 0.35 to 2.13m was employed. For bed-ridden patients, reclined height and estimated body weight were considered, by
means of the equation by Chumlea et al.,(12) for both
genders and cycle of life.
AMC was obtained based on the values of AC and TS, by means of equation 1:
AMC (cm)=AC (cm)–πx [TS(mm/10)] Equation 1
Corrected arm muscle area was calculated based on equation 2, corrected for each gender.
CAMA (cm2)=[AC (cm)–πx[TS(mm/10)]2/4π Equation 2
For the classification of AMC and CAMA, the
percentage values proposed by Frisancho were used.(13)
Calf circumference was determined using an inelastic tape measure horizontally around the maximum
circumference.(14) Values below 31cm were considered
indicative of reduced muscle mass.(15)
Body mass index was calculated based on the formula current weight (kg)/height2 (m). The adults were classified
as per the references of the World Health Organization,(16)
considering the following intervals: low weight, if
BMI<18.5kg/m2; eutrophic, if BMI≥18.5kg/m2 to
24.9kg/m2; overweight, if BMI>24.9kg/m2 to 29.9kg/m2;
and obesity if BMI>29.9kg/m2. The elderly were
classified according to the cutoff points of Lipschitz,(17)
in which low weight was BMI≤22kg/m²; eutrophic if BMI was between 22kg/m² and 27kg/m²; and overweight, if BMI>27kg/m².
Adductor pollicis muscle thickness
Adductor pollicis muscle thickness was measured while the patient sitting down, the arm flexed at approximately 90°, the forearm and the hand supported on the knee. The patients were instructed to keep their
hands relaxed. A Cescorf® (Porto Alegre, RS, Brazil),
skinfold caliper was used with continuous pressure of
10g/mm2 to pinch the adductor muscle at the vertex of
an imaginary triangle formed by the extension of the
thumb and the index finger.(18) The procedure was done
on the non-dominant hand three times, and the mean was used as measurement of the APMT. To classify the
values obtained, the proposal of Bragagnolo et al.,(5)
specific for surgical patients, was used; it considers values of eutrophy for APMT of the non-dominant hand >13.1mm and of malnutrition, values <13.1mm.
Subjective Global Assessment
The SGA was initially proposed to assess the nutritional status of inpatients during the postoperative period, and has been used in several different clinical settings, considered as gold standard for this type of evaluation. It may be considered a marker of health status, in which the diagnosis of severe malnutrition is an indicator of severity of disease and not only an index of nutrient deficit.(9)
The SGA focuses on aspects of the clinical history, such as weight changes, intake alterations, presence of gastrintestinal symptoms, and alterations in functional capacity, besides evaluating, in the physical examination, subcutaneous fat and muscle mass losses, presence of sacral edema, ankle edema, and ascites. The results are expressed in three categories: well-nourished patients (SGA “A”), with suspect/moderate malnutrition (SGA “B”), or severe malnutrition (SGA “C”).
Statistical analysis
The data obtained were stored in an electronic
statistical analysis was performed using the Statistical Package for Social Science software, version 21.0. To describe the study variables, measurements of central tendency (mean) and of dispersion (standard deviation) for the continuous variables, and percentages for the categorical variables were used. Normality of the distribution of the variables was assessed by the Kolmogorov-Smirnov test. All variables presented normal distribution. For data analysis, SGA was classified based on the nutritional risk in well-nourished patients (SGA A) and in malnourished patients (SGA
B and C). Pearson’s χ2 test was used to analyze the
differences between the categorical variables, as well as the correlation among the continuous variables. The multiple linear regression analysis (stepwise method) was applied to determine which independent variables were associated with the APMT (dependent variable).
RESULTS
Of 150 patients evaluated, 110 (73.3%) were adults and 40 (26.7%) elderly, with mean ages of 42.7±12.0 years. As to gender, 84 (56.0%) were male. There was a predominance of the mulatto ethnic group, represented by 67 (44.6%) individuals. As to the clinical diagnosis and surgical indication, we draw attention to neoplasms, which affected 37 patients (24.6%), followed by 36 (24.0%) patients with gastrintestinal and pancreatic diseases, and 35 (23.3%) patients with hepatobiliary diseases. Other variables that characterize the sample are presented on table 1.
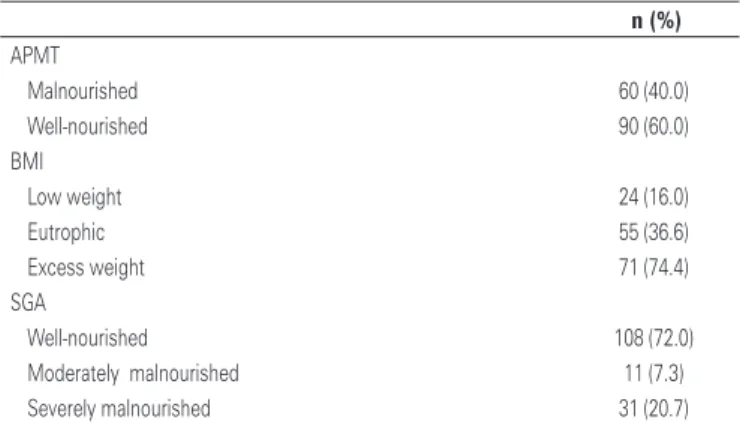
A predominance of excess weight (74.4%) was noted by the BMI, and of well-nourished by the SGA (72.0%). When considering the APMT, there was also a predominance of well-nourished (60.0%) (Table 2).
Table 1. Characterization of the sample according to life stage, gender, ethnicity, and clinical diagnosis
Variable n (%)
Stage of life
Adult 110 (73.3)
Elderly 40 (26.7)
Gender
Male 84 (56.0)
Female 66 (44.0)
Ethnicity
Mulatto 67 (44.6)
White 60 (40.0)
Black 17 (11.4)
Yellow 6 (4.0)
Diagnosis
Neoplasims 37 (24.6)
GI/pancreatic diseases 36 (24.0) Hepatobiliary diseases 35 (23.3) Inguinal hernia 20 (13.3) Cardiovascular diseases 11 (7.3) Pulmonary diseases 6 (4.0)
Others 5 (3.3)
GI: gastrintestinal.
Table 2. Nutritional status of the sample according to body mass index, Subjective Global Assessment, and adductor pollicis muscle thickness
n (%) APMT
Malnourished 60 (40.0)
Well-nourished 90 (60.0) BMI
Low weight 24 (16.0)
Eutrophic 55 (36.6)
Excess weight 71 (74.4)
SGA
Well-nourished 108 (72.0) Moderately malnourished 11 (7.3) Severely malnourished 31 (20.7)
APMT: adductor pollicis muscle thickness; BMI: body mass index; SGA: Subjective Global Assessment.
Table 3 presents the distribution of nutritional status according to the adductor pollicis muscle thickness of the non-dominant hand, relative to gender, stage of life,
Table 3. Frequency of nutritional status as per adductor pollicis muscle thickness
of the non-dominant hand, according to gender, stage of life, body mass index, and diagnosis
APMT
Total
n (%) p value Malnourished
(<13.1 mm) n (%)
Eutrophic (>13.1 mm)
n (%) Gender
Male 23 (27.4) 61 (72.6) 84 (100) 0.000* Female 37 (56.0) 29 (44.0) 66 (100) Stage of life
Adult 46 (41.8) 64 (58.2) 110 (100) 0.523 Elderly 14 (35.0) 26 (65.0) 40 (100) BMI
With risk 17 (65.4) 9 (34.6) 26 (100) 0.004* Without risk 43 (34.7) 81 (65.3) 124 (100) SGA
With risk 37 (34.3) 71 (65.7) 108 (100) 0.026* Without risk 23 (54.8) 19 (45.2) 42 (100) Diagnosis
Neoplasm 16 (43.2) 21 (56.8) 37 (100) 0.288 Gastrintestinal
diseases
15 (41.7) 21 (58.3) 36 (100)
Hepatobiliary diseases 12 (34.3) 23 (65.7) 35 (100) Inguinal hernia 6 (30.0) 14 (70.0) 20 (100) Cardiovascular
diseases
8 (72.7) 3 (27.3) 11 (100)
Pulmonary diseases 2 (33.3) 4 (66.7) 6 (100) Other 1 (20.0) 4 (80.0) 5 (100)
*Pearson’s χ2; p<0.05*. APMT: adductor pollicis muscle thickness; BMI: body mass index; SGA: Subjective Global
variables, the APMT was associated with gender, AMC, CAMA, and BMI. There were significant differences between males and females, but not among adults and the elderly.
Melo et al.,(7) found malnutrition in 31.8% of male
patients and in 68.2% of females. These data corroborate
with our study and other similar studies(18-20) in which
men presented greater anthropometric measurements. Adductor pollicis muscle thickness is capable of estimating muscle mass loss and it has some advantages, such as it is easy, quick, and cheap to measure, besides eliminating the use of formulas to calculate the muscle
compartment.(19) Some studies(5,21-23) demonstrated its
use in many clinical conditions and treatments, with significant results regarding nutritional diagnosis, correlation with anthropometric variables, lean mass reduction, and association in prognosis of complications
in the postoperative period and during hospital stay.(6,24)
The results found here present evidence that the APMT can be used as an indicator of nutritional status and of muscle mass reduction, since it remained associated with other anthropometric measurements that evaluated the same compartment. That is the case of AMC and CAMA, in addition to ratifying the importance of its use in the preoperative period to identify the nutritional risk and early nutritional intervention.
The APMT can indicate changes in body composition, and therefore, be useful in detecting early alterations related to malnutrition and evaluate the nutritional recovery.(20)
A study carried out by Bragagnolo et al.(25) assessed
124 patients submitted to major gastrintestinal tract surgeries and concluded that the APMT can be used as a predictor of postoperative complications and mortality, besides being an important tool to assess the nutritional status of surgical patients. This study further evaluated the association between APMT and SGA, which is considered a gold standard method in the nutritional assessment of hospitalized patients. The results showed a significant correlation between them, although the SGA did not remain in the final model by regression analysis. AMC was the variable that most influenced in the measurement of the APMT in this population, after adjustments.
A study by da Silva et al.(26) assessed the nutritional
status of 43 oncology patients, aged over 18 years, considering APMT, BMI, TS, AC, CAMA, and the palmar prehension strength of the patients. There was little agreement among the parameters used, such as APMT and SGA, but significant differences were found among the values of AC, CAMA, APMT, and palmar prehension strength, indicating that these parameters
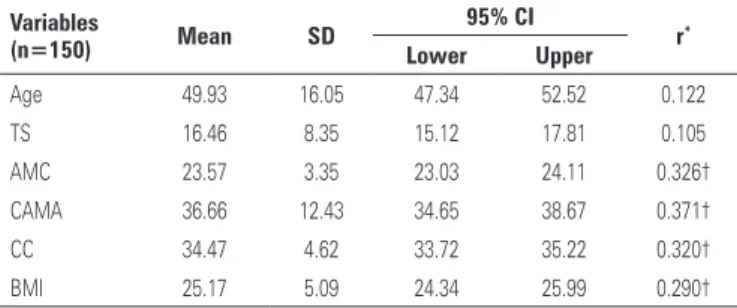
Table 4. Correlation between the thickness of the adductor pollicis muscle and classic nutritional status variables
Variables
(n=150) Mean SD
95% CI
r*
Lower Upper
Age 49.93 16.05 47.34 52.52 0.122 TS 16.46 8.35 15.12 17.81 0.105 AMC 23.57 3.35 23.03 24.11 0.326† CAMA 36.66 12.43 34.65 38.67 0.371† CC 34.47 4.62 33.72 35.22 0.320† BMI 25.17 5.09 24.34 25.99 0.290†
* Pearson’s correlation test; † p<0.01. SD: standard deviation; 95% CI: 95% confidence interval; TS: triciptal skinfold; AMC: arm muscle circumference; CAMA: corrected arm muscle area; CC: calf circunference; BMI: body mass index.
Table 5. Multiple linear regression for the dependent variable of adductor pollicis muscle thickness
APMT
β Standard error p value Gender 0.300 0.795 0.001
AMC -0.392 0.249 0.036
CAMA 0.491 0.061 0.004
BMI 0.305 0.092 0.004
R2=0.238. APMT: adductor pollicis muscle thickness; AMC: arm muscle circumference; CAMA: corrected arm muscle area;
BMI: body mass index.
BMI, SGA, and diagnosis. As to APMT, eutrophy proved more frequent in men and malnutrition in women, with a significant difference (p=0.004). A significnat association was found between the nutritional status defined by the APMT with the SGA (p=0.021) and with the BMI, with nutritional risk (p=0.007). Stage of life, BMI with no nutritional risk, and diagnosis showed no association with the nutritional status indicated by the measurement of the APMT.
The correlations between APMT and age, TS, AMC, (CAMA), CC, and BMI were analyzed. Significant correlations were found, although weak, between APMT and the anthropometric, AMC, (CAMA), CC, and BMI variables. No significant correlations were found between APMT and TS and age (Table 4).
Table 5 displays the multiple linear regression results. In the final model, the variables gender, AMC, CAMA, and BMI remained, explaining 24% of APMT. AMC was the variable that most influenced our measurement, even after the adjustment for gender, CAMA, and BMI, with a reduction of 0.392mm.
DISCUSSION
may be useful in the identification of well-nourished and mal-nourished patients, as long as the cutoff points are defined.
Different results were found by Gonzalez et al.,(27)
who analyzed 361 surgical patients. After the analysis for confounding variables, the nutritional status evaluated by the SGA was a determinant factor in the measurement da APMT, with a significant reduction of its values in moderately and severely malnourished patients. Similar finding were identified by Bragagnolo et al.(5) and Caporossi et al.(22)
Poziomyck et al.(28) studied 74 adult and elderly
patients submitted to resection of gastrintestinal tumors, with the objective of evaluating which would be the most sensitive nutritional assessment method in this group. They used SGA, APMT, BMI, AC, AMC, percentage of weight loss, and TS, in addition to biochemical tests. The results revealed that the APMT and SGA are reliable in predicting mortality, and can be used in clinical practice.
There is consensus in the literature as to the ease of application, low cost, location of the muscle evaluated, and the several applications in which APMT is possible. However, it should be pointed out that the absence of a reference standard for the various clinical conditions, gender, and life cycles can generate results that are not representative of the true nutritional status, clinical condition and hydration status of the patient.
Atrophy of the APMT reflects loss of productive life. The presence of malnutrition and the underlying disease may cause reduced daily activities and possible catabolism, resulting in progressive decrease of the
APMT.(22)
According to Gonzalez et al.,(20) it is important to
point out that investigations that identify discrepant values relative to the references indicated in literature may be based on error, at the time of pinching the correct anatomic landmark, in calibration of the skinfold caliper, as well as in the variability among raters of the same study.
Among the limitations of this study, it should be highlighted the fact of being a cross-sectional study carried out in a single unit, with high turnover and specific characteristics. Moreover, it did not consider the biochemical alterations and it was an observer-dependent research.
CONCLUSION
The results found indicated that measurement of adductor pollicis muscle thickness can be included in the nutritional triage of surgical patients, aiming to speed up and facilitate the nutritional diagnosis of these patients,
and to detect protein depletion. The adductor pollicis muscle thickness proved to be a reliable measurement, which can be implemented in the process of nutritional assessment, for being capable of identifying the risk of malnutrition, along with other variables and nutritional evaluation methods. Nevertheless, further investigations are required to identify the reasons for different findings in the literature, especially as to the cutoff point to assess surgical patients, taking into account the age range and gender.
REFERENCES
1. Jensen GL, Mirtallo J, Compher C, Dhaliwal R, Forbes A, Grijalba RF, Hardy G, Kondrup J, Labadarios D, Nyulasi I, Castillo Pineda JC, Waitzberg D; International Consensus Guideline Committee. Adult starvation and disease-related malnutrition: a proposal for etiology-based diagnosis in the clinical practice setting from the International Consensus Guideline Committee. JPEN J Parenter Enteral Nutr. 2010;34(2):156-9.
2. Cederholm T, Bosaeus I, Barazzoni R, Bauer J, Van Gossum A, Klek S, et al. Diagnostic criteria for malnutrition - An ESPEN Consensus Statement. Clin Nutr. 2015;34(3):335-40.
3. Waitzberg DL, Caiaffa WT, Correia MI. Hospital malnutrition: the Brazilian national survey (IBRANUTRI): a study of 4000 patients. Nutrition. 2001;17(7-8): 573-80.
4. Raslan M, Gonzalez MC, Torrinhas RS, Ravacci GR, Pereira JC, Waitzberg DL. Complementarity of Subjective Global Assessment (SGA) and Nutritional Risk Screening 2002 (NRS 2002) for predicting poor clinical outcomes in hospitalized patients. Clin Nutr. 2011;30(1):49-53.
5. Bragagnolo R, Caporossi FS, Dock-Nascimento DB, Aguilar-Nascimento JE. Espessura do músculo adutor do polegar: um método rápido e confiável na avaliação nutricional de pacientes cirúrgicos. Rev Col Bras Cir. 2009; 36(5):371-6.
6. Andrade PV, Lameu EB. Espessura do músculo adutor do polegar: um novo índice prognóstico em pacientes clínicos. Rev Bras Nutr Clin. 2007;22(1):28-35. 7. Melo CY, Silva SA. Músculo adutor do polegar como preditor de desnutrição
em pacientes cirúrgicos. Arq Bras Cir Dig. 2014;27(1):13-7.
8. Duarte JP, Paludo J, Lemos JR, Moreira TR. Variação na prevalência de risco nutricional em indivíduos hospitalizados conforme cinco protocolos de triagem nutricional. Sci Med (Porto Alegre). 2014;24(1):26-32.
9. Detsky AS, McLaughlin JR, Baker JP, Jonhson N, Whittaker S, Mendelson R, et al. What is subjective global assessment of nutritional status? J Parenter Enteral Nutr. 1987;11(1):8-13.
10. Barbosa-Silva MC, de Barros AJ. Avaliação nutricional subjetiva: parte 2. Revisão de suas adaptações e utilizações nas diversas especialidades clínicas. Arq Gastroenterol. 2002;39(4):248-52. Review.
11. Lohman TG, Roche AF, Martorell R. Anthropometric standardization reference manual. Champaign: Human Kinetics; 1988.
12. Chumlea WC, Guo S, Roche AF, Steinbaugh ML. Prediction of body weight for the nonambulatory elderly from anthropometry. J Am Diet Assoc. 1988; 88(5):564-8.
13. Frisancho AR. Anthropmetric standarts for the assessment of growth and nutrition status. Michigan: University of Michigan Press; 1990. p.189. 14. Blackburn GL, Bistrian BR, Maini BS, Schlamm HT, Smith MF. Nutritional and
metabolic assessment of the hospitalized patient. J Parenter Enteral Nutr. 1977;1(1):11-22.
15. World Health Organization (WHO). Physical Status: the use and interpretation of anthropometry: report of a WHO expert committee. Geneva: WHO; 1995. [WHO technical report series; 854].
global epidemic: report of a WHO consultation. Geneva: WHO; 2000. [WHO technical report series; 894].
17. Lipschitz DA. Screening for nutritional status in the elderly. Prim Care. 1994; 21(1):55-67. Review.
18. Lameu EB, Gerude MF, Corrêa RC, Lima KA. Adductor pollicis muscle: a new anthropometric parameter. Rev Hosp Clin Fac Med Sao Paulo. 2004;59(2):57-62. 19. Lameu EB, Gerude MF, Campos AC, Luiz RR. The thickness of the adductor
pollicis muscle reflects the muscle compartment and may be used as a new anthropometric parameter for nutritional assessment. Curr Opin Clin Nutr Metab Care. 2004;7(3):293-301. Review.
20. Gonzalez MC, Duarte RR, Budziareck MB. Adductor pollicis muscle: reference values of its thickness in a healthy population. Clin Nutr. 2010;29(2):268-71. 21. Rosa TC, Arakaki DG, Arruda EC, Rodrigues AS, Raslan M, Freitas KC. Adductor
pollicis muscle: potential anthropometric parameter in hospitalized individuals. Acta Scientiarum. Health Sciences. 2015;37(2):111-17.
22. Caporossi FS, Caporossi C, Borges Dock-Nascimento D, de Aguilar-Nascimento JE. Measurement of the thickness of the adductor pollicis muscle as a predictor of outcome in critically ill patients. Nutr Hosp. 2012;27(2):490-5.
23. Oliveira DR, Frangella VS. Músculo adutor do polegar e força de preensão palmar: potenciais métodos de avaliação nutricional em pacientes ambulatoriais com acidente vascular encefálico. einstein (São Paulo). 2010;8(4):467-72. 24. Andrade FN, Lameu EB, Luiz RR. Musculatura adutora do polegar: um novo índice
prognóstico em cirurgia cardíaca valvar. Rev SOCERJ. 2005;18(5):384-91. 25. Bragagnolo R, Caporossi FS, Borges Dock-Nascimento D, de
Aguilar-Nascimento JE. Handgrip strength and adductor pollicis muscle thickness as predictors of postoperative complications after major operations of the gastrointestinal tract. E Spen Eur E J Clin Nutr Metab. 2011;6(1):e21-e26. 26. da Silva JB, Maurício SF, Bering T, Correia MI. The relationship between
nutritional status and the Glasgow prognostic score in patients with cancer of the esophagus and stomach. Nutr Cancer. 2013;65(1):25-33.
27. Gonzalez MC, Pureza Duarte RR, Orlandi SP, Bielemann RM, Barbosa-Silva TG. Adductor pollicis muscle: A study about its use as a nutritional parameter in surgical patients. Clin Nutr. 2015;34(5):1025-9.