Technology
L. Gelman
1, I. Petrunin
2, I. K. Jennions
3, and M. Walters
41,2School of Engineering, Cranfield University, Cranfield, Bedfordshire, MK43 0AL, UK
[email protected] [email protected]
3IVHM Centre, Cranfield University, Cranfield, Bedfordshire, MK43 0AL, UK
4Rolls-Royce, Derby, DE24 8BJ
ABSTRACT
The chipped gear tooth appearance is normally a result of the initial fatigue damage in a tooth. It is a special gear failure mode and differs from local fatigue damage of gear teeth. Therefore, diagnosis of chipped gear tooth requires a special investigation. Recently, the novel gear damage diagnosis technology, based on the wavelet transform was proposed and successfully applied for diagnosis of the early stage fatigue damage. The proposed technology is applied in this study for diagnostics of a partly-missing (chipped) tooth in a gear of the Machine Fault Simulator (MFS). The advanced automatic technology for the time synchronous averaging of the raw gear vibrations has been employed in this study; this technology does not require speed data. An advanced decision making technique based on use of the likelihood ratio allowed for the continuous correct diagnosis of chipped teeth throughout the recorded data without false alarms and missed detections. The likelihood ratio was obtained using the Gaussian models of the data for classes “undamaged” and “damaged”.
1. INTRODUCTION
The vibration-based gear diagnostics has been the most popular monitoring technique because of its high effectiveness. Multiple methods for vibration diagnostics of local fatigue damage in gears (i.e. pitting, etc.) are proposed and investigated including statistical analysis of raw vibration signal analysis techniques (Maynard, 1999, Lebold, McClintic, Campbell, Byington, & Maynard, 2000, Lei, Zuo, He, & Zi, 2010), spectral analysis (Yesilyurt, 2003), demodulation methods (McFadden, 1986, Gelman et al., 2005, Combet, Gelman, Anuzis, & Slater, 2009), residual analysis (Combet at al., 2009, Wang, Ismail, &
Golnaraghi, 2001), adaptive filtering (Brie, Tomczak, Oehlmann, & Richard, 1997, Lee & White, 1998, Combet & Gelman, 2009), use of AR model (Wang & Wong, 2002), inverse filtering (Lee & Nandi, 2000, Endo & Randall, 2007), time frequency (TF) analysis (Wang & McFadden, 1993, Forrester, 1996, Choy, Polyshchuk, Zakrajsek, Handschuh, & Townsend, 1996, Wang & McFadden, 1996, Loutridis, 2006) and time-scale analysis (Wang et al., 2001, Halima, Shoukat Choudhuryb, Shaha, & Zuoc, 2008, Dalpiaz, Rivola, & Rubini, 2000, Lin & Zuo, 2003, Combet, Gelman, & LaPayne, 2012).
The majority of the these methods are based on the residual signal as classically obtained after the removal of the mesh harmonic components from the gear vibration signal processed using the time synchronous average (TSA) (Stewart, 1977, McFadden, 1987).
Although the chipped gear tooth (i.e. partly missing tooth) normally appears as a result of the initial fatigue damage in a tooth, it is a special gear failure mode and differs from local fatigue damage of gear teeth. Therefore, normally, diagnosis of chipped gear tooth requires a special investigation.
The literature search revealed a limited number of publications in which the detection of the chipped tooth was investigated using advanced signal processing techniques, such as joint amplitude and frequency demodulation analysis (Feng, Liang, Zhang, & Hou, 2012), bispectral binary images (Jiang, Liu, Li & Tang, 2011), and empirical mode decomposition (Zamanian & Ohadi, 2011).It is believed that this topic should be further investigated by evaluation of suitability of novel damage diagnosis techniques for diagnosis of the chipped gear teeth.
Recently, the novel gear damage diagnosis technology, based on the wavelet transform, was proposed and successfully applied for diagnosis of the fatigue damage, micro-pitting (i.e. 0.3-0.7% relative pitting size) in gear
teeth (Gryllias, Gelman, Shaw & Vaidhianathasamy, 2010). However, the full capabilities of this technology are not yet investigated. While being effective for early diagnosis of fatigue damage in teeth, the technology was not investigated for diagnosis of the chipped gear teeth.
Therefore, the main aim of the present paper is to investigate diagnostics of partly missing (chipped) teeth using the novel wavelet technology. The novelty of the paper is investigation for the first time of diagnosis of the chipped tooth using the novel wavelet technology.
2. NOVELDIAGNOSTICFEATUREBASED ON THE
WAVELETTRANSFORM
The wavelet transform (WT) can be presented in the form (Yan, Miyamoto & Brühwiler, 2006):
1
*,
t
b
,
W a b
x t
dt
a
a
(1)wherex(t)is a time domain signal.ψis the mother wavelet function,ais the scale variable,bis the time shift, * denotes the complex conjugation.
In this study, the complex Morlet wavelet function is used:
1
2 2
2,
b c
c f f b
j f t t f b
t
e
e
e
f
where fb is the bandwidth parameter, fc is the central
frequency, j is the imaginary unit.
It is known that local gear faults produce impacts; frequencies of these impacts are localized in a specific band. The normalized wavelet transform integrated in this band is proposed (Gryllias et al., 2010) as the instantaneous diagnostic feature.
2,
,
BW a b
df
y
B
where
W a b
,
denotes the magnitude of the wavelet transform; B = [fmin, fmax] is the frequency band for theintegration; fmin, is the minimum frequency of the band B;
fmaxis the maximum frequency of the bandB.
The choice of the integration bandwidth B needs to be adapted according to the frequencies of impact produced by a fault. The average feature, the mean of the instantaneous feature in the mesh period, is used in this study.
The bandwidth parameterfbcan be presented as follows:
2
,
2
B c bt f
f
The dimensionless product
t f
B c corresponds to the number of oscillations of the Morlet wavelet within its half power time-width estimated at the -3 dB level. This product defines the shape of the wavelet, and thus the balance between the time and frequency resolutions of the wavelet transform.In order to maximize the effectiveness of diagnostics of local tooth fault, the time resolution of the wavelet analysis should match with the duration of the fault-induced impact. Normally, the impact duration is of the order of the mesh period. Therefore, the dimensionless window length parameter
t f
B c was set so in order that the time-widthat
Bof the analyzing wavelet at scale
a
matches with the meshing periodT
m of the gear for all scales. This implies thatat
B
t f
B cf
T
m for all frequencies within the bandwidth B = [fmin, fmax]. By considering the middlefrequency only, this condition may be approximated as:
min max
1
2
B c mt f
T
f
f
.3. THENOVELWAVELETTECHNOLOGY FOR THE
DIAGNOSTICS OF THEGEARLOCALDAMAGE
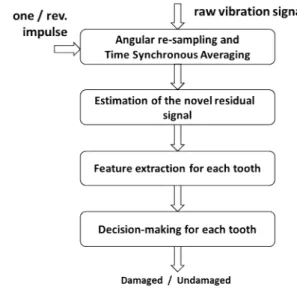
A schematic of the damage diagnosis technology, based on the novel residual signal use is shown in Fig. 1.
however, in some cases the speed can be extracted from the vibration data without need of the tachometer signal. In the present paper, the advanced automatic technology for the time synchronous averaging of the raw gear vibrations (Combet & Gelman, 2007) has been employed; this technology does not require speed data. The angular re-sampling is performed automatically using the mesh components of the vibration data (Combet & Gelman, 2007).
The TSA is then applied to the re-sampled signal. In order to estimate the signal duration required for the TSA, the dependency of the ratio between the averaged variance of the TSA signal and the variance of the re-sampled vibration signal versus the number of averages (Combet & Gelman, 2007) was estimated. The length of the raw signal required for the TSA was estimated as the number of averages at which the ratio of variances begins to demonstrate relatively low attenuation (Fig. 2).
The novel residual signal is obtained from the TSA signal by removing not only mesh harmonics but also low order shaft harmonics. This approach first introduced in (Combet et al., 2009) improves diagnostics effectiveness as low order shaft harmonics normally have relatively high amplitudes and, therefore, could mask impacts created by local gear faults.
The decision making procedure is based on the likelihood ratio estimated from training data with a priori known classification. During the testing, values of the likelihood ratio are accumulated and compared to the threshold in order to make the final decision.
Figure 2. Estimation of the relative variance change of the TSA signal vs realization size.
4. THEEXPERIMENTDESCRIPTION
The experimental set up is based on the MFS test rig (Fig. 3) equipped with a one-stage gearbox. Two pinions were used for the test: a pinion with no damage on teeth and pinion with a chipped tooth (Fig. 4). The test was performed at a constant motor shaft speed of 3000 rpm-which
corresponds to 1200 rpm on the tested gear shaft. The load on the gear was applied by a magnetic brake system with the torque value of 0.68 N*m.
Vibrations from three channels for axial, horizontal and vertical directions were recorded using 3 Endevco 7251A-100 accelerometers installed on the gearbox case. Signal conditioning was performed using an Endevco 133 signal conditioner and analogue active anti-aliasing filters Kemo PocketMaster 1600. The cut-off frequency of filters was set at 10 kHz. The speed estimation was obtained using a laser speed sensor and reflective tape, attached to the driven wheel of the belt transmission (Fig. 3). All signals were recorded using National Instruments data acquisition card NI DAQ-6062E at 25 kHz sampling frequency.
The whole data set is represented by 7 records of approximately 3 minutes duration each with 10 minute intervals between them for damaged and undamaged gears.
Figure 3. The test rig (MFS).
Figure 4. The gear with partly missing tooth. The length of realizations for the residual signal estimation using the TSA was selected as 20s according to Fig. 2. Therefore, the whole data set of 7 records contains 64 realizations. For 20s realization, 1200 rpm shaft speed, 18 teeth and 25 kHz sampling frequency each tooth is represented by approximately 70 samples of the vibration data. While this number looks reasonably large for the
Active filters Signal conditioner
considered diagnostics task it might be important to consider the influence of this number on diagnostics efficiency in the future.
5. DATAPROCESSING ANDDIAGNOSTICS
The wavelet transform of the novel residual signal was computed for a number of realizations in order to evaluate the frequency bandwidth of impacts produced by the fault. The window length parameter
t f
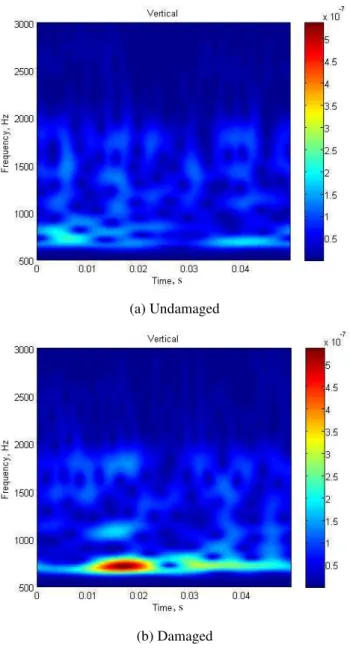
B c that matches the mesh period at the middle frequency of the bandwidth was selected.Wavelet transform Eq. (1) of the novel residual signal for bandwidth 500 Hz-3 kHz averaged over nine realizations for data from vertical channel are shown in Fig. 5.
(a) Undamaged
(b) Damaged
Figure 5. The averaged wavelet transforms of the novel residual signal for undamaged (a) and damaged (b) gears. It can be seen from Fig. 5 the increased wavelet coefficients for damaged gear at frequency around 700 Hz and time 0.011-0.023s, which generated by the chipped tooth. A channel selection for diagnostics was performed based on the separation of diagnostic features between data from undamaged and damaged gears. The separation was estimated as the maximum value of the Fisher criterion (Webb, 1999) over the rotation period using all available data (i.e. 64 realizations for undamaged gear and 64 realizations for damaged gear). The Fisher criterion values were estimated from the expression as follows:
2
2 2
1 2 1 2
F
m
m
,where
m m
1,
2 and
12,
22 are mean values and variances of diagnostic features from each realization for damaged and undamaged gears, respectively.The same methodology was used for the wavelet bandwidth selection. Results of the analysis are shown in Table 1.
Bandwidth 1: 10 Hz-10 kHz
Bandwidth 2: 500 Hz-3 kHz
Bandwidth 3: 600 Hz-850 Hz
Axial 2.7 7.8 20.3
Horizontal 2.2 5.8 14.4
Vertical 3.3 7.3 37.2
Table 1. Values of the Fisher criterion.
As the result of the analysis, the vertical direction of accelerometer and the narrowest bandwidth (600 Hz – 850 Hz) were selected for diagnostics.
In addition to removing the gear mesh harmonics, the first eight shaft orders were removed from the TSA for estimation of the residual signals.
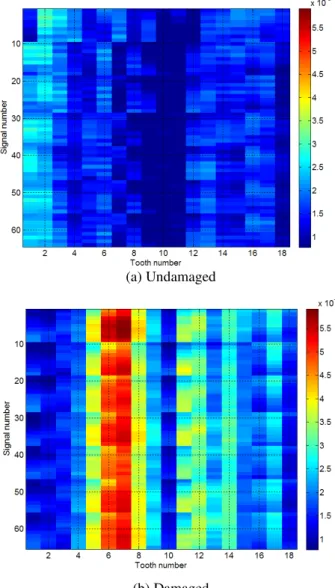
Plots of the diagnostic features for each tooth of the pinion using the data from the vertical channel for undamaged and damaged gears are shown in Fig 6 (a) and (b) respectively. One can see that for the damaged gear tooth 7 (i.e. the chipped tooth) has higher feature values.
, s
(a) Undamaged
(b) Damaged
Figure 6. The diagnostic features vs. tooth number and realization number.
The training data for the damage diagnosis were selected as follows:
Class “damaged” was presented by 32 diagnostic features of damaged tooth 7 in 32 gear vibration signals, i.e. every other realization of the total amount of 64 realizations.
Class “undamaged” was presented by diagnostic features of all 18 teeth of 32 realizations for the undamaged gear and diagnostic features of remaining 17 teeth (i.e. except the tooth number 7) of 32 realizations for the damaged gear; in total, 1120 diagnostic features were used for the “undamaged class”.
Observing the uni-modal shape of diagnostic features distributions, the likelihood ratio was obtained using the
Gaussian models of the data for classes “undamaged” and “damaged”. To build the models, the corresponding values of mean and variance were estimated for each class. Models of the probability density functions of the diagnostic features and the logarithm of the likelihood ratio are shown in Fig. 7.
The likelihood ratio is estimated using the selected damaged and undamaged training data. The testing data are processed using the accumulated likelihood ratio given by:
1
1
1 ,..., | log
,..., |
| |
log log ,
| |
acc
N dam N
N undam N
i dam i dam i
i
i undam i undam i
p x x
p x x
p x p x
p x p x
where p x
i|
dam
and p x
i|
undam
are the conditionalprobability density functions of the diagnostic features for damagedωdam and undamagedωundamclasses; i=1,…, Nacc,
Naccis the number of accumulations.
The decision making rule for damage diagnosis using the sequence of realizations is as follows:
,
b
thr
where thrbis the threshold for the accumulated likelihood
ratio.
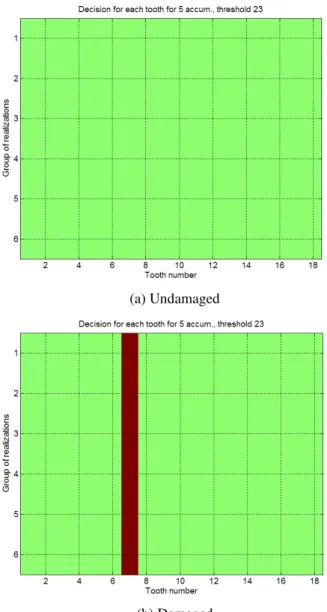
The test was performed using the test data represented by another half (32 realizations) of the whole data set (64 realizations). The values of thrb = 23 and Nacc = 5 were
obtained by optimization of the damage diagnosis procedure using the minimum of the total error probability as the optimization criterion.
Figure 7. The Gaussian models of the probability density functions for classes “undamaged” (top), “damaged”
(a) Undamaged
(b) Damaged
Figure 8. Diagnosis results for undamaged (a) and damaged (b) gears. The green colour is for decision “undamaged”, the
red colour is for decision “damaged”.
The performed diagnosis has shown no false alarms for the undamaged pinion and stable damage diagnosis of tooth 7 for the damaged pinion (Fig. 8).
6. CONCLUSIONS
The wavelet technology for gear fatigue damage diagnosis was successfully applied for the first time for diagnostics of the partly missing tooth. Experimental investigation was performed using the Machine Fault Simulator.
The angular re-sampling of raw vibration data is performed automatically using the mesh components of the vibration data. The residual signal is obtained from the TSA signal by removing not only mesh harmonics but also low order shaft harmonics.
The main parameters of the technology were optimized using the total error probability as the optimization criterion. The missing tooth has been detected and continuously diagnosed throughout the whole experimental test without false alarms and missed detections using the advanced decision making technique based on the likelihood ratio. The likelihood ratio was obtained using the Gaussian models of the data for classes “undamaged” and “damaged”. The time required for a single damage diagnosis was equal to 1 min 40s which is equivalent to 5 realizations of the residual signal.
Investigation of the technology effectiveness at different shaft speeds, loads, sampling frequencies and for gears with multiple teeth damages is planned in the near future. The possibility to use historical data from the gear with damage for technology calibration is also considered for a future work.
REFERENCES
Brie, D., Tomczak, M., Oehlmann, H., & Richard, A. (1997). Gear Crack Detection by Adaptive Amplitude and Phase Modulation.Mechanical Systems and Signal Processing, vol. 11(1), pp. 149–167.
Choy, F. K., Polyshchuk, V., Zakrajsek, J. J., Handschuh, R. F., & Townsend, D. P. (1996). Analysis of the Effects of Surface Pitting and Wear on the Vibration of a Gear Transmission System. Tribology International, vol. 29(1), pp. 77–83.
Combet, F., & Gelman, L. (2007). An Automated Methodology for Performing Time-Synchronous Averaging of a Gearbox Signal Without Speed Sensor.
Mechanical Systems and Signal Processing, vol. 21(6), pp. 2590-2606.
Combet, F., & Gelman, L. (2009). Optimal Filtering of Gear Signals for Early Damage Detection Based on the Spectral Kurtosis. Mechanical Systems and Signal Processing, vol. 23(3), pp. 652–668.
Combet, F., Gelman, L., Anuzis, P., & Slater, R. (2009). Vibration detection of local gear damage by advanced demodulation and residual techniques. Proc. IMechE, vol. 223 Part G: J. Aerospace Engineering, pp.507-514. Combet, F., Gelman, L., & LaPayne, G. (2012). Novel Detection of Local Tooth Damage in Gears by the Wavelet Bicoherence. Mechanical Systems and Signal Processing, vol. 26, pp. 218-228.
Dalpiaz, G., Rivola, A., & Rubini, R. (2000). Effectiveness and Sensitivity of Vibration Processing Techniques for Local Fault Detection in Gears. Mechanical Systems and Signal Processing, vol. 14(3), pp. 387–412. Endo, H., & Randall, R. B. (2007). Enhancement of
Autoregressive Model Based Gear Tooth Fault Detection Technique by the Use of Minimum Entropy Deconvolution Filter. Mechanical Systems and Signal Processing, vol. 21(2), pp. 906–919.
Feng, Z., Liang, M., Zhang, Y. & Hou, S. (2012). Fault Diagnosis for Wind Turbine Planetary Gearboxes via Demodulation Analysis Based on Ensemble Empirical Mode Decomposition and Energy Separation.
Forrester, B. D. (1996). Advanced Vibration Analysis Techniques for Fault Detection and Diagnosis in Geared Transmission Systems. Ph. D. dissertation. Swinburne University of Technology, Melbourne, Australia.
Gelman, L., Zimroz, R., Birkel, J., Leigh-Firbank, H., Simms, D., Waterland, B., & Whitehurst, G. (2005). Adaptive Vibration Condition Monitoring Technology for Local Tooth Damage in Gearboxes. Insight Int. J. Non-Destructive Testing and Condition Monitoring, vol. 47(8), pp. 461–464.
Gryllias, K. C., Gelman, L., Shaw, B. & Vaidhianathasamy, M. (2010). Local Damage Diagnosis in Gearboxes Using Novel Wavelet Technology.Insight, vol. 52(8), pp. 437-441.
Halima, E. B., Shoukat Choudhuryb, M. A. A., Shaha, S. L., & Zuoc, M. J. (2008). Time Domain Averaging Across all Scales: a Novel Method for Detection of Gearbox Faults. Mechanical Systems and Signal Processing, vol.22(2), pp.261–278.
Jiang, L., Liu, Y., Li, X. & Tang, S. (2011). Using Bispectral Distribution as a Feature for Rotating Machinery Fault Diagnosis.Measurement, vol. 44, pp. 1284-1292.
Lebold, M., McClintic, K., Campbell, R., Byington, C., & Maynard, K. (2000). Review of Vibration Analysis Methods for Gearbox Diagnostics and Prognostics.
Proc. of the 54th Meeting of the Society for Machinery Failure Prevention Technology, Virginia Beach, VA, May 1-4, 2000, p. 623-634.
Lee, J. Y., & Nandi, A. K. (2000). Extraction of Impacting Signals Using Blind Deconvolution. Journal of Sound and Vibration, vol. 232(5), pp. 945–962.
Lee, S. K., & White, P. R. (1998). The Enhancement of Impulsive Noise and Vibration Signals for Fault Detection in Rotating and Reciprocating Machinery.
Journal of Sound and Vibration, vol. 217(3), pp. 485– 505.
Lei, Y., Zuo, M. J., He, Z., & Zi, Y. (2010). A multidimensional hybrid intelligent method for gear fault diagnosis. Expert Systems with Applications, vol. 37 (2), pp. 1419–1430.
Lin, J., & Zuo, M. J. (2003). Gearbox Fault Diagnosis Using Adaptive Wavelet Filter. Mechanical Systems and Signal Processing, vol. 17(6), pp. 1259–1269.
Loutridis, S. J. (2006). Instantaneous Energy Density as a Feature for Gear Fault Detection. Mechanical Systems and Signal Processing, vol. 20(5), pp. 1239–1253. Maynard, K. P. (1999). Interstitial Processing: The
Application of Noise Processing to Gear Fault Detection. International Conference on Condition Monitoring, University of Wales Swansea, April 12-15, pp. 77-86.
McFadden, P. D. (1986). Detecting Fatigue Cracks in Gears by Amplitude and Phase Demodulation of the Meshing Vibration.Journal of Vibration, Acoustics, Stress, and Reliability in Design, vol. 108, pp. 165-170.
McFadden, P. D. (1987). Examination of a Technique for the Early Detection of Failure in Gears by Signal Processing of the Time Domain Average of the Meshing Vibration. Mechanical Systems and Signal Processing, vol. 1(2), pp. 173–183.
Stewart, R. M. (1977). Some Useful Data Analysis Techniques for Gearbox Diagnostics.Institute of Sound and Vibration Research, Paper MHM/R/10/77.
Wang, W. Q., Ismail, F., & Golnaraghi, M. F. (2001). Assessment of Gear Damage Monitoring Techniques Using Vibration Measurements. Mechanical Systems and Signal Processing, vol. 15(5), pp. 905–922. Wang, W. J., & McFadden, P. D. (1993). Early Detection of
Gear Failure by Vibration Analysis—I. Calculation of the Time-Frequency Distribution. Mechanical Systems and Signal Processing, vol. 7(3), pp. 193–203.
Wang, W. J. & McFadden, P. D. (1996). Application of Wavelets to Gearbox Vibration Signals for Fault Detection. Journal of Sound and Vibration, vol. 192 (5), pp. 927-939.
Wang, W., & Wong, A. K. (2002). Autoregressive Model-Based Gear Fault Diagnosis. ASME Journal of Vibration and Acoustics, vol. 124, pp. 172–179. Webb, A. (1999). Statistical pattern recognition. London:
Arnold.
Yan, B. F., Miyamoto, A. & Brühwiler, E. (2006). Wavelet Transform-Based Modal Parameter Identification Considering Uncertainty, Journal of Sound and Vibration, vol. 291, pp. 285–301.