Ernest Greene
Laboratory for Neurometric Research, Department of Psychology, University of Southern California, Los Angeles, CA, USA; e-mail: [email protected]
R. Todd Ogden
Department of Biostatistics, Columbia University, New York, NY, USA; e-mail: [email protected]
Received 1 May 2013, in revised form 2 August 2013; published online 14 August 2013.
Abstract. Shape patterns were displayed with simultaneous brief lashes from a light-emitting diode array. Flash durations in the microsecond range and luminous intensities were adjusted to vary the degree of successful shape recognition. Four experiments were conducted to test whether Bloch’s law would apply in this task. Bloch’s law holds that for very brief lashes the perceptual threshold is determined by the total number of photons being delivered, i.e., there is reciprocity of intensity and duration. The present results did not ind that effectiveness of lashes was based on the total quantity of photons, as predicted by Bloch’s law. Additionally, the evidence points to a visual mechanism that has ultra-high temporal precision that either registers the rate of photon lux or the duration of lashes.
Keywords: shape recognition, retina, lash duration, lash intensity, perceptual threshold, Bloch’s law.
1 Introduction
There has been substantial progress in understanding how visual information is encoded by the ret-ina, yet a number of mysteries remain. One issue that has received relatively little attention is how extremely brief events are processed. It has been known for over 150 years that the contents of a
com-plex scene can be perceived if they are illuminated with a brief lash of light. For example, in 1871,
Rood used a method that had been developed by Wheatstone (1834) to measure the duration of an electric spark. He was able to generate a single spark that lasted for less than 1 ms and could clearly see the letters on a page from the brief illumination that it provided.
A number of studies have conirmed that image content can be registered and identiied with very brief displays. Thorpe, Fize, and Marlot (1996) have shown that respondents can register the
pres-ence of an animal in a complex scene with 94% accuracy with only 20 ms of exposure. Similarly,
with that brief exposure respondents can distinguish with the same level of accuracy whether a scene contains an animal or a transportation vehicle (Van Rullen & Thorpe, 2001). Thurgood, Whitield, and Patterson (2011) used brief lashes from a bank of white light-emitting diodes (LEDs) to backlight a liquid crystal display, making the images visible with exposures as short as 1 ms. They found that
respondents could identify photos of animals with 96% accuracy when they were presented alone, and with 83% accuracy if they were embedded within a background scene. In prior work from this labora
-tory, the mean level of recognition for an inventory of shape outlines was 85% with 50-ms lash dura
-tions, and 35% of the shapes were identiied by all of the respondents, i.e., providing 100% recognition
of that subset (Greene & Ogden, 2012).
It is generally believed that with very brief lashes the ability to register and encode the image content is determined by the total number of photons that the lash delivers. The quantity of photons appears to control the size of the photoreceptor response, and this provides for or triggers additional
sustained neural response that allows for encoding of image content. The perceptual counterpart to this persistent neural activity has been variously described as iconic memory (Neisser, 1967),
short-term visual storage (Haber & Standing, 1969), visual persistence (Long, 1980), and visible persistence (Coltheart, 1980). Either explicitly or implicitly, these models assume that the quantity of photons that
is delivered by a brief stimulus event is suficient to activate or elicit neuronal responses that allow for
processing of image content.
The concept that biological impact of a brief lash is determined by the aggregate of photons could
be traced to the 19th-century work of Bunsen and Roscoe (1855). These investigators pioneered a ield
brief lash was directly proportional to the quantity of photons. Put another way, the inluence is based
on the total “dose” of photons. Brindley (1952) claimed that this principle is valid for judgments of
equal brightness with durations that ranged from about 400 ns to 150 ms.
It was Bloch (1885), however, who irst advanced this principle as it relates to vision. He proposed
that the absolute threshold for perception of a lash is determined by the total quantity of photons in the lash as long as the duration of the lash is suficiently brief. Below a certain “critical duration” there would be reciprocity of lash intensity and duration, i.e., intensity duration would equal a constant. This has come to be known as Bloch’s law.
Strong support for Bloch’s law was provided by Graham and Margaria (1935), who reported that for stimuli having a small area the threshold perception is constant for durations in the 1–100 ms
range. As discussed below, a number of other reports have supported this inding for diverse threshold
discriminations.
We are not, however, aware of any tests of Bloch’s law with respect to discrimination or
recogni-tion of shape patterns with lash durarecogni-tions shorter than 5 ms, and prior results from the present labora -tory seem to be at odds with this “law.” These studies (Greene, 2006; 2007a, b, c, d; 2008; Greene & Ogden, 2012) examined the ability to encode shape patterns displayed with 50 or 100 ms lashes from an array of LEDs. Some of the combinations of intensity and duration allowed for successful recogni
-tion in the 75%–85% range even when the total amount of light in the lashes differed by a factor of
four.
Further, an unpublished experiment tested the level of successful recognition where the luminous
intensity was held constant and the dots were all shown simultaneously for durations ranging from 10 to 100 ms. Across the range of durations there was less than a 10% differential in successful recogni -tion of the shape patterns even though the number of photons in each 100-ms lash was 10 times the
number in a 10-ms lash.
It would be useful to better determine the role of luminance intensity and duration in providing for
effective processing of image content. Four experiments were performed to more thoroughly examine whether Bloch’s law applies to recognition of shape patterns that are displayed with lashes in the
microsecond range.
2 Methods
2.1 Shape pattern inventory
An inventory of 360 shape patterns displayed the major contours—especially the outside boundaries—
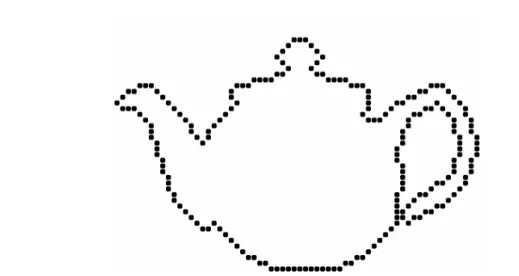
of namable “objects.” It included animals, furniture, vehicles, tools, distinctive human activities, car-toon characters, well-known iconic symbols, and truncated portions of objects, e.g., heads, feet. An earlier article provided details on how the shape patterns were generated and selected (see Greene & Ogden, 2012). A list of shape names is provided in Supplemental Table 1, each identiied by the name that was assigned as it was being constructed. Figure 1 shows an example of a shape pattern that respondents were asked to identify.
2.2 Stimulus display
The dots in a given shape pattern were displayed as simultaneous brief lashes from a 64 64 array of LEDs, also described as a “display board.” The LEDs emitted at a wavelength of 630 nm (red). Note
that the display board for the present experiments is a second-generation device that differs from that used for a number of earlier reports (Greene, 2006; 2007a, b, c, d). It has more precision and range in the control of timing and luminous intensity and can simultaneously display all the dots forming a
given shape pattern. For convenience, the simultaneous lash of all dots in a given shape pattern may be described as a singular event, i.e., a lash.
The display board was mounted on the wall opposite and 3.5 m from the respondent. At this dis
-tance, the LED diameters and spacings were 4.92 and 9.23 minutes of visual angle, respectively. The full span across each axis of the array was 9.80 degrees of visual angle.
With the diameter being less than 5 minutes of visual angle, it is appropriate to consider each
Flash intensities and durations were controlled by a microcontroller running instructions from a Mac G4 Cube. Experimental protocols were speciied using Tcl/tk custom applications written for OS-X.
Standard luorescent ixtures in the test room were itted with occluding panels so that intensity of
room lighting could be controlled without changing color balance. The occluders were positioned to provide 10 lux of ambient illumination.
Additional details on equipment, intensity and duration calibration, and calculation of photon quantity can be found in Supplemental Methods.
2.3 Respondents and testing protocols
Thirty-two respondents were recruited from the USC Department of Psychology Respondent Pool, eight being tested in each of the four experiments. Each respondent was individually tested in a session that most often lasted 30–45 minutes. Each judged the stimulus displays using both eyes, allowing cor
-rection of vision as needed. Experiments were carried out in accordance with institutional regulations and the Declaration of Helsinki.
A given respondent was shown each of the 360 shape patterns only once and all the dots of a given pattern were lashed simultaneously. The respondent could provide a correct response by saying a
name that had been designated to be acceptable as evidence of recognition. Respondents were not told
whether or not their responses were correct. Display and recording of response for each shape pattern generally took 4–5 s.
3 Results
3.1 Statistical analysis and modeling
For each of the four experiments, the data were processed by applying generalized linear mixed effects models using software in the R environment. For each respondent, both a random slope and a random intercept were allowed. Fixed effects were luminous intensity, photon count, and lash duration, and
there was a random effect for respondents. Outcomes were binary and so the logit link function was
used. Treatment effects in each experiment were found to be signiicant at p < 10-15, i.e., this was the
largest probability found among the experiments. Plots of respondent means and models can be found in Supplemental Results.
3.2 Activation functions from varying intensity and duration
A major goal was to determine the intensities and quantities of light that were needed to produce levels of recognition, i.e., hit rates, that ranged from zero to an asymptote at about 0.8. Models showing the
change in hit rate as a function of light intensity, photon quantity, or lash duration will be designated
as “activation functions.”
Figure 1. The string of dots marking locations on the outer boundary of a teapot provides one example from the
inventory of 360 shape patterns. The stimulus seen by the respondent was a single brief and simultaneous lash of all dots in the shape pattern, and correct identiication required that respondents say a name that was deemed
Experiment 1 derived the activation functions for hit rate against luminance intensity at three lash
durations, designated as T1, these being 10, 50, and 100 ms. After examining these data, it was decided
that it would be useful to add a 3-ms activation function, therefore Experiment 2 was run and the
results from both experiment were submitted to statistical analysis and modeling. Figure 2(A) shows
the aggregate models for the activation functions at the four lash durations. A conidence band is also
provided for each aggregate model.
The activation functions shown in Figure 2 specify how a change in the luminance intensity of the light provides for progressively higher recognition of the shape patterns, with no shapes being
identiied when the intensity was too low and with progressively higher recognition as the luminous intensity was increased. The positioning of models shows that as lash duration becomes shorter, more
luminous intensity is needed to provide a given level of recognition.
3.3 Hit rate as a function of photon quantity
One can examine whether Bloch’s law applies by replotting the aggregate models according to the
quantities of photons that were provided by 3, 10, 50, and 100 ms lashes. That quantity is a function
of luminous intensity and duration (see Supplemental Methods for speciics). The aggregate models have been plotted in Figure 3—hit rate against the square root of photon quantity. The square root of photons was used to better delineate the differences among the models; there is no suggestion that it has a functional meaning. It is clear from inspection that the amount of light needed to elicit a given
level of recognition differed for the four lash durations. This is not consistent with the principle of
reciprocity proposed by Bloch (1885).
Not only is the total quantity of photons different for the four lash durations, but fewer photons were needed to elicit recognition for shorter as compared to longer lash durations. This further indi
-cates that threshold responding by retinal neurons is not based on the amount of light in the lash. Per -haps transitions in light intensity are registered by retinal neurons within microseconds, and the light that comes later contributes little to the response of these neurons.
3.4 Recognition levels with photon quantity held constant
Experiments 3 and 4 evaluated levels of recognition for the inventory of shapes where the number of photons delivered by each dot lash was held constant and duration was varied. Each experiment used photon quantities that were expected to produce the 0.75 hit rate when delivered at the shortest duration. (See Supplemental Methods for details with respect to experimental protocols.) Eight new
respondents were tested for each experiment.
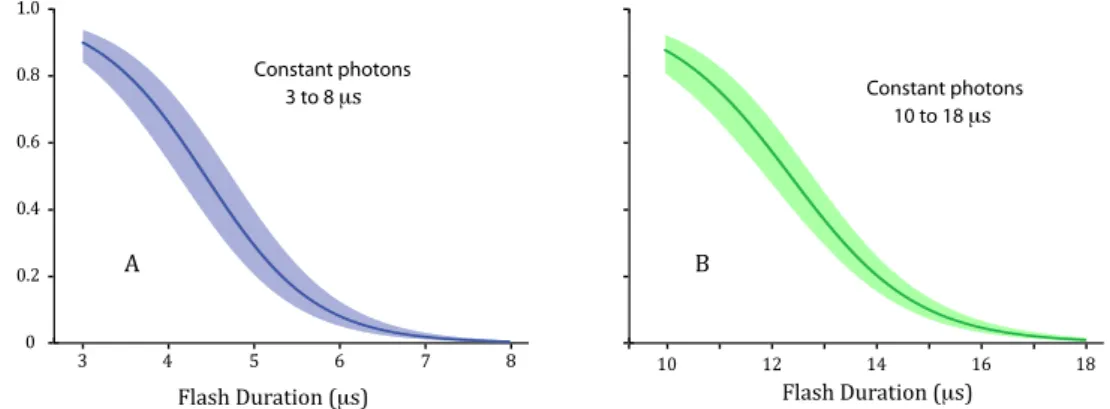
Aggregate models of hit rate against T1 duration for the two experiments are provided in the two panels of Figure 4. Within a given experiment, the same quantity of light was presented at each
T1 level, yet the hit rate declined to zero as lash duration was increased. 0.2 0.4 0.6 0.8 1.0
Luminous Intensity (Cd)
H
it R
at
e
0 0.2 0.4 0.6 0.8
0 20 40 60 100
Flash Duration (T1)
Luminous Int
ensity (C
d)
0 0.2 0.4 0.6 0.8
80 25% hit rate 50% hit rate 75% hit rate
A B
Figure 2. (A) The aggregate models for 3, 10, 50, and 100 ms are plotted (blue, green, yellow, and red, respectively).
Note that deviations from model predictions are vertical; therefore, the conidence band narrows as the aggregate model manifests a steeper rise. (B) The duration and level of luminous intensity needed to produce 25%, 50%, and 75% recognition at each lash duration are plotted. There was a nonlinear rise in the luminance intensity required
The results shown in Figure 4 demonstrate that a given quantity of photons becomes progressively
less effective for eliciting recognition of shapes as the lash duration is increased. The quantity of pho
-tons that were delivered in a 3-ms lash allowed respondents to identify 82% of the shapes. However, only 5% of the shapes were recognized when that number of photons was spread across 6 ms and none
were recognized with a 7-ms lash. A similar rapid decline in hit rate was found for the 10–18 ms range. This is completely at odds with Bloch’s law.
Figure 3. The aggregate models for 3, 10, 50, and 100 us are plotted (blue, green, yellow, and red, respectively). Here the models have been plotted as a function of the quantity of photons in the lashes, geometrically transformed
to more clearly illustrate treatment differentials. The quantity of photons needed to elicit recognition at any given
level of success differed for each lash duration, so these results do not conform to Bloch’s law. Also, fewer photons were needed for shorter lash durations, which is at odds with current models for how visual mechanisms
are activated.
0 0.2 0.4 0.6 0.8 1.0
H
it R
at
e
100 200 300 400 500 600 700 800
Photon Quantity
Figure 4. The two panels plot the hit rates in Experiments 3 and 4 as a function of lash duration, with the added
condition that the quantity of photons was held constant irrespective of duration. (A) The quantity of photons
that produced very high levels of recognition at 3 ms was progressively less able to produce recognition at longer
durations. One might attribute the decline to the reduction of luminance intensity that was required to provide the same number of photons. (B) Here also, the quantity of photons that produced very high levels of recognition at
10 ms provided lower, and inally zero, recognition as that quantity was spread across longer durations.
0 0.2 0.4 0.6 0.8 1.0
Flash Duration (μs)
H
it R
at
e
3 4 5 6 7 8
Constant photons 3 to 8 μs
10
Flash Duration (μs)
12 14 16 18
Constant photons 10 to 18 μs
A B
4 Discussion
It is gratifying to be able to demonstrate that lashes as brief as 3 ms provide activation of the visual
sys-tem that is suficient for registering and summarizing contour attributes, thus allowing for recognition
of the shapes. This supports the possibility that Rood (1871) was correct in saying that lashes lasting
for only fractions of a microsecond allow image content to be identiied. Rood said that he was able to
ther study visual mechanisms that register and summarize briely displayed visual information. With respect to the impact of photons from such brief lashes, it is clear that our results do not
conform to Bloch’s law. One can see from inspection of Figure 3 that with four different lash dura -tions the thresholds for eliciting recognition as well as the incremental increases in hit rate were not determined by the quantity of photons being delivered. In other words, we have not found reciprocity
of lash duration and intensity for producing equal levels of shape recognition.
A substantial number of investigators have reported reciprocity of intensity and duration for
abso-lute and discrimination thresholds. Graham and Margaria (1935) studied the absolute threshold for perceiving a small peripheral spot of light. They reported that the threshold response was elicited by a constant quantity of photons across durations that ranged from 1 to 100 ms, the upper limit for con-formance to Bloch’s law being known as the “critical duration.” At longer durations, the threshold was directly proportional to the intensity of the light. They also found that the critical duration decreased as the area of the stimulus increased. Barlow (1958) had similar indings, though with a somewhat shorter critical duration.
Karn (1936) found reciprocity of intensity and duration with foveal stimulation that varied the
area of the stimulus from 1 to 20 minutes of visual angle. The critical duration for threshold percep
-tion was about 64 ms with the smaller stimuli and it became shorter as stimulus areas were increased.
Above the critical duration, the threshold was a simple function of intensity, approaching the condition wherein intensity would be equal to a constant.
Graham and Kemp (1938) tested discrimination of increments of brightness, i.e., relative
thresh-olds. Their smallest duration was 2 ms and they observed reciprocity across all intensities with the crit -ical duration being just under 100 ms. Above the crit-ical duration, the discrimination of the brightness differential was a simple linear function of intensity.
Others have reported results consistent with Bloch’s law for discrimination thresholds with thin bars (Niven & Brown, 1944), square wave gratings (Graham & Cook, 1937), colored stimuli (Rouse
1952; Baumbardt & Hillmann, 1961) and motion (Brown, 1957).
Kahneman and Norman (1964) examined identiication of 1/0 triads with durations ranging from
5 ms to 1 s and reported reciprocity with lashes that were shorter than 100 ms. This study comes clos -est to having task demands similar to those used here in that respondents had to read and report the three-numeral combinations that were displayed.
One might question whether the equal-energy lashes were completely equivalent in their percep -tual impact. Zacks (1970) found threshold reciprocity for equal-energy lashes with durations rang
-ing from 2 to about 100 ms, but respondents were able to discriminate 4 versus 81 ms lashes almost perfectly. This investigator makes the point that inding that a given amount of energy is needed for
threshold perception does not assure that all aspects of the generated responses will be comparable. His demonstration that the various durations can be discriminated argues otherwise.
We have some concern about relying on the early- and mid-20th-century experiments as support
for the principle of intensity duration reciprocity. While the ingenuity of the experimenters is to be commended, the available tools for control of stimulus intensity and timing may not have provided
unambiguous results. For example, most of the investigators cited above used rotating slits to control lash duration. The intensity would have risen to a maximum and then dropped back down to zero as
the slit passed across the light source. As further noted below, the visual system may have microsecond resolution of intensity. If so, these transitions would be registered as ramped gradients. A number of
laboratories have reported that retinal neurons are sensitive to rate of change. Freeman, Eddington, Rizzo, and Fried (2010), for example, used direct sinusoidal electrical stimulation of the retina and found that ganglion cells are activated within a certain frequency range. This means that these cells are sensitive to rate of change in the stimulus.
The present results may especially differ from earlier work due to the use of LEDs that have a nar
-row range of wavelength emission that is centered at 630 nm. This is in the tail of the spectral response of red cones (Bowmaker & Dartnall, 1980). The light would likely produce minimal stimulation of
blue cones and is well beyond the range of wavelengths to which rods respond. Most of the work that
has claimed reciprocity of threshold perception has used broad-spectrum white light and even where
Schnapf, 1984; Field, Sampath, & Rieke, 2005). However, this would not explain the results of Karn (1936) who found reciprocity for stimuli presented to the fovea.
Aside from the issue of Bloch’s law, the present results indicate that lash durations are being
registered with microsecond resolution. We see two alternative interpretations, both of which lead to this conclusion.
Figure 2 shows that luminance intensity must be increased for shorter lashes to be equally effec
-tive at eliciting recognition. This is intui-tively reasonable—a shorter lash needs to be brighter to pro
-vide the same hit rate as a longer lash. However, it must be understood that luminance intensity level is not a “quantity” of light, it is a rate. It essentially speciies the number of photons being delivered per unit time. As received by the sensor, it is what physicists call “photon lux.” For the sensor to be able to register differentials of luminance intensity, it must have suficient temporal precision to assess
the rate that photons are arriving across a given duration.
An electronic example may help clarify the point. The ThorLabs photodetector used to conirm calibration of equipment has a temporal resolution of 15 ns. Electrons are knocked loose from their
orbits within femtoseconds, but it takes much longer for the generated signal to reach a stable level that
allows the rate of photon lux to be registered. Thus, the photodetector can only provide an accurate reading of the luminous intensity of lashes lasting longer than 15 ns. The results shown in Figure 2 afirm that there are differentials of recognition for durations as short as 3 ms. Further, the ability to
register systematic declines of hit rate across 1-ms increments (Figure 4) strongly suggests a 1-ms level of temporal resolution.
Alternatively, it is possible that the durations of lashes are being quantiied by a special retinal mechanism, perhaps by timing the interval between onset and offset of the lash, and these measures
are used to compensate for differentials in the number of photons being delivered. This could
ration-alize the counterintuitive inding—shown in Figure 3—wherein the full activation curve for shape recognition could be elicited by brief lashes that were shorter in duration and thus delivered fewer
photons.
Either alternative explanation requires exceptionally high temporal precision for generating or
processing of visual signals. We favor the hypothesis that the retina is mediating the critical steps of this process, but are mindful that various brain regions have been shown to mediate ultra-high tempo-ral precision in other sense modalities.
See Supplemental Discussion for further evaluation of this topic.
Acknowledgments. David Nyberg designed the circuitry for the display system. Jack Morrison of Digital Insight fabricated the system, wrote the irmware and software required for its operation, calibrated emission intensity and duration, and contributed to the evaluation and interpretation of results in numerous ways. Professor Jack Feinberg, USC Physics Department, took measures to conirm calibration of lash duration and luminous intensity. Respondents were tested by Andrew Alonzo.
References
Barlow, H. B. (1958). Temporal and spatial summation in human vision at different background intensities.
Journal of Physiology, 141, 337–350.
Baumbardt, E., & Hillmann, B. (1961). Duration and size as determinants of peripheral retinal response. Journal
of the Optical Society of America, 51, 340–344. doi:10.1364/JOSA.51.000340
Baylor, D. A., Nunn, B. J., & Schnapf, J. L. (1984). The photocurrent, noise and spectral sensitivity of rods in
the monkey Macaca fascicularis. Journal of Physiology, 357, 575–607.
Bloch, A. M. (1885). Experiences sur la vision. Comptes Rendus de la Societe de Biologie 3, 493–495.
Bowmaker, J. K., & Dartnall, H. J. A. (1980). Visual pigments of rods and cones in a human retina. Journal of
Physiology, 298, 501–511.
Brindley, G. S. (1952). The Bunsen-Roscoe law for the human eye at very short durations. Journal of
Physiology, 118, 135–139.
Brown, R. H. (1957). The effect of extent on the intensity-time relation for the visual discrimination of movement.
Journal of Comparative and Physiological Psychology, 50, 109–114. doi:10.1037/h0041499
Bunsen, R., & Roscoe, H. E. (1855). Photochemische untersuchungen. Poggendorff ’s Annalen, 96, 373–394.
Coltheart, M. (1980). Iconic memory and visible persistence. Perception and Psychophysics, 27, 183–228.
doi:10.3758/BF03204258
Field, G. D., Sampath, A. P., & Rieke, F. (2005). Retinal processing near absolute threshold: From behavior to
Copyright 2013 E Greene, R T Ogden
Published under a Creative Commons Licence a Pion publication
with sinusoidal electrical stimulation. Journal of Neurophysiology, 104(5), 2778–2791. doi:10.1152/
jn.00551.2010
Graham, C. H., & Cook, C. (1937). Visual acuity as a function of intensity and exposure-time. American
Journal of Psychology, 49, 654–661.
Graham, C. H., & Kemp, E. H. (1938). Brightness discrimination as a function of the duration and the increment
in intensity. Journal of General Physiology, 21, 635–650. doi:10.1085/jgp.21.5.635
Graham, C. H., & Margaria, R. (1935). Area and the intensity-time relation in the peripheral retina. American
Journal of Physiology, 113, 299–305.
Greene, E. (2006). Simultaneity in the millisecond range as a requirement for effective shape recognition.
Behavioral and Brain Functions, 2, 38. doi:10.1186/1744-9081-2-38
Greene, E. (2007a). Information persistence in the integration of partial cues for object recognition. Perception
and Psychophysics, 69(5), 772–784. doi:10.3758/BF03193778
Greene, E. (2007b). The integration window for shape cues is a function of ambient illumination. Behavioral
and Brain Functions, 3, 15. doi:10.1186/1744-9081-3-15
Greene, E. (2007c). Spatial and temporal proximity as factors in shape recognition. Behavioral and Brain
Functions 3, 27. doi:10.1186/1744-9081-3-27
Greene, E. (2007d). Retinal encoding of ultrabrief shape recognition cues. PLoS ONE, 2(9), e871. doi:10.1371/
journal.pone.0000871
Greene, E. (2008). Additional evidence that contour attributes are not essential cues for object recognition.
Behavioral and Brain Functions, 4, 26. doi:10.1186/1744-9081-4-26
Greene, E., & Ogden, R. T. (2012). Evaluating the contribution of shape attributes to recognition using the
minimal discrete cue protocol. Behavioral and Brain Functions, 8, 53. doi:10.1186/1744-9081-8-53
Haber, R. N., & Standing, L. (1969). Direct measures of short-term visual storage. Quarterly Journal of
Experimental Psychology, 21, 43–54. doi:10.1080/14640746908400193
Kahneman, D., & Norman, J. (1964). The time-intensity relation in visual perception as a function of the
observer’s task. Journal of Experimental Psychology, 68, 215–220. doi:10.1037/h0046097
Karn, H. W. (1936). Area and the intensity-time relation in the fovea. Journal of General Physiology, 14,
360–369. doi:10.1080/00221309.1936.9713159
Long, G. (1980). Iconic memory: A review and critique of the study of short-term visual storage. Psychological
Bulletin, 88, 785–820.
Neisser, U. (1967). Cognitive psychology. New York: Appleton-Century-Crofts.
Niven, J. I., & Brown, R. H. (1944). Visual resolution as a function of intensity and exposure time in the human
retina. Journal of the Optical Society of America, 34(12), 738–743. doi:10.1364/JOSA.34.000738
Rood, O. N. (1871). On the amount of time necessary for vision. American Journal of Science and Arts, 2,
159–160.
Rouse, R. O. (1952). Color and the intensity-time relation. Journal of the Optical Society of America, 42,
626–630. doi:10.1364/JOSA.42.000626
Thorpe, S., Fize, D., & Marlot, C. (1996). Speed of processing in the human visual system. Nature, 381,
520–522. doi:10.1038/381520a0
Thurgood, C., Whitield T. W. A., & Patterson J. (2011). Toward a visual recognition threshold: New instrument
shows humans identify animals with only 1 ms of visual exposure. Vision Research, 51, 1966–1971.
doi:10.1016/j.visres.2011.07.008
Van Rullen, R., & Thorpe, S. (2001). The time course of visual processing: From early perception to decision
making. Journal of Cognitive Neuroscience, 13(4), 454–461. doi:10.1162/08989290152001880
Wheatstone, C. (1834). An account of some experiments to measure the velocity of electricity and the
duration of electric light. Philosophical Transactions of the Royal Society, 124, 583–591. doi:10.1098/
rspl.1830.0178
Zacks, J. L. (1970). Temporal summation phenomena at threshold: Their relation to visual mechanisms. Science,