STUDIES PROFITABILITY OF RESTAURANTS
Assoc. Prof. Cristiana Tindeche Ph. D Assoc. Prof. Romeo Cătălin Creţu Ph. D
University of Agronomic Sciences and Veterinary Medicine
Faculty of Management, Economic Engineering in Agriculture and Rural Development,
Bucharest, Romania
Abstract: Fast foods are internationally expanding at an amazing pace. Because fast-food products are delicious, abundant, relatively cheap and available in any moment of the day, this type of restaurants are found almost everywhere, and in addition, these have home delivery options, are appreciated and consumed by all age categories, so that fast-food has become a worldwide appreciated phenomenon. In support of the previous mentions, we shall emphasize an economic analysis performed for the Burger King Plaza Restaurant during 2010-2011. The results of the analysis may be appreciated as for being satisfying, although there is a need for improvement if this unit is to cope to the current and future conditions.
JEL classification: M20, M40, O14
Key wor ds: fast food uni ts, ec onomi c appr oac h, effi ci enc y acti vi ty, r estaur ants
1.INTRODUCTION
Fast food is the term given to food that can be prepared and served very quickly. While any meal with low preparation time can be considered to be fast food, typically the term refers to food sold in a restaurant or store with preheated or precooked ingredients, and served to the customer in a packaged form for take-out/take-away.
The term "fast food" was recognized in a dictionary by Merriam–Webster in 1951. Outlets may be stands or kiosks, which may provide no shelter or seating, or fast food restaurants (also known as quick service restaurants).
Franchise operations which are part of restaurant chains have standardized foodstuffs shipped to each restaurant from central locations.
Fast food outlets are take-away or take-out providers, often with a "drive-through" service which allows customers to order and pick up food from their cars, but most also have indoor and/or outdoor seating areas in which the customers can eat the food on-site.
Today, fast food doesn’t need any introduction. In the century of speed, when the modern man is in a permanent rush for affirmation, success, money, and time is passing incredibly fast, fast-food is a perfect alternative to cooking dinner at home.
On the other hand, the fast-food products are delicious, abundant, relatively cheap, and available in any moment of the day, reasons for which fast food has become a phenomenon appreciated worldwide. (Beciu, S., 2011).
2.OBJECTIVES
Burger King, often abbreviated as BK, is a global chain of hamburger fast food restaurants headquartered in unincorporated Miami-Dade County, Florida, United States. The company began in 1953 as Insta-Burger King, a Jacksonville, Florida-based restaurant chain. After Insta-Burger King ran into financial difficulties in 1955, its two Miami-based franchisees, David Edgerton and James McLamore, purchased the company and renamed it Burger King. Over the next half century, the company would change hands four times, with its third set of owners, a partnership of TPG Capital, Bain Capital, and Goldman Sachs Capital Partners, taking it public in 2002. In late 2010, 3G Capital of Brazil acquired a majority stake in BK in a deal valued at $3.26 billion (USD). The new owners promptly initiated a restructuring of the company to reverse its fortunes.
At the end of fiscal year 2011, Burger King reported it had more than 12,400 outlets in 73 countries; of these, 66 percent are in the United States and 90 percent are privately owned and operated. BK has historically used several variations of franchising to expand its operations.
The manner in which the company licenses its franchisees varies depending on the region, with some regional franchises, known as master franchises, responsible for selling franchise sub-licenses on the company's behalf.
Burger King's relationship with its franchises has not always been harmonious. Occasional spats between the two have caused numerous issues, and in several instances the company's and its licensees' relations have degenerated into precedent-setting court cases.
The Burger King menu has evolved from a basic offering of burgers, french fries, sodas, and milkshakes in 1954, to a larger, more diverse set of product offerings. In 1957, the Whopper was the first major addition to the menu; it has since become Burger King's signature product.
Conversely, BK has introduced many products which failed to catch hold in the marketplace. Some of these failures in the US have seen success in foreign markets, where BK has also tailored its menu for regional tastes. From 2002 to 2010, Burger King aggressively targeted the 18–34 male demographic with larger products that often carried correspondingly large amounts of unhealthy fats and trans-fats.
This tactic would eventually come to hurt the company's financial underpinnings and cast a negative pall on its earnings. Beginning in 2011, the company began to move away from the previous male-oriented menu and introduce new menu items, product reformulations, and packaging as part of 3G Capital's restructuring plans of the company.
The 1970s were the "Golden Age" of Burger King advertising, but beginning in the early 1980s, the company's advertising began to lose focus; a series of less successful ad campaigns created by a procession of advertising agencies continued for the next two decades.
of new campaigns centered on a redesigned Burger King character accompanied with a new online presence. While highly successful, some of CP+B commercials were derided for perceived sexism or cultural insensitivity.
New owner, 3G Capital, terminated the relationship with CP+B in 2011 and moved its advertising to McGarryBowen to begin a new product oriented campaign with expanded demographic targeting.
3.METHODOLOGY
In the present study the technical-economic activity developed by Burger King Plaza restaurant in Bucharest has been analysed during 2010-2011, using the methodology existing in specialized literature.
The profit and loss statement, as well as other internal data provided by the Financial Accounting Department of the restaurant have allowed the performance of this analysis.
As Creţu Raluca Florentina (2012) said „in the context of current developments, the concept and model of sustainable development, started as 40 years ago, are still fewer followers. They are disputed, discussed, critiqued, and often simply forgotten (if not deliberately ignored) the current socio-economic analysis” (Creţu R.F., 2012).
4.ANALYSES
Analysing the daily client structure in 2011 it is observed that youngsters were the ones who have stepped into the Burger King Plaza restaurant the most in 2011, representing a share of 65%, followed by children and adults with a share of 15%, and the lowest share is that of the elders, with only 5%.
Table no. 1 Daily client structure in 2011
No. Specification No. of clients/day %
1. Children 225 15
2. Youth 975 65
3. Adults 225 15
4. Elders 75 5
Total 1500 100
Source: Internal data of the Burger King Plaza Restaurant
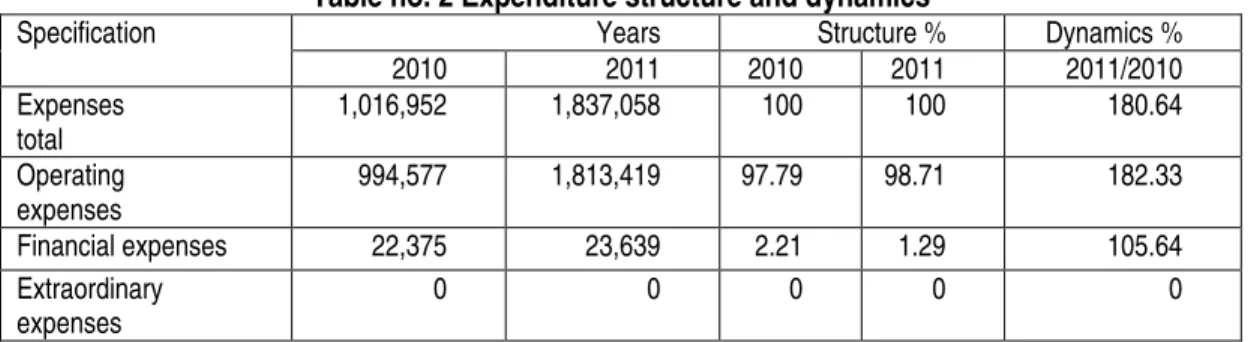
Table no. 2 Expenditure structure and dynamics
Specification Years Structure % Dynamics %
2010 2011 2010 2011 2011/2010
Expenses total
1,016,952 1,837,058 100 100 180.64
Operating expenses
994,577 1,813,419 97.79 98.71 182.33
Financial expenses 22,375 23,639 2.21 1.29 105.64
Extraordinary expenses
0 0 0 0 0
As one may observe, the largest share, of approximately 98% is the one of operating expenses, the difference being represented only by the financial expenses.
Table no. 3 Revenues structure and dynamics
Specification Years Structure % Dynamics %
2010 2011 2010 2011 2011/2010
Revenues total 1,547,582 2,495,209 100 100 161.23
Operating revenues 1,517,042 2,460,000 98.03 98.59 162.15
Financial revenues 30,540 35,209 1.97 1.41 115.28
Extraordinary revenues
0 0 0 0 0
Source: Data provided by the Accounting Department
Total revenues show an upward trend starting from 1,547,582 lei in 2010 and reaching the amount of 2,495,209 lei in 2011, increasing with 61.23%. The largest share, over 98% of the revenues total is that of the operating revenues.
Table no.4 Turnover structure and evolution
Specification Years Structure % Dynamics %
2010 2011 2010 2011 2011/2010
Net turnover 1,517,042 2,460,000 100 100 162.15
Sold production 1,005,818 1,708,521 66.30 69.45 169.86
Revenues from the sold production
511,224 751,679 33.70 30.55 147.03
Source: Data provided by the Accounting Department
In 2011 the turnover has recorded an increase of 62.15% compared to 2010 due to the increase of the production sold, from 1,005,818 lei to 1,708,521 lei.
The largest share in the turnover total is of 70% and it represents the production sold, followed by the revenues from selling the merchandise, of only 30%.
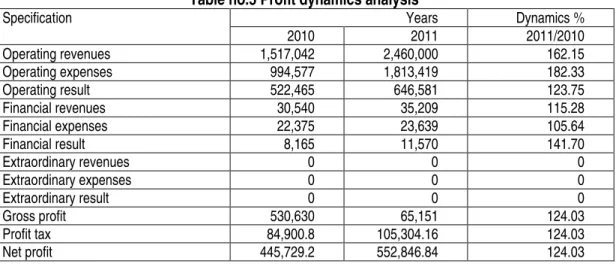
Table no.5 Profit dynamics analysis
Specification Years Dynamics %
2010 2011 2011/2010
Operating revenues 1,517,042 2,460,000 162.15
Operating expenses 994,577 1,813,419 182.33
Operating result 522,465 646,581 123.75
Financial revenues 30,540 35,209 115.28
Financial expenses 22,375 23,639 105.64
Financial result 8,165 11,570 141.70
Extraordinary revenues 0 0 0
Extraordinary expenses 0 0 0
Extraordinary result 0 0 0
Gross profit 530,630 65,151 124.03
Profit tax 84,900.8 105,304.16 124.03
Net profit 445,729.2 552,846.84 124.03
The operating result had an upward trend during the years of the study, increasing from 522,465 lei in 2010 to 646,581 lei in 2011, representing a 23% growth.
The financial result recorded a growth of 41.70% compared to 2010, respectively from 8,165 lei to 11,570 lei.
The financial-economic result is a positive one for the entire activity. The net profit had an upward trend; in 2011 there was a growth of 24.03% compared to 2010.
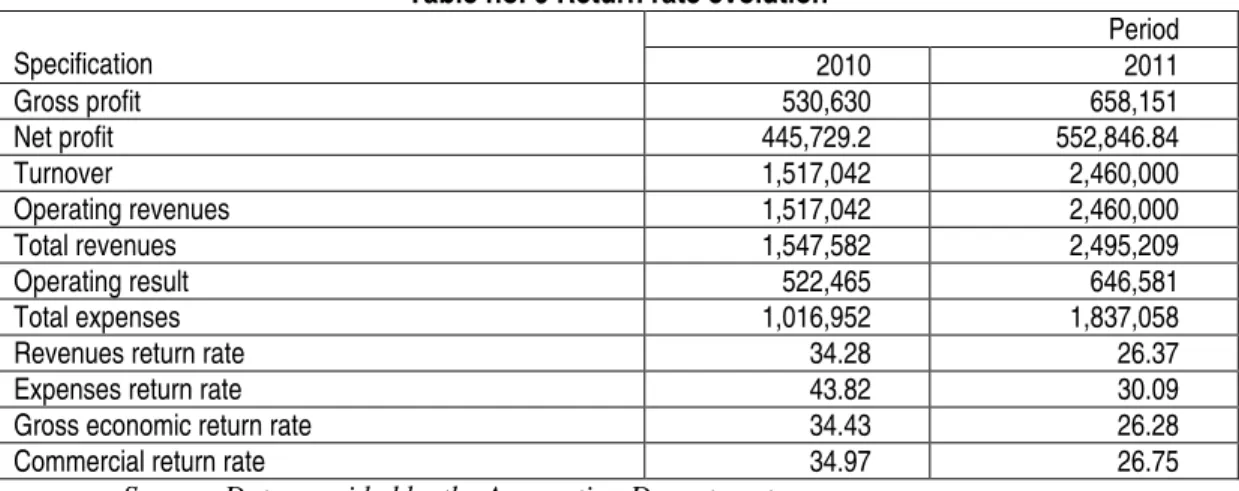
Table no. 6 Return rate evolution
Specification
Period
2010 2011
Gross profit 530,630 658,151
Net profit 445,729.2 552,846.84
Turnover 1,517,042 2,460,000
Operating revenues 1,517,042 2,460,000
Total revenues 1,547,582 2,495,209
Operating result 522,465 646,581
Total expenses 1,016,952 1,837,058
Revenues return rate 34.28 26.37
Expenses return rate 43.82 30.09
Gross economic return rate 34.43 26.28
Commercial return rate 34.97 26.75
Source: Data provided by the Accounting Department
The return rates record average values that vary between 26% and 44%, fact that indicates the development of an efficient activity, based on a competent and efficient management.(Bran, P., Bran, F., Creţu, R.F et al., 2004, pg. 10).
5.CONCLUSIONS
Dramatic changes are unlikely on the Romanian fast-food market, finding itself currently in a phase of maturation, materialized through the development of a range of varieties adjusted in report to the customers’ needs.
Enlargement of the Burger King products on different criteria of the range of varieties, enlargement of the range of varieties through offering differentiated quantities represent strategic alternatives of the producers as regards to drawing the attention and obviously drawing the revenues of potential customers.
Burger King Products have suffered a metamorphosis over the time in Romania, successively going from the no name stage to the stage where their choice involves identification, attitude and decision.
The fast-food product offer for the Romanian market must be adjusted to the Romanian consumer profile.
The Burger King products price is recommended to the level of revenue of the targeted segment but also to the economic situation from the past period, the variation margin of the price being this way determined.
REFERENCES
1. Beciu, S., Popa,
O.E., Nistor, Ş., Olteanu, V.
The Socio-Economic Dimension Of Rural Development For The North-East Region Of Romania. African Journal of Agricultural Research, ISSN 1991-637X, 2011.
2. Bran, P., Bran,
F., Creţu, R.F.
Dimensiunea economică a impactului de mediu. Bucharest: Editura
ASE, 2004.
3. Creţu, R.F. Empirical analysis of the correlation of elements and sustainable
development of a regional development model. Supplement of “Quality-access to success” Journal year Vol. 13, S3-2012. pg. 230-237, ISSN 1582-2559, 2012.
4. Creţu, R. C. Legislaţie în alimentaţie publică şi agroturism. Bucharest: Editura
CERES, 2012.
5. Tindeche, C. Financial and economic analysis, CERES Publishing House, 2004.
6. Tindeche, C. Economic and financial analysis of catering and tourism, CERES