CPD
8, 3613–3655, 2012Monitoring stable isotopes in caves over altitudinal
gradients
V. E. Johnston et al.
Title Page
Abstract Introduction
Conclusions References
Tables Figures
◭ ◮
◭ ◮
Back Close
Full Screen / Esc
Printer-friendly Version
Interactive Discussion
Discussion
P
a
per
|
Dis
cussion
P
a
per
|
Discussion
P
a
per
|
Discussio
n
P
a
per
Clim. Past Discuss., 8, 3613–3655, 2012 www.clim-past-discuss.net/8/3613/2012/ doi:10.5194/cpd-8-3613-2012
© Author(s) 2012. CC Attribution 3.0 License.
Climate of the Past Discussions
This discussion paper is/has been under review for the journal Climate of the Past (CP). Please refer to the corresponding final paper in CP if available.
Monitoring stable isotopes in caves
over altitudinal gradients: fractionation
behaviour and inferences for speleothem
sensitivity to climate change
V. E. Johnston1, A. Borsato1, C. Sp ¨otl2, S. Frisia3, and R. Miorandi1
1
Geology Section, Museo delle Scienze, Via Calepina 14, 38122 Trento, Italy
2
Institut f ¨ur Geologie und Pal ¨aontologie, Universit ¨at Innsbruck, 6020 Innsbruck, Austria
3
School of Environmental and Life Sciences, University of Newcastle, Callaghan 2308 NSW, Australia
Received: 30 July 2012 – Accepted: 6 August 2012 – Published: 14 August 2012 Correspondence to: V. E. Johnston (vanessa.johnston@mtsn.tn.it)
CPD
8, 3613–3655, 2012Monitoring stable isotopes in caves over altitudinal
gradients
V. E. Johnston et al.
Title Page
Abstract Introduction
Conclusions References
Tables Figures
◭ ◮
◭ ◮
Back Close
Full Screen / Esc
Printer-friendly Version
Interactive Discussion
Discussion
P
a
per
|
Dis
cussion
P
a
per
|
Discussion
P
a
per
|
Discussio
n
P
a
per
|
Abstract
Large changes of the climate can dramatically affect the environment surrounding and within a cave. This variability, including temperature shifts, can change the amount of in-cave isotopic fractionation affecting speleothems, potentially leaving these records difficult to interpret. Here, caves located in steep altitudinal topography in the
North-5
ern Italian Alps are used to create a thermal gradient (3–12◦C) to study the effects of temperature on the speleothem isotope record. The data indicate that the amount of in-cave oxygen isotope fractionation is reduced to minimum values of around 0.25 ‰ with cooler temperatures and under faster dripping stalactites, which infers that such sites would be most suitable for palaeoclimate reconstruction. However, when considering
10
the possible freezing periods, reduced saturation index and fluctuating drip rates, such sites appear less than ideal for study on long timescales. The importance of picking the best site(s) within a cave for palaeoclimate reconstruction is paramount, to reduce the in-cave fractionation and gain a record that reflects climate changes. A method for rapid determination of calcite fractionation is demonstrated here, through prior cave
monitor-15
ing of dripwaters and calcite precipitates, permitting an informed choice of speleothems for further study.
1 Introduction
Demand for speleothems to be included in palaeoclimate studies is ever increasing due to advances in high-precision dating techniques (Cheng et al., 2009; Wang et al.,
20
2008). Stable oxygen isotopes are most commonly used, being a proxy of environ-mental changes involving precipitation and temperature (Lachniet, 2009; McDermott, 2004). Application of oxygen isotopes in speleothems has been particularly success-ful in determining the intensity of the monsoon (Fleitmann et al., 2003; Wang et al., 2001). However, in certain well-constrained cave sites, past temperature
reconstruc-25
CPD
8, 3613–3655, 2012Monitoring stable isotopes in caves over altitudinal
gradients
V. E. Johnston et al.
Title Page
Abstract Introduction
Conclusions References
Tables Figures
◭ ◮
◭ ◮
Back Close
Full Screen / Esc
Printer-friendly Version
Interactive Discussion
Discussion
P
a
per
|
Dis
cussion
P
a
per
|
Discussion
P
a
per
|
Discussio
n
P
a
per
the complexity of the oxygen isotope signal is embedded in the fact that the initial rainwater value is controlled by diverse atmospheric processes (e.g. moisture source and transport pathway, altitude and rainfall amount) (Rozanski et al., 1992). This is then modified by evapotranspiration and water-rock interactions as infiltration passes through the soil, host-rock, and into the cave environment as dripwater (Lachniet, 2009;
5
McDermott, 2004). Further alteration then occurs via kinetic fractionation on degassing and the precipitation of speleothem calcite (Day and Henderson, 2011; Mickler et al., 2006; Tremaine et al., 2011). Therefore, robust interpretation of a speleothem archive requires a good understanding of all parts of the oxygen isotope system and the con-trolling factors for the particular cave and drip site.
10
Since Genty et al. (2003) found large changes in stable carbon isotopes reflecting Dansgaard–Oeschger Events, reporting of theδ13C has increased. Carbon isotopes are thought to reflect changes in vegetation and soil above the cave that ultimately reflect temperature-related climate changes. However, the difference between pCO2 of the dripwater and the cave air, enhanced by cave ventilation, can cause significant
15
enrichment of theδ13C values (Frisia et al., 2011). Therefore, to fully understand the isotope systematics that affectδ18O andδ13C, particularly over large-amplitude climate changes, monitoring of the present-day cave environment must take place. Numerous studies are now being carried out to monitor individual caves from which speleothem records are being researched (e.g. Baldini et al., 2006; Mattey et al., 2010; Miorandi
20
et al., 2010; Sp ¨otl et al., 2005). However, current conditions are relatively stable when compared to large-amplitude climate events, such as glacial-interglacial boundaries, and therefore monitoring of a single cave will not encompass the entire range of pos-sible hydrological and geochemical conditions that are enclosed in a palaeoclimate archive from that site. Hitherto, there have been little or no studies that attempt to
un-25
derstand how the isotopic system varies under large-amplitude environmental change using cave monitoring field techniques.
CPD
8, 3613–3655, 2012Monitoring stable isotopes in caves over altitudinal
gradients
V. E. Johnston et al.
Title Page
Abstract Introduction
Conclusions References
Tables Figures
◭ ◮
◭ ◮
Back Close
Full Screen / Esc
Printer-friendly Version
Interactive Discussion
Discussion
P
a
per
|
Dis
cussion
P
a
per
|
Discussion
P
a
per
|
Discussio
n
P
a
per
|
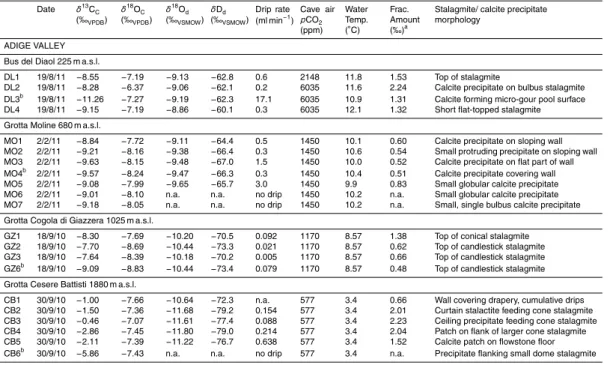
amount of monitoring was carried out in eight caves with altitudes between 225 and 1880 m a.s.l. (above sea level) in the Trentino region of North-Eastern Italy (Fig. 1). The monitoring measured changes in the cave air temperatures, cave air CO2
concen-trations, drip rate, basic hydrogeochemistry, and stable isotopes of dripwater and cor-responding calcite precipitation and petrography. This is used to assess environmental
5
changes such as the amount of cave ventilation, the state of the soil and vegetation above the cave, and the degree of kinetic fractionation occurring in each cave and at the depositing speleothems. In this study – and probably for the first time ever - data spanning an altitudinal gradient of over 1500 m are brought together for a snapshot in time, to make an assessment of these environmental changes that can affect cave
10
processes and ultimately influence the palaeoclimate record stored in the speleothems in caves at different temperatures. These are interpreted in terms of isotopic processes affecting speleothem records spanning large-amplitude environmental changes, such as glacial-interglacial transitions.
2 Study location
15
The studied caves are found within dolomite (Late Triassic Dolomia Principale) and limestone (Early Jurassic Calcari Grigi) (Table 1). Vegetation above the caves is con-trolled by the altitude and also the location of the caves (Fig. 1), whereby the area around Lake Garda receives a more Mediterranean-style climate and other parts of Trentino are temperate-humid to Alpine (high altitude) (Table 1). The present-day timber
20
line lies at 1800 m. The thickness of the rock overburden varies for the cave sites, with some having a shallow overburden (e.g. ER, GZ and CB), whereas others are deeper (e.g. BG, MO and SP). At a number of cave sites, the infiltration water is sourced from an altitude substantially higher than that of the cave entrance due to the steep moun-tainous topography; hereafter called the “infiltration elevation” (Table 1). In some cases
25
CPD
8, 3613–3655, 2012Monitoring stable isotopes in caves over altitudinal
gradients
V. E. Johnston et al.
Title Page
Abstract Introduction
Conclusions References
Tables Figures
◭ ◮
◭ ◮
Back Close
Full Screen / Esc
Printer-friendly Version
Interactive Discussion
Discussion
P
a
per
|
Dis
cussion
P
a
per
|
Discussion
P
a
per
|
Discussio
n
P
a
per
running Adige Valley and a steep E–W running Valsugana Valley. The Adige Valley hosts GZ and CB caves. In addition, DL cave is located in the (N–S) Sarca Valley that heads towards Lake Garda, just offthe Adige Valley and MO is situated in a N–S Mol-veno Lake Valley (parallel to the Adige Valley). The Valsugana Valley contains BG and ER caves with SP located on the Asiago Plateau above (Fig. 1b). FS is the only cave
5
lying at a distance from the other caves to the north of Valsugana Valley.
Mean annual air temperature recorded between 1961 and 1990 in the Adige Val-ley at Trento (312 m a.s.l.) was 12.3◦C and in Valsugana the temperature at Levico Terme (502 m a.s.l.; Fig. 1) was 11.0◦C. By contrast at high altitudes, the mean an-nual air temperature was 1.7◦C on Paganella Mountain (2125 m a.s.l) and 7.3◦C at
10
Lavarone (1155 m a.s.l.) on the Asiago Plateau (Fig. 1). Precipitation mean values were 931 mm yr−1 at Trento, 1017 mm yr−1 at Levico Terme, 729 mm yr−1 at Paganella, and 1308 mm yr−1at Lavarone (http://www.meteotrentino.it).
3 Methods
Caves were monitored during September 2010, with the exception of MO (February
15
2011) and DL that could not be entered until August 2011 due to a flooded entrance (Table 2). In addition, BG was visited on further occasions of August 2010 and Febru-ary 2012 (Table 2). Carrying out the majority of the monitoring during a single month means that the data represent a snapshot in time, and eliminates much of the tempo-ral variability, seasonal and inter-annual, often exhibited in cave data (e.g. Frisia et al.,
20
2011; Miorandi et al., 2010). During the visits, cave air temperature and cave airpCO2
concentrations were measured using a Vaisala Meter GM70 with a GMP222 probe (accuracy at 25◦C±20 ppm CO2) at numerous points along the centre of the galleries
of each of the caves, to build up a picture of the CO2 and temperature distribution in
addition to the relative strengths of the cave ventilation. Drip rates were timed using
25
CPD
8, 3613–3655, 2012Monitoring stable isotopes in caves over altitudinal
gradients
V. E. Johnston et al.
Title Page
Abstract Introduction
Conclusions References
Tables Figures
◭ ◮
◭ ◮
Back Close
Full Screen / Esc
Printer-friendly Version
Interactive Discussion
Discussion
P
a
per
|
Dis
cussion
P
a
per
|
Discussion
P
a
per
|
Discussio
n
P
a
per
|
isotopic analyses of δ18O and δD. Calcite powders were collected from beneath the corresponding drip points using a Dremel Stylus hand-held, battery operated drill with a diamond wheel point for isotopic analyses (δ18O andδ13C). On selecting drip points, only those with seemingly active (wet and bright) calcite precipitates were chosen, and milling was carried out carefully to remove only surface calcite close to the point of
5
impact.
Isotopic analyses of dripwaters and calcite powders were carried out at the University of Innsbruck, Austria using an on-line, continuous-flow system (Gasbench II) linked to a Thermofisher DELTAplusXL isotope ratio mass spectrometer. The water oxygen isotope composition was determined by equilibration with carbon dioxide and calibrated
10
against VSMOW, GISP and SLAP standards and reported on the VSMOW scale. The 1σ analytical uncertainty on δ18O values is 0.09 ‰ (Sp ¨otl et al., 2005). The calcite oxygen and carbon isotopes are reported against VPDB and are calibrated against an in-house standard that has itself been calibrated with NBS-18, NBS-19, CO-1 and CO-8 reference materials. The long-term 1σstandard deviation is 0.06 and 0.08 ‰ for
15
δ13C andδ18O, respectively (Sp ¨otl and Vennemann, 2003).
Petrographic analysis was carried out using an optical microscope and a scanning electron microscope (SEM) at the Museo delle Scienze, Trento, Italy. This allowed the observation of calcite material that had been collected under previous long-term moni-toring studies, including precipitates on glass plates and stalagmite tops.
20
4 Results
4.1 Cave air temperature andpCO2
Figure 2 shows the average air temperature (mean over 1961–1990) from meteoro-logical stations (http://www.meteotrentino.it) with the cave air temperatures measured during monitoring. As expected, the temperature decreases with altitude and in most
25
CPD
8, 3613–3655, 2012Monitoring stable isotopes in caves over altitudinal
gradients
V. E. Johnston et al.
Title Page
Abstract Introduction
Conclusions References
Tables Figures
◭ ◮
◭ ◮
Back Close
Full Screen / Esc
Printer-friendly Version
Interactive Discussion
Discussion
P
a
per
|
Dis
cussion
P
a
per
|
Discussion
P
a
per
|
Discussio
n
P
a
per
monitored caves, BG, has a greatly reduced air temperature for its given cave entrance elevation.
Cave air ventilation may have some effect on the cave temperature, but mostly only close to the entrance. However, ventilation strongly effects cave air pCO2 concentra-tions and may subsequently influence kinetic isotope effects. Figure 3 demonstrates
5
the strong increase in cave air pCO2 with decreasing altitude for most of the cave
sites. Again BG cave is an outlier to the general trend, exhibiting lowerpCO2 values than expected for its given altitude. In the highest altitude cave site monitored here, CB cave, most of the passages were at approximately atmospheric CO2 concentration,
with a slight increase in pCO2 found in a small, secluded chamber, which coincided
10
with the only, possible currently active, speleothem growth in the cave.
4.2 Cave dripwater oxygen and hydrogen isotopes
The oxygen isotope values of the dripwaters collected from caves exhibit decreasing values with increasing altitude (Fig. 4a). The two valleys show distinct isotopic char-acteristics and therefore must be treated separately when identifying patterns and
15
trends. The Adige Valley generally exhibits lower δ18O values that range between
−11.8 and −8.9 ‰, and a steeper gradient with altitude (∆δ18O/100 m=−0.15 ‰).
This is in contrast with the Valsugana Valley that generally exhibits a more constant oxygen isotope values, ranging between −10.0 and −8.4 ‰ with a shallower altitu-dinal gradient (∆δ18O/100 m=−0.08 ‰). A similar pattern is shown in the hydrogen 20
isotopes (Fig. 4b). Where the Adige Valley (−79.2 to−60.1 ‰) displays a steeper
gra-dient (∆δD/100 m=−0.92 ‰), and the Valsugana Valley (−66.8 to−54.9 ‰) exhibits a shallower gradient with altitude (∆δD/100 m=−0.52 ‰).
4.3 Petrography of calcite
Petrography of the forming speleothems is important as it can give clues of the
sat-25
CPD
8, 3613–3655, 2012Monitoring stable isotopes in caves over altitudinal
gradients
V. E. Johnston et al.
Title Page
Abstract Introduction
Conclusions References
Tables Figures
◭ ◮
◭ ◮
Back Close
Full Screen / Esc
Printer-friendly Version
Interactive Discussion
Discussion
P
a
per
|
Dis
cussion
P
a
per
|
Discussion
P
a
per
|
Discussio
n
P
a
per
|
and impurities carried in the dripwater, when these cannot be measured in ancient speleothems. Therefore, characterising the conditions at which the fabric changes from one form to another is critical when dealing with a stalagmite record containing different fabrics. In Fig. 5, fabrics from selected caves monitored during this study are shown. At low altitude, precipitates grown in DL cave show flat faces and a large crystal size (50–
5
150 µm) that would result in a columnar fabric. To reach this large crystal size, the glass plate was left in the cave for only 3 months, indicating (for this region) a relatively fast growth rate. The stalagmite Stal-SP1 from SP cave exhibits a columnar fabric (Fig. 5b). Precipitates grown on glass slides at ER cave (Fig. 5c) display irregular faces inter-rupted by macrosteps and macrokinks, which lead to lateral overgrowths and finally
10
a microcrystalline to dendritic fabric. The shallow ER cave at mid-altitude required the glass slides to be left in-situ for a whole year for enough precipitate to form to allow study. Stalagmite ER77 exhibits a change in fabric from microcrystalline to dendritic (Fig. 5d) that agrees with what would be expected from the precipitates on glass slide (Fig. 5c).
15
4.4 Oxygen and carbon isotopes of calcite
Oxygen and carbon isotopes measured on presumably active speleothem cave precip-itates exhibit values ranging from−8.84 to−6.1 ‰ and −0.5 to−11.3 ‰, respectively
(Table 2). Although a large part of the range of isotopic values is caused by the di-verse altitudes and cave settings, each cave also exhibits a spread of calcite values
20
that exceed 1 ‰ in oxygen and 5 ‰ in carbon (Fig. 6). This in-cave variability can be largely attributed to fractionation caused by rapid degassing of CO2 and calcite
pre-cipitation (Day and Henderson, 2011; Mickler et al., 2006). Therefore, in the following discussion, the least fractionated example from each cave, that with the lowest isotopic values (circled in Fig. 6), has been chosen to approximate typical cave values before
25
CPD
8, 3613–3655, 2012Monitoring stable isotopes in caves over altitudinal
gradients
V. E. Johnston et al.
Title Page
Abstract Introduction
Conclusions References
Tables Figures
◭ ◮
◭ ◮
Back Close
Full Screen / Esc
Printer-friendly Version
Interactive Discussion
Discussion
P
a
per
|
Dis
cussion
P
a
per
|
Discussion
P
a
per
|
Discussio
n
P
a
per
5 Discussion
5.1 Cave air temperature
The general trend of air temperature in the stable interior of the caves closely follows that of the mean annual air temperature (Fig. 2). However, for BG cave, and also to a lesser extent MO and FS caves, the cave air temperatures are lower than expected for
5
the given altitudes. This cooling can be explained by rapid infiltration of cold water and meltwater (in spring) that originates from much higher altitudes than the cave entrance and flows through the cave in active streamways, often flooding the main passages completely during these spring meltwater infiltration events. The very large fluxes of cold water entering BG cave causes a major cooling to the cave air temperature. BG
10
cave is similar to that of a cave situated in the deep vadose zone of the conceptual model of temperature distribution of a karst aquifer (Luetscher and Jeannin, 2004). The temperature difference between the cave air and the outside mean annual air is therefore caused by the infiltration elevation being considerably higher than the cave entrance and main passages (as in BG, FS and MO). In such cases, temperature
15
gradients can occur, causing strong ventilation (as felt in BG cave), which can affect many of the hydrological and geochemical properties of interest.
5.2 Cave airpCO2
Cave airpCO2 shows a strong trend to higher values at lower altitudes (Fig. 3). This trend is likely due to the greater CO2 production as a result of higher root respiration
20
and enhanced microbial activity found at low altitude and under thicker soil cover. Im-portantly, the thick soil cover provides a seal above the epikarst that causes a large proportion of the CO2produced to be transferred downwards, towards the cave, rather
than released into the atmosphere. In similarity to the cave air temperature (Fig. 2), BG cave does not fit the trend of the other caves, exhibiting a significantly lowerpCO2than
25
CPD
8, 3613–3655, 2012Monitoring stable isotopes in caves over altitudinal
gradients
V. E. Johnston et al.
Title Page
Abstract Introduction
Conclusions References
Tables Figures
◭ ◮
◭ ◮
Back Close
Full Screen / Esc
Printer-friendly Version
Interactive Discussion
Discussion
P
a
per
|
Dis
cussion
P
a
per
|
Discussion
P
a
per
|
Discussio
n
P
a
per
|
type on the valley slope (Table 1). This can be attributed to strong cave air ventilation (wind tube), that could easily be felt during the winter months. BG cave ventilation is enhanced by the strong temperature gradient between the cave and the outside atmo-sphere caused by the cooling from cold, high-elevation infiltration water, in addition to the large amounts of rapidly flowing water that often flood the cave and cause dramatic
5
changes in the air flow. Both MO and FS caves also exhibit slightly lowerpCO2than
expected for their altitudes, which can also be attributed to enhanced ventilation. At higher altitudes, thepCO2in the caves trends towards atmospheric values due to re-duced vegetation cover and therefore low CO2production rates, in addition to a thinning
of the soil which becomes patchy, allowing much of the CO2produced to be released
10
to the atmosphere.
5.3 Petrography
Petrography is a tool that can give an indication of saturation state and discharge vari-ability of the cave drip that formed the speleothem, along with the degree of isotopic fractionation it was exposed to during formation. The types of fabrics exhibited by
15
speleothems can be simplified into two end-members, columnar and dendritic. The columnar end-member is the more stable form and is generally considered to be pro-duced from a constant drip rate under a moderate and stable saturation state (calcite saturation index<0.5), with the degree of isotopic fractionation as either very low or extremely invariable. Conversely, dendritic fabric is often found where the drip rate is
20
flashy, the saturation state strongly fluctuates and the degree of isotopic fractionation rapidly changes (Frisia and Borsato, 2010; Frisia et al., 2000). In between these end-members, the range of fabrics include open columnar and microcrystalline (Frisia and Borsato, 2010). To some extent, these fabrics are controlled by the altitude of the caves, since there is a strong correlation between the saturation state of dripwaters and the
25
CPD
8, 3613–3655, 2012Monitoring stable isotopes in caves over altitudinal
gradients
V. E. Johnston et al.
Title Page
Abstract Introduction
Conclusions References
Tables Figures
◭ ◮
◭ ◮
Back Close
Full Screen / Esc
Printer-friendly Version
Interactive Discussion
Discussion
P
a
per
|
Dis
cussion
P
a
per
|
Discussion
P
a
per
|
Discussio
n
P
a
per
change in vegetation and reduction in soil thickness. However, the correlation of pet-rography with altitude is not very strong because other factors must also be accounted for, including the cave hydrology (e.g. drip rate), rock overburden, impurities carried in infiltrating water, slope aspect and surface vegetation.
At low altitude, precipitates grown on glass slides in DL cave show columnar
fab-5
ric with large crystal sizes (50–150 µm), where flat faces characterise the cleavage rhombohedron and ultimately determine the morphology of the crystals (Fig. 5a). The predominance of flat faces is caused by a high saturation index of the dripwaters with respect to calcite (SICC) (Borsato et al., 2007b), produced by the highpCO2in the soil
and epikarst, in addition to a low concentration of other ions and impurities (including
10
organic molecules) in the parent water. Furthermore, degassing at the top of the sta-lagmite is less intense than in other caves, due to the highpCO2of the cave air (Fig. 3).
This allows the slow, step advance, growth of the crystals, cumulating to form large flat faced crystals. Figure 5b shows a photomicrograph of the top of a stalagmite from SP cave (Stal-SP1 corresponding to drip site SP1) that was active when removed. The
15
fabric of the stalagmite is columnar, exhibiting both compact and microcrystalline sub-types (Frisia and Borsato, 2010). As in the case of DL, the columnar fabric has been formed from slow growth below a drip devoid of other ions or organic molecules that could perturb the system and thus does not exhibit dark laminae characteristic of the transport of impurities (Borsato et al., 2007a; Smith et al., 2009). However, unlike DL,
20
the SICC at SP is much lower, but importantly at both cave sites the columnar fabric
indicates that the SICC and the drip rates must have remained particularly constant
throughout the growth history. It is therefore reasonable to infer that columnar fabric in speleothems, such as SP1, reflects quasi-equilibrium deposition, although modification of the original dissolved inorganic carbon (DIC)δ13C, by degassing at the stalactite tip,
25
CPD
8, 3613–3655, 2012Monitoring stable isotopes in caves over altitudinal
gradients
V. E. Johnston et al.
Title Page
Abstract Introduction
Conclusions References
Tables Figures
◭ ◮
◭ ◮
Back Close
Full Screen / Esc
Printer-friendly Version
Interactive Discussion
Discussion
P
a
per
|
Dis
cussion
P
a
per
|
Discussion
P
a
per
|
Discussio
n
P
a
per
|
buffering the drip rate. Columnar fabric has been found in other high altitude situations, such as Milchbach cave, but again the water was sourced through a thick overburden and columnar fabric was only formed during periods of stable cave temperatures with minimal air convection and a continuous water supply, interpreted as occurring during entrance sealing during glacial advance (Luetscher et al., 2011).
5
At mid-altitude, on a NE-facing, forested slope, precipitates grown on a glass slide over a 1-yr period at ER cave under stalactite T5 (Miorandi et al., 2010) show con-siderable difference to those at DL cave (Fig. 5c). Overall, the crystals are smaller (10–25 µm) compared with DL, and their form deviates from the smooth faced rhombo-hedron. Stepped and kinked, more unstable faces are predominant. The presence of
10
macrosteps and macrokinks on the irregular faces allows for the nucleation and growth of “lateral overgrowths” (in the sense of Genty and Quinif, 1996); that is, crystals that grow at an angle relative to the larger individual, dictated by crystallographic geometry. This implies that the system may shift, if drip rate is perturbed, toward porous micro-crystalline and even dendritic fabric. This is documented in ER76 stalagmite (Scholz
15
et al., 2012) and can be seen clearly on the top of stalagmite ER77 (located close to T5), which exhibits annually laminated microcrystalline columnar fabric (bottom) grad-ing into highly porous dendritic fabric (top; Fig. 5d). The predominance of small crystals with a high density of macrosteps and macrokinks favour the nucleation of lateral over-growths, that ultimately give rise to the branching crystals of the dendritic fabric. The
20
expectation, based on this fabric type, that theδ13Ccalcite is not in equilibrium with the
DIC of the dripwater has been confirmed for ER cave, given a fractionation at the sta-lagmite tips due to degassing and equilibration with cave air of up to−4 ‰ (Frisia et al.,
2011).
At the high-altitude CB cave, the low saturation state of the infiltrating water, caused
25
CPD
8, 3613–3655, 2012Monitoring stable isotopes in caves over altitudinal
gradients
V. E. Johnston et al.
Title Page
Abstract Introduction
Conclusions References
Tables Figures
◭ ◮
◭ ◮
Back Close
Full Screen / Esc
Printer-friendly Version
Interactive Discussion
Discussion
P
a
per
|
Dis
cussion
P
a
per
|
Discussion
P
a
per
|
Discussio
n
P
a
per
and depth of overburden (except in the case of radical morphological changes such as landslides, glacial scouring or till deposition). Therefore, at a single drip site, a change in petrography will often reflect a change in temperature and climatic conditions (which we here emulate with a change in altitude).
5.4 Oxygen isotope fractionation
5
Cave analogue laboratory experiments have shown that temperature exerts a more significant influence on speleothem growth mass than drip rate (Day and Henderson, 2011). With elevated temperatures, and also slower drip rates, the same experiments also found that the δ18Ocalcite deviates further from values expected, given the par-ent water isotopic composition and cave temperature, than under cooler and faster
10
dripping conditions (Day and Henderson, 2011). Here, the important influences of tem-perature and drip rate onδ18Ocalcite fractionation are tested in the cave environment, using altitude to adjust the ambient temperature as an analogue for large amplitude climate-driven temperature changes. For each of the calcite samples, the expected
δ18Ocalcite has been calculated using the equation of Kim and O’Neil (1997) based on
15
theδ18Odrip and the temperature of the dripwater. The fractionation amount has then
been computed as the difference between the expected δ18Ocalcite and theδ18Ocalcite measured on cave precipitates. In all cases, the expectedδ18Ocalcite calculated from
Kim and O’Neil (1997) gave a lower value than the measured value of cave calcites. This indicates that with respect to the laboratory experiments, the cave precipitates
20
were always enriched in oxygen-18, which likely occurred through the process of non-equilibrium isotopic fractionation during degassing and calcite precipitation (Day and Henderson, 2011; Mickler et al., 2004, 2006). To assess the amount of fractionation occurring in the caves studied, Fig. 7a shows a histogram of the distribution of fraction-ation amount. Although this is only a small study (N=46) and our results may be
arte-25
CPD
8, 3613–3655, 2012Monitoring stable isotopes in caves over altitudinal
gradients
V. E. Johnston et al.
Title Page
Abstract Introduction
Conclusions References
Tables Figures
◭ ◮
◭ ◮
Back Close
Full Screen / Esc
Printer-friendly Version
Interactive Discussion
Discussion
P
a
per
|
Dis
cussion
P
a
per
|
Discussion
P
a
per
|
Discussio
n
P
a
per
|
precipitates was between 0.50 and 0.75 ‰ above the theoretical laboratory values of Kim and O’Neil (1997). Moreover, below a fractionation amount of 0.25 ‰, no precip-itates were found in the caves during this study. Although with a larger sampling size statistics on the tails of the distribution would be improved, the absence of any sam-ple within this band of minimal fractionation is noteworthy. It likely signifies that within
5
the vadose cave environment it is rarely, or perhaps impossible to reach the conditions of equilibrium found in the laboratory setting (Kim and O’Neil, 1997). This, therefore, infers that all subaerial speleothems are, to some extent, out of isotopic equilibrium.
A strong relationship exists between the fractionation amount and drip rate (Fig. 7b) within individual cave sites, whereby an increase in drip rate causes a decrease in the
10
amount of fractionation (i.e. the value nears the expected laboratory value). A reason-able explanation for this is that with a faster drip rate there is less time for the drip to sit at the stalactite tip, and also on the stalagmite surface, where it could undergo CO2 degassing that cause the isotopic disequilibrium. In a drier climate, evaporation of the dripwater must also be considered. However, here the relative humidity of the
15
caves was always higher than 90 % and many caves contained standing pools or flow-ing water, and thus evaporation is not considered to be a substantial contribution in comparison with CO2degassing.
The DIC-depletion and increased evaporation with elevated temperatures shown by laboratory experiments (Day and Henderson, 2011) can be tested with the cave data
20
collected here, using altitude as a method of adjusting ambient temperature. Figure 7c shows the amount of fractionation against the altitude of the cave entrance. With the exception of BG and CB caves, there is a trend towards less fractionatedδ18Ocalcitewith higher altitude, and thus lower temperatures. CB cave precipitates do not fit this trend possibly because the calcite was not active at the time of sampling or was extremely
25
slow growing and the sampling removed a layer of calcite that did not correspond to the sampled dripwater. Alternatively, the relatively low drip rate, in addition to the high ven-tilation known in the cave from thepCO2measurements, could have increased the rate
CPD
8, 3613–3655, 2012Monitoring stable isotopes in caves over altitudinal
gradients
V. E. Johnston et al.
Title Page
Abstract Introduction
Conclusions References
Tables Figures
◭ ◮
◭ ◮
Back Close
Full Screen / Esc
Printer-friendly Version
Interactive Discussion
Discussion
P
a
per
|
Dis
cussion
P
a
per
|
Discussion
P
a
per
|
Discussio
n
P
a
per
decreasing fractionation amount with altitude because (as noted in Sect. 5.1) BG cave air is cooled by high-elevation infiltrating waters, giving it an apparent air temperature of a cave between 1000 and 1400 m a.s.l. (Fig. 2). Using this air temperature-based elevation, the amount of fractionation in BG cave then becomes aligned with the alti-tudinal trend of the other caves. Overall, the conclusion that fast dripping sites in cold
5
caves would be the most suitable for carrying out palaeoclimate work, in terms of re-ducing the amount of in-cave isotopic fractionation, based on laboratory experiments (Day and Henderson, 2011), is supported here with data from cave sites spanning a range of temperatures and drip rates (Fig. 7).
Fractionation amount has been shown as sensitive to changes in temperature and
10
drip rate (M ¨uhlinghaus et al., 2009). Within a single cave site or cave chamber, factors such as temperature and ventilation are essentially constant. Therefore, in a single cave chamber the variability in the fractionation can be assumed to be due to drip rate and possibly also drip height. In this study, there is only a weak relationship between fractionation amount and drip height. Therefore, the drip rate is considered the primary
15
controlling factor for same-cave (same-chamber) fractionation effects (although drip height requires more detailed investigation). At individual cave sites, the oxygen iso-tope fractionation amount is shown to be up to approximately 1.5 ‰ (between the least and most fractionated examples), which can be attributed primarily to variations in drip rate that can span three orders of magnitude in a single cave site (Fig. 7b). However,
20
over the range of altitudes and corresponding temperatures (3–12◦C) in this study, the least fractionated examples from each cave, which can be taken as those affected just by the cave temperature and only minimally by drip rate fractionation, range in values by only 1 ‰ (Fig. 7c). A large-amplitude climate change would likely be affected by both a change in temperature and water availability. However, the sensitivity to fractionation
25
CPD
8, 3613–3655, 2012Monitoring stable isotopes in caves over altitudinal
gradients
V. E. Johnston et al.
Title Page
Abstract Introduction
Conclusions References
Tables Figures
◭ ◮
◭ ◮
Back Close
Full Screen / Esc
Printer-friendly Version
Interactive Discussion
Discussion
P
a
per
|
Dis
cussion
P
a
per
|
Discussion
P
a
per
|
Discussio
n
P
a
per
|
Calcite fractionation is often expressed as the term 1000 lnα, with field measure-ments given as the difference betweenδ18Ocalciteandδ
18
Odrip. Many different
estima-tions of this value over ranging temperature exist from laboratory and theoretical work, based on different conditions or assumptions (e.g. Chacko and Deines, 2008; Coplen, 2007; Friedman and O’Neil, 1977; Kim and O’Neil, 1997; Tremaine et al., 2011).
Fig-5
ure 7d shows that the theoretical values of Chacko and Deines (2008) are lower than the experimentally derived values of Kim and O’Neil (1997). The measurements made in the caves are still higher, with the more fractionated examples exhibiting a greater deviation (higher 1000 lnα values) from the theoretical and experimental values. The red line in Fig. 7d shows an empirical palaeotemperature curve (Tremaine et al., 2011),
10
calculated from speleothems in the literature to demonstrate typical cave water-calcite oxygen isotope fractionation. Calcite precipitates from this study widely range around this empirical speleothem line, given the variety of fractionation amount experienced by the different samples. However, the least fractionated samples plot below the lit-erature line, closer to the experimental values. This indicates that, on average, the
15
speleothems from the literature used to calculate the empirical line were slightly more fractionated than the least fractionated samples found in this study. Therefore, it is pos-sible that more could be done in terms of prior monitoring, in order to select the least fractionated samples from a cave for further study.
The approach taken in this study, to mill a small amount of calcite powder from the
20
tops of calcite speleothems and collect corresponding dripwaters, is a very simple test for isotopic fractionation in a cave. It is only minimally destructive (better still is to collect precipitates on glass slides, if precipitation rates are high and time permits) and can be used as a preliminary test to help choose which speleothems should be removed for further study. The importance of choosing a good speleothem for palaeoclimate
recon-25
CPD
8, 3613–3655, 2012Monitoring stable isotopes in caves over altitudinal
gradients
V. E. Johnston et al.
Title Page
Abstract Introduction
Conclusions References
Tables Figures
◭ ◮
◭ ◮
Back Close
Full Screen / Esc
Printer-friendly Version
Interactive Discussion
Discussion
P
a
per
|
Dis
cussion
P
a
per
|
Discussion
P
a
per
|
Discussio
n
P
a
per
low-amplitude variability and may be of a similar extent to that of the large-amplitude climate events, meaning that the significance of the oxygen isotope results would be unreliable.
5.5 Oxygen isotopes variability with altitude
Oxygen and hydrogen isotopes of cave dripwater decrease with altitude, but with
5
a steeper gradient in the Adige Valley (Fig. 4). A similar pattern is seen in the annual weighted-mean rainfall (Fig. 8) but with an offset to more enriched values (discussed below). In the more typical situation of the Adige Valley, the wider N–S orientated valley allows the easy passage of moisture to flow down and within the mountains permitting the typical altitudinal rainout pattern expected (Longinelli and Selmo, 2003). However,
10
the Valsugana is a narrow valley, oriented E–W and bounded by high mountains (be-tween 2300 and 1900 m a.s.l.). Air masses, originating from the Mediterranean Sea, travel northwards across the Po Plain before reaching the mountain barrier. Here, the air is forced upwards, and rain-out occurs steadily enriching the moisture carrying air parcel through Rayleigh fractionation. As the moisture reaches the long (E–W) crest
15
of the Valsugana Valley bounding mountains, the rain that falls at both high and low altitudes in the valley exhibits very similar isotopic compositions as there is not much differentiation in source between elevations.
In the Valsugana Valley (Fig. 8a), dripwater δ18O is slightly depleted with respect to that of the annual weighted-average rainwater value (Bert `o et al., 2005). This is
20
because infiltration occurs mainly during autumn and spring (winter snowmelt) due to evapotranspiration in summer. During these infiltration seasons, the δ18O value is lower than in summer, resulting in lower δ18Odrip than the annual weighted-average
rainwater value. This can be termed the weighting effect and should be quantifiable through the Thornthwaite method (Thornthwaite, 1948), accounting for strong
evap-25
CPD
8, 3613–3655, 2012Monitoring stable isotopes in caves over altitudinal
gradients
V. E. Johnston et al.
Title Page
Abstract Introduction
Conclusions References
Tables Figures
◭ ◮
◭ ◮
Back Close
Full Screen / Esc
Printer-friendly Version
Interactive Discussion
Discussion
P
a
per
|
Dis
cussion
P
a
per
|
Discussion
P
a
per
|
Discussio
n
P
a
per
|
over varying altitudes, latitudes and slope aspects is critical for testing the reliability of such models. For Valsugana Valley caves, their northerly aspect keeps low altitudes shaded, while the high plateau is a well-vegetated, sunny meadow, causing a relatively constant evapotranspiration rate, and thus weighting effect, over the entire altitudinal gradient. The overall slope of the rainwater (∆δ18O/100 m=−0.08 ‰) and dripwater 5
δ18O (offset by a constant weighting effect) curves is rather shallow, caused by the E– W orientation of the Valsugana Valley. Given this shallow slope and the influence of the decreasing temperature with altitude, the theoreticalδ18O value for calcite (Kim and O’Neil, 1997) anywhere in the Valsugana Valley, independent of altitude, has been cal-culated as−7.7±0.2 ‰ (Fig. 8a). This means that due to the geomorphological setting
10
and rainfall trajectories predominantly from the Mediterranean, caves of the Valsugana Valley would not be suitable for the reconstruction of palaeo-temperature changes us-ing oxygen isotopes.δ18O measured on calcite precipitates in the Valsugana Valley caves, however, exhibit a slightly negative trend with altitude. This is caused by the amount of isotopic fractionation that, as shown in Sect. 5.4, decreases with altitude
15
and thus reduces with a lowering of the cave temperature. The affect of this reduction in fractionation at higher altitudes causes the measured calcite to resemble the original source water.
In the Adige Valley (Fig. 8b), the situation is different due to its N–S orientation. The meteoricδ18O trend follows a steeper (∆δ18O/100 m=−0.22 ‰) and more typical 20
slope, with altitude. The cave dripwater again exhibits lower values due to autumn and (winter) spring infiltration via the weighting effect. However, the cave dripwater does not run parallel to the rainwater but tends towards the rainwater slope at high altitude. This is caused by higher evapotranspiration occurring at low altitudes, particularly in the Mediterranean climate around DL cave, and by reduced evapotranspiration at high
25
CPD
8, 3613–3655, 2012Monitoring stable isotopes in caves over altitudinal
gradients
V. E. Johnston et al.
Title Page
Abstract Introduction
Conclusions References
Tables Figures
◭ ◮
◭ ◮
Back Close
Full Screen / Esc
Printer-friendly Version
Interactive Discussion
Discussion
P
a
per
|
Dis
cussion
P
a
per
|
Discussion
P
a
per
|
Discussio
n
P
a
per
around 1 ‰. Therefore, this effect needs to be more carefully accounted for in cave monitoring studies so that it can be effectively included and tested for in oxygen isotope enabled, rainwater-forced, dripwater-stalagmite models (e.g. Wackerbarth et al., 2012), particularly where cave sites of varying altitudes and latitudes are modelled.
The calculatedδ18Ocalciteof the Adige Valley exhibits a curved trend due to the strong
5
influence of temperature on the water isotopes and the cave air. The measured cave
δ18Ocalciteexhibits a similar trend to that calculated but with a deviation to slightly higher
values at low altitudes due to the greater fractionation (Fig. 7). Overall, the change in oxygen isotopes measured in cave calcite over the altitude range of the Adige Valley exceeds the minimal changes in isotopic fractionation. Therefore, at well-chosen drip
10
sites, changes in temperature associated with climate variability should be recognis-able, and possibly quantifirecognis-able, in theδ18O speleothem record.
However, one outlier CB cave δ18Ocalcite has a higher value than expected for its
altitude. This is possibly due to strong fractionation of this sample and, as discussed in Sect. 5.4, may be caused by the calcite not being active or being extremely slow
grow-15
ing. Moreover, the slow growing nature of the CB calcite (and also calcite at certain drip points in other caves) may have meant sampling removed a considerable num-ber of years of growth from the top of the speleothems. Long-term monitoring in the region has shown that substantial seasonal and inter-annual variability in δ18O can be seen in the rainwater and cave dripwater, caused by differing trajectories and
cli-20
mate settings, such as North Atlantic Oscillation (Scholz et al., 2012). For example, monitoring of GZ cave has shown a period whereδ18Odrip were considerably higher
during the years 2002 (−9.2±0.2 ‰) and 2003 (−9.2±0.2 ‰) owing to a lack of
win-ter snowfall (Frisia et al., 2007), compared with measurements taken during this study (−10.3±0.1 ‰, Table 2). In GZ cave, growth rates on the candlestick shaped
stalag-25
CPD
8, 3613–3655, 2012Monitoring stable isotopes in caves over altitudinal
gradients
V. E. Johnston et al.
Title Page
Abstract Introduction
Conclusions References
Tables Figures
◭ ◮
◭ ◮
Back Close
Full Screen / Esc
Printer-friendly Version
Interactive Discussion
Discussion
P
a
per
|
Dis
cussion
P
a
per
|
Discussion
P
a
per
|
Discussio
n
P
a
per
|
to this period of enriched source water. Although the method presented here is quick to gain results, and can thus be used to rapidly identify speleothems for further study, cau-tion is required when comparing the speleothem calcite with the dripwater, as there is no assurance that they are comparable. For an improved accuracy, precipitates grown on glass slides are recommended. However, in slow growing sites such as the cool
5
Alpine caves studied here, as much as a year or mores growth may be needed to ac-quire enough material to make one isotopic analysis, which is not suitable for a rapid reconnaissance study.
5.6 Carbon isotopes of speleothem calcite
Cave calcite carbon isotope values exhibit a strong increasing pattern with altitude
10
(Fig. 9a). The reason for this is likely that at low altitude, the rich vegetation and thick soil coverage gives a strongly negative, biogenicδ13C signal. Whereas at high altitude, the cooler conditions permit only sparse vegetation and a thin, patchy soil cover caus-ing aδ13C signal that is much closer to that of the atmosphere with a small contribution from the bedrock. As previously discussed (Sect. 5.2), the thicker soil at low altitudes
15
acts as a trap, forcing a larger amounts of CO2downwards into the epikarst and aquifer,
rather than being released into the atmosphere, enhancing the cave airpCO2 at low
altitudes (Fig. 3). In Fig. 9b, the caves with higher cave airpCO2also exhibits calcite precipitates with lighter13C values, indicating a predominance of biogenic sourced car-bon from the soil. Whereas at low altitudes, the calciteδ13C signal is a combination
20
of atmospheric, soil-biogenic and bedrock carbon that has been modified by in-cave fractionation processes (Frisia et al., 2011).
Theoretical experiments have shown that in-cave isotopic fractionation caused by elevated temperatures and higher dripwaterpCO2would result in higherδ13C values of the precipitated calcite (M ¨uhlinghaus et al., 2009). However, such a relationship would
25
CPD
8, 3613–3655, 2012Monitoring stable isotopes in caves over altitudinal
gradients
V. E. Johnston et al.
Title Page
Abstract Introduction
Conclusions References
Tables Figures
◭ ◮
◭ ◮
Back Close
Full Screen / Esc
Printer-friendly Version
Interactive Discussion
Discussion
P
a
per
|
Dis
cussion
P
a
per
|
Discussion
P
a
per
|
Discussio
n
P
a
per
Conversely, forced degassing of dripwater due to cave ventilation has been shown to cause enhanced kinetic C-isotope fractionation, resulting in13C enrichment in calcite precipitates (Frisia et al., 2011; Sp ¨otl et al., 2005). Ventilation is especially strong in CB cave, which hosts many entrances at different altitudes and a strong seasonal variability in temperature, in addition to those caves with active running water, including DL, BG,
5
MO, FS and SP. Therefore, C-isotope fractionation is likely caused by forced degassing and is thus expected to exhibit some seasonal variability and correlation with drip rate (Frisia et al., 2011; Sp ¨otl et al., 2005). It is possible that this type of forced degassing fractionation is stronger at higher elevations, due to the stronger seasonal variability in temperatures and saturation state of drip water. Such an increase in fractionation at
10
high elevation would enhance the relationship in Fig. 9a, seemingly causing a stronger connection betweenδ13C and altitude (temperature).
Calcite from Bigonda cave (BG) consistently shows higher δ13C values than ex-pected given its altitude (Fig. 9a). This is due to the water feeding the BG drips being sourced from a much higher altitude than the cave entrance, also seen in Figs. 2 and
15
3 of cave temperature and pCO2. The δ 13
C signal is picked up from where the wa-ter infiltrates the bedrock, which according to Fig. 9a is around 1000 m a.s.l However, the temperature of the cave water indicates that the infiltration water derives from ap-proximately 1700 m a.s.l. (Fig. 2), while cave airpCO2 is low due to strong ventilation
(Fig. 3). The oxygen isotopes cannot be used to resolve this discrepancy because of
20
the setting in the Valsugana Valley causing littleδ18O change with altitude (Sect. 5.5). Therefore, it is suggested that the dripwater for this part of the cave only is sourced from around 1000 m a.s.l., on the mountain slope, based on theδ13C vegetation sig-nal. However, the cave also receives a large amount of infiltration from higher altitude that acts as a cooling system to the extensive network of passages. Theδ13C values
25
CPD
8, 3613–3655, 2012Monitoring stable isotopes in caves over altitudinal
gradients
V. E. Johnston et al.
Title Page
Abstract Introduction
Conclusions References
Tables Figures
◭ ◮
◭ ◮
Back Close
Full Screen / Esc
Printer-friendly Version
Interactive Discussion
Discussion
P
a
per
|
Dis
cussion
P
a
per
|
Discussion
P
a
per
|
Discussio
n
P
a
per
|
5.7 Implications for speleothem-based palaeoclimate studies
In this study, caves distributed along a steep altitudinal gradient have been used to mimic the temperature change observed over large-amplitude climate events. Fraction-ation of the oxygen isotope signal can be a large problem (Mickler et al., 2006). Even in the least fractionated speleothem samples, the smallest amount of oxygen isotope
frac-5
tionation is on the order of 0.25 ‰ (Fig. 7), compared with laboratory measurements (Kim and O’Neil, 1997). This isotopic fractionation can obscure a temperature signal or information on the original composition of the dripwater. However, when interpreted correctly it could provide alternative climatic information such as amount of ventilation affecting the cave. In agreement with laboratory studies (Day and Henderson, 2011),
10
the data presented here supports the relationship showing a decrease in the amount of oxygen isotope fractionation with a reduction in temperature or an increase in the drip rate. Therefore, in general, cool and fast dripping cave sites lacking strong ventilation should be most suitable for palaeoclimate reconstructions, as they will be least affected by kinetic fractionation.
15
Of interest here, however, is what will happen in terms of isotopic fractionation and petrography over a large-amplitude climate change that would affect cave air tempera-ture,pCO2and outside soil and vegetation. For oxygen isotopes, the predominant
driv-ing force causdriv-ing the climate-related isotopic shift must be considered. As an example of two end-member environmental situations, we extrapolate our findings to consider
20
caves where the oxygen isotope composition is dominated by rainfall changes through the amount effect, such as those in monsoon regions (e.g. Wang et al., 2001), and alternatively caves whereδ18O is controlled by temperature changes. During a warm and humid climate period, such as an interstadial, a rainfall (amount effect)-dominated cave would record a relatively lowδ18O signal (compared with a cool and dry period),
25
CPD
8, 3613–3655, 2012Monitoring stable isotopes in caves over altitudinal
gradients
V. E. Johnston et al.
Title Page
Abstract Introduction
Conclusions References
Tables Figures
◭ ◮
◭ ◮
Back Close
Full Screen / Esc
Printer-friendly Version
Interactive Discussion
Discussion
P
a
per
|
Dis
cussion
P
a
per
|
Discussion
P
a
per
|
Discussio
n
P
a
per
such as columnar. If the cave temperature was high, the fractionation amount may be higher. However, in the case of many Asian monsoon caves, the cave air temperature is relatively low, 8–9◦C at Sanbao Cave (Cheng et al., 2009) and 15.4◦C at Hulu Cave (Wang et al., 2001). Therefore, a low to average fractionation amount can be expected during warm periods causing only slight enrichment of the oxygen isotope signal.
Con-5
versely, under a cooler and drier climate, a rainfall-dominated cave would exhibit a high
δ18O signal that would be affected by fractionation, due to drying of the drip sites and a lowering of the drip rate, causingδ18O enrichment to even heavier values. Although the temperature would cool, it is unlikely to cool to an extent large enough to signifi-cantly lower the fractionation amount (steep part of Fig. 7c). The highδ18O would likely
10
be accompanied by a change in fabric to a disequilibrium form, such as dendritic, due to cooler temperatures and therefore a lower SICCand possibly a flashy drip rate, that
could augment the fractionation further. Overall, in a rainfall-dominated speleothem record, the in-cave oxygen isotope fractionation shifts the signal in the same direction as the climate-related change, thus amplifying the apparent climate signal.
15
This is in contrast to caves where the oxygen isotope records are dominated by temperature. Warm climates tend to cause highδ18O values in meteoric precipitation and hence in the dripwater (Fig. 8; in comparison with cool climates). A speleothem record would then be modified by an average amount of in-cave fractionation based on warm but relatively wet conditions with a columnar fabric. The overall shift under
20
the warm climate in a temperature-dominated environment is to slightly higher δ18O values. Under cool and dry climates, the temperature-dominated speleothem records lowδ18O values (in comparison with warmer climates). These are then modified by an average to high amount of fractionation on account of the water stress. The cool and dry climate will cause a lower and fluctuating drip rate, eventually enriching the calcite
25
CPD
8, 3613–3655, 2012Monitoring stable isotopes in caves over altitudinal
gradients
V. E. Johnston et al.
Title Page
Abstract Introduction
Conclusions References
Tables Figures
◭ ◮
◭ ◮
Back Close
Full Screen / Esc
Printer-friendly Version
Interactive Discussion
Discussion
P
a
per
|
Dis
cussion
P
a
per
|
Discussion
P
a
per
|
Discussio
n
P
a
per
|
opposite direction, and therefore, strong changes in fractionation could mask climate and environmental signals from oxygen isotopes.
Carbon isotopes in speleothem calcite are dominated by the vegetation signal and relationship with soilpCO2(Fig. 9). Under warm humid climates, such as interstadials,
theδ13C values will be low due to a greater biogenic contribution. Moreover, there will
5
be relatively little fractionation due to fast drip rates and therefore a shorter time for de-gassing at the stalactite tip. By contrast, during cool and dry climate periods, such as stadials, theδ13C values will increase due to reduced vegetation and microbial activity in the soil, and therefore a lower biogenic contribution. Drying will cause a reduction in the drip rate that will enhance forced degassing and thus cause a higher amount of
10
fractionation, increasing theδ13C values further. Therefore, fractionation ofδ13C val-ues works in the same direction as the climate change, to apparently amplify the signal. This is possibly the reason why the carbon isotope signature can, in some cases, be more successfully interpreted than the oxygen isotope signal (e.g. Genty et al., 2006; Hodge et al., 2008; Scholz et al., 2012), especially where the latter is dominated by
15
temperature. Nonetheless, the carbon isotope signature can be complicated by the dif-ferent proportions of C3: C4plants in certain regions of the world and under particular climate conditions. Furthermore, the fractionation on carbon isotopes is enhanced by forced degassing, which is greater under conditions of high seasonality. Certain peri-ods of Earth history, such as those with high obliquity, for example during the Eemian
20
(e.g. Felis et al., 2004), are thought to exhibit high seasonal contrast. Therefore, such periods may produce higherδ13C values than expected, given the vegetation and soil coverage, due to enhanced seasonal temperature changes causing increased ventila-tion and thus greater degassing and more fracventila-tionaventila-tion.
6 Conclusions
25
CPD
8, 3613–3655, 2012Monitoring stable isotopes in caves over altitudinal
gradients
V. E. Johnston et al.
Title Page
Abstract Introduction
Conclusions References
Tables Figures
◭ ◮
◭ ◮
Back Close
Full Screen / Esc
Printer-friendly Version
Interactive Discussion
Discussion
P
a
per
|
Dis
cussion
P
a
per
|
Discussion
P
a
per
|
Discussio
n
P
a
per
calcite isotopic composition. In agreement with laboratory experiments (Day and Hen-derson, 2011), oxygen isotope fractionation was found to decrease in cooler caves under faster dripping stalactites. However, under the very cool temperature conditions required for minimal oxygen isotope fractionation (≤0.25 ‰), a large-amplitude climate
change could risk imposing periods of water stress, due to ice and snow build-up, or
5
undersaturation with respect to calcite. Such conditions would impose drip rate fluc-tuations causing greater isotopic fractionation or periods of non-deposition (hiatuses). Whereas, in a warmer temperate environment, although the oxygen isotope fraction-ation due to temperature will be slightly larger, the possible variability of drip rate is lower, resulting in lower overall fractionation amounts spanning large-amplitude climate
10
changes and little risk of hiatuses. Furthermore, in rainfall-dominated environments, such as monsoon areas, in-cave fractionation tends to work in the same direction as the climate influence, strengthening the apparent signal. However, in temperature-dominated environments, the oxygen isotope record is likely complicated by in-cave fractionation that shifts in the opposite direction to the climate influence. In-cave
frac-15
tionation of the carbon isotope tends to shift in the same direction as the climate change, and therefore in certain cases where there are no further complications from varying C3: C4proportions, the δ
13
C record may provide an alternative climate proxy. Since many factors contribute to the amount of fractionation affecting calcite isotope composition and the speleothem fabric, individual caves and drip sites must be studied
20
in detail to gain an understanding of these controlling influences. Although much can be learned from theoretical modelling and controlled laboratory experiments, they are no substitute for monitoring in the real cave environment.
Acknowledgements. This work have been carried out within the INTCLIM project co-funded by the European Commission under the 7th Framework Programme Marie Curie Actions Scheme 25
CPD
8, 3613–3655, 2012Monitoring stable isotopes in caves over altitudinal
gradients
V. E. Johnston et al.
Title Page
Abstract Introduction
Conclusions References
Tables Figures
◭ ◮
◭ ◮
Back Close
Full Screen / Esc
Printer-friendly Version
Interactive Discussion
Discussion
P
a
per
|
Dis
cussion
P
a
per
|
Discussion
P
a
per
|
Discussio
n
P
a
per
|
References
Baldini, J. U. L., McDermott, F., and Fairchild, I. J.: Spatial variability in cave drip water hy-drochemistry: implications for stalagmite paleoclimate records, Chem. Geol., 235, 390–404, 2006.
Bert `o, A., Borsato, A., Frisia, S., Miorandi, R., and Zardi, D.: Monthly isotopic signal of the 5
precipitated water in the Province of Trento: Lagrangian analysis and discussion of measure-ments, in 28th International Conference on Alpine Meteorology, Vol. 40, 432–435, Croatian Meteorological Journal, Zadar, Croatia, 2005.
Boch, R., Cheng, H., Sp ¨otl, C., Edwards, R. L., Wang, X., and H ¨auselmann, Ph.: NALPS: a pre-cisely dated European climate record 120–60 ka, Clim. Past, 7, 1247–1259, doi:10.5194/cp-10
7-1247-2011, 2011.
Borsato, A., Frisia, S., Jones, B., and Van der Borg, K.: Calcite moonmilk: crystal morphology and environment of formation in caves in the Italian Alps, J. Sediment. Res., 70, 1171–1182, 2000.
Borsato, A., Frisia, S., Fairchild, I. J., Somogyi, A., and Susini, J.: Trace element distribution 15
in annual stalagmite laminae mapped by micrometer-resolution X-ray fluorescence: implica-tions for incorporation of environmentally significant species, Geochim. Cosmochim. Ac., 71, 1494–1512, 2007a.
Borsato, A., Miorandi, R., Corradini, F., and Frisia, S.: Idrochimica delle acque ipogee in Trentino: specie, variabilit `a stagione, gradiente altitudinale e implicazioni per gli studi 20
climatico-ambientali da speleotemi, Studi Trentini di Scienze Naturali, Acta Geologica, 82, 123–150, 2007b.
Chacko, T. and Deines, P.: Theoretical calculation of oxygen isotope fractionation factors in carbonate systems, Geochim. Cosmochim. Ac., 72, 3642–3660, 2008.
Cheng, H., Edwards, R. L., Broecker, W. S., Denton, G. H., Kong, X. G., Wang, Y. J., Zhang, R., 25
and Wang, X. F.: Ice age terminations, Science, 326, 248–252, 2009.
Coplen, T. B.: Calibration of the calcite-water oxygen-isotope geothermometer at Devils Hole, Nevada, a natural laboratory, Geochim. Cosmochim. Ac., 71, 3948–3957, 2007.
Day, C. C. and Henderson, G. M.: Oxygen isotopes in calcite grown under cave-analogue con-ditions, Geochim. Cosmochim. Ac., 75, 3956–3972, 2011.