Artigo
*e-mail: [email protected]
SPECTROPHOTOMETRIC METHOD FOR DETERMINATION OF ATAZANAVIR SULFATE IN CAPSULE DOSAGE FORM
Anindita Behera*, Swapan Kumar Moitra and Sudam Chandra Si
School of Pharmaceutical Sciences, Siksha ‘O’ Anusandhan University, Bhubaneswar, Orissa, India Dannana Gowri Sankar
Pharmaceutical Analysis and Quality Assurance Division, College of Pharmaceutical Sciences, Andhra University, Visakhapatnam, Andhra Pradesh, India
Recebido em 19/11/10; aceito em 2/4/11; publicado na web em 10/6/11
Two sensitive and simple spectrophotmetric methods were developed for determination of Atazanavir Sulfate in capsule dosage form. The irst method was based on the oxidative coupling of ATV with 3-Methyl Benzothiazolin-2-one hydrazone (MBTH). The resulting green product had λmax of 627.3 nm and was stable for 2 h. The second method was based on the reaction between diazotized drug with N-(1-napthyl)ethylenediamine dihydrochloride (NEDA) in neutral medium to yield yellowish orange product which had λ
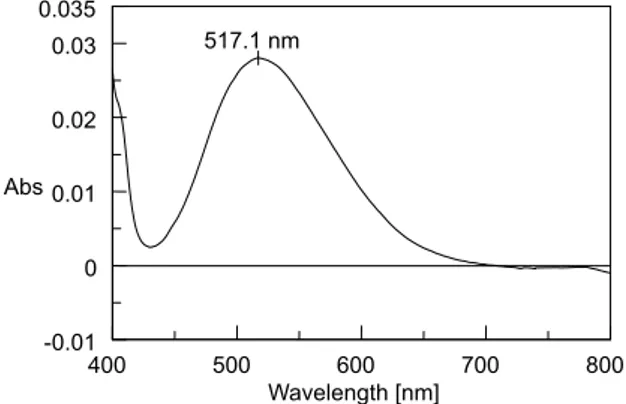
max of 517.1 nm. The product was stable for 4 h. Both methods were highly reproducible and had been applied to pharmaceutical preparations.
Keywords: Atazanavir sulphate; 3-Methyl Benzothiazolin-2-one hydrazone; N-(1-napthyl) ethylenediamine dihydrochloride.
INTRODUCTION
Atazanavir Sulfate (ATV) methyl N′ [(1S)1{N[(2S,3S)2 h y d r o x y l 3 [ ( [(1S)1{N[(2S,3S)2 S ) [(1S)1{N[(2S,3S)2 [ ( m e t h o x y c a r b o n y l ) a m i n o ] 3 , 3 -dimethylbutanamido]-4-phenylbutyl]-N′-{[4-(Pyridin-2-yl) phenyl] methyl}hydrazine carbonyl}-2,2-dimethyl propyl]carbamate (Figure 1), an azapeptide is the 7th Protease Inhibitor1 used in the treatment of human immunodeiciency virus (HIV) Type II infection. ATV is re-ported as poorly water soluble and a known substrate for both hepatic metabolizing enzyme Cytochrome 450 (CYP3A) and intestinal drug eflux pump, P-glycoprotein (Pgp) so have low oral bioavailability.2 So co-administration of small dose of Ritonavir (RTV) is recommended as booster. This new drug is oficial in IP - 2010, but not included in BP or USP. The reported analytical methods for the determination of ATV are based on high performance liquid chromatography (HPLC)3-12 in biological samples like blood plasma, biological cells, cerebrospinal luid (CSF) and blood serum. Stress degradation studies were reported analysed by HPLC and ultraviolet spectrophotometry.13, 14 The present work was aimed to develop a visible spectrophotometric method, which is simple, sensitive, accurate and cost effective to evaluate the quality of the bulk and pharmaceutical formulations.
The novelties of the developed methods are that the reagents used in both the methods are easily available and the mechanisms of reactions of the reagents are already well established. The reactions involved with these reagents are simple, rapid and sensitive. Spectro-photometric methods involve simple instrumentation which is cost effective as compared to other instrumental techniques. The present method involves the determination of ATV, which is a second line drug for treatment of type II HIV infection. Still now, the 2nd line drugs are available at higher price, than the 1st line drugs. The high cost of the formulations is due to high cost of development and cost of analysis. The growing demand of analysing the drugs by a cost-effective method inspired the development of the present methods. The methods are based on (i) the oxidative coupling reaction of the drug with 3-Methyl Benzothiazolin-2-one hydrazone (MBTH) and (ii) the coupling reaction between the diazotized drug and N-(1-napthyl) ethylenediamine dihydrochloride (NEDA) in neutral medium. These methods have advantage of sensitivity, selectivity, rapidity and low cost of analysis.
EXPERIMENTAL
A JASCO model V - 630 UV-Visible spectrophotometer with 1.0 cm matched cells was used. ATV (99.8% pure) (Gift sample from Cipla, India), MBTH (Himedia, India), NEDA (SD Fine – Chem, India), ferric chloride (AR), sodium nitrite (AR), methanol (AR) and hydrochloric acid (AR) were used. Double distilled water was used to prepare all the solutions. Capsule dosage forms were purchased from local market.
Solutions
mL for method B (NEDA) were prepared by further dilution. A 0.5% aqueous solution of MBTH and 0.2% aqueous solution of NEDA were prepared freshly. 1% solution of ferric chloride, 4% solution of sodium nitrite, 10% solution of hydrochloric acid and 0.2% solution of ammonium sulfamate were prepared freshly.
Procedure
For Method A, aliquots of the working standard solution of ATV (10-120 µg/mL) were transferred into 10 mL calibrated volumetric lask. 1.8 mL of 1% ferric chloride was added, shaken well, kept aside for 5 min. Then 1.8 mL of 0.5% MBTH solution was added and shaken well which results in formation of a green coloured chromogens. The volume was made up by double distilled water. The absorbance of the chromogen was measured at 627.3 nm against the reagent blank and standard calibration curve was plotted.
For method B, aliquots of the working standard solution of ATV (1-10 µg/mL) were transferred to 10 mL volumetric lasks. 1.5 mL of 10% hydrochloric acid was added cooled in an ice bath and added 1.5 mL of 4% sodium nitrite solution. The solutions were cooled for 5 min in the ice bath with occasional swirling. Then the volumetric lasks were kept out at room temperature. 2 mL of 0.2% ammonium sulfamate solution was added and made up to the mark with double distilled water. The absorbance of chromogen was measured at 517.1 nm against the reagent blank and standard calibration curve was plotted.
Procedure for the assay of the drug in pharmaceutical formulation
Twenty capsules were accurately weighed. An equivalent amount of 10 mg of the drug was taken and dissolved in methanol; volume was made up to 100 mL. Then the sample solution was iltered through Whatman ilter paper no. 41. The sample solution was treated in the same manner for both the methods.
RESULTS
In method A, the drug was allowed to react with MBTH in pre-sence of ferric chloride in neutral medium. In method B, the drug was diazotized in acidic medium and then coupled with NEDA in neutral aqueous medium.
Optical characteristics
The absorption spectra of green coloured product of ATV and MBTH had λ
max 627.3 nm and the yellowish orange product of ATV and NEDA had λmax 517.1 nm. The absorption spectra are shown in Figures 2 and 3. The wavelengths were used for the validation of the methods. The reagent blanks have no interference.
Optimization of reagent concentration
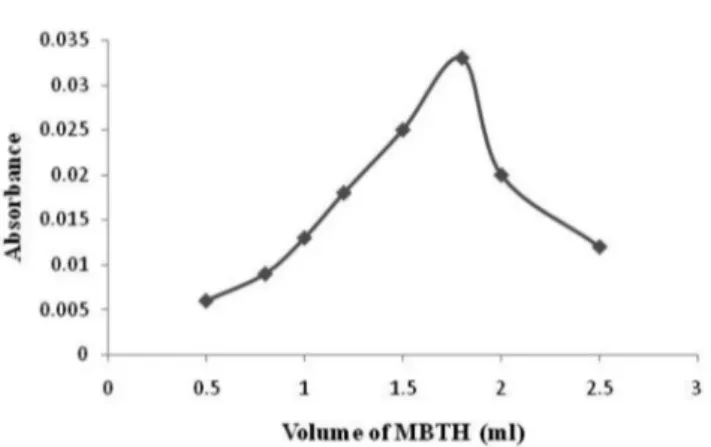
For method A, concentration and volume of ferric chloride were optimized by taking concentration of 0.5-2.0% of ferric chloride and volume of 0.2-2.5 mL. For ferric chloride 1% concentration of 1.8 mL volume gave the satisfactory colour. MBTH concentration from 0.1-1.0% and volume of 0.5-2 mL were optimized for maximum colour. 0.5% concentration of 1.8 mL of MBTH was found suitable for chromogen formation which was stable for 2 h (Figure 4).
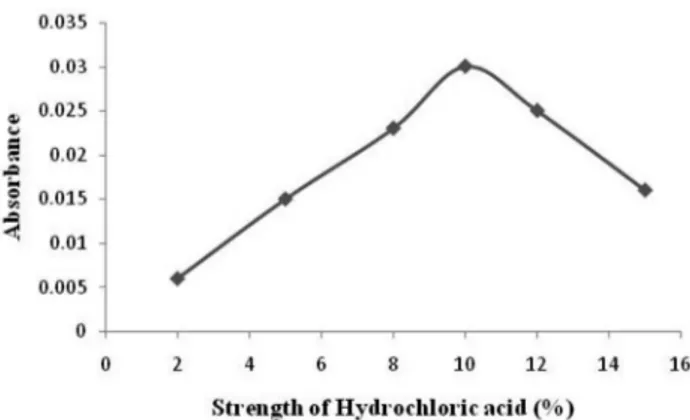
For method B, concentration and volume of hydrochloric acid, sodium nitrite and ammonium sulfamate were optimized. 2-15% v/v solution of hydrochloric acid was used in the volume range of
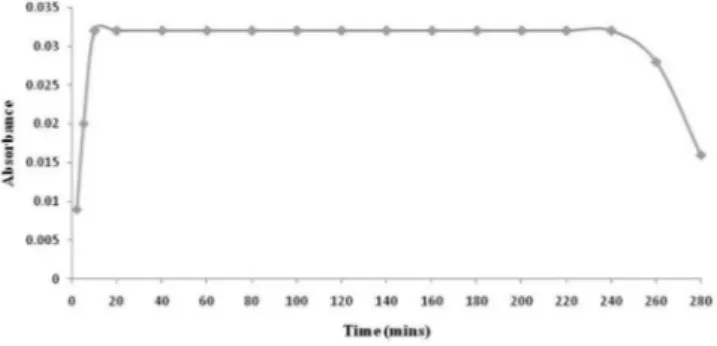
0.5-3.0 mL. 10% v/v hydrochloric acid of 1.5 mL was suitable for the colour development. 1-5% of sodium nitrite of volume 0.5-3.0 mL and 0.1-0.5% w/v of ammonium sulfamate of volume 0.5-5 mL was tested. 1.5 mL of 4% w/v sodium nitrite and 2 mL of 0.2% ammonium sulfamate were satisfactory for the development of the maximum colour intensity of the chromogens. The colour of the chromogen was stable for 4 h (Figure 5).
Required concentration and volume of the reagents were used for the above procedures. For method B, ammonium sulfamate was used to remove the excess nitrite after diazotization. Ammo-nium sulfamate has no effect on the extent of colour development of the chromogens. The dilutions of the coloured solution after coupling with NEDA, many solvents were tested like methanol, ethanol, acetonitrile, glacial acetic acid and acetone. But dilution with water gave the maximum intensity of the colour and stability of the colour.
Figure 2. Visible absorption spectrum of MBTH-ATV. Chromogen showing absorption maxima at 627.3 nm
Figure 3. Visible absorption spectrum of NEDA- hydrolyzed ATV chromogen showing absorption maxima at 517.1 nm
Quantiication
In method A, ATV obeys the Beer’s law over the range of 10-120 µg/mL and 1-10 µg/mL for method B. The procedures were validated by various optical parameters, listed in Table 1. The linearity of the method was calculated by using regression equation Y = mX + c, where Y represents the absorbance, X represents the concentration of the drug in µg/mL and ‘m’ and ‘c’ represent the slope and intercept respectively. Accuracy of the methods was done by recovery study. Precision was done by inter-day and intra-day study. Standard de-viation, limit of detection (LOD) and limit of quantiication (LOQ) were calculated for each method.
Figure 5. Effect of time on stability of chromogen produced by reaction of ATV with NEDA
Table 1. Optical characteristics of Method A and B
Parameters Method A
(ATV + MBTH)
Method B (ATV + NEDA)
λmax (nm) 627.3 517.1
Colour Green Yellowish Orange
Stability (h) 2 4
Beer’s law range (µg/mL) 10 -120 1-10
Limit of detection (µg/mL) 10.07 0.36
Limit of quantiication (µg/mL) 30.50 1.10
Molar absorptivity (l mol-1 cm-1) 6.87 x 10³ 2.11 x 10³
Sandell’s sensitivity (µg cm -2) 0.1025 0.0333
Regression equation [Y = mX +c]
Slope (m) 0.001 0.021
Intercept (c) 0.0846 0.089
Correlation coeficient (r) 0.999 0.998
Reaction sequence
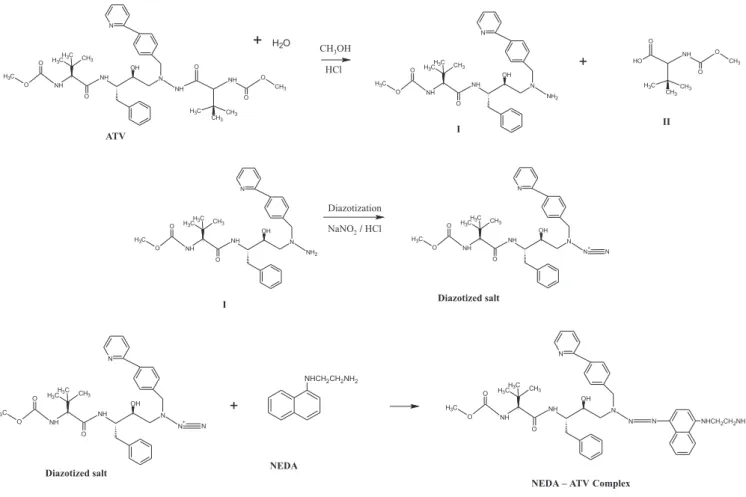
ATV reacts with MBTH by oxidative coupling method. In presence of ferric chloride MBTH oxidises to an electrophilic in-termediate by losing two electrons and a proton, which is an active coupling species. The electrophilic intermediate undergoes electro-philic substitution with ATV to form a green coloured chromogens having λmax at 627.3 nm. In method B, as ATV contains a secondary amine group, diazotization was impossible. But when methanolic solution of ATV was allowed to react with hydrochloric acid, it formed hydrolyzed product I and II.15 The hydrolyzed product react with sodium nitrite to form a diazotized salt. The diazotization was conirmed by starch iodide paper which turned blue after complete diazotization. The diazotized hydrolyzed - ATV couples with NEDA to form a yellowish orange chromogens having λ
max at 517.1 nm. The proposed reaction mechanisms for both the methods are shown in Schemes 1 and 2 respectively.
Stability
Stability of both the chromogens was studied. The green product formed due to the oxidative coupling of MBTH with ATV, attained the maximum colour after 10 min and was stable up to 2 h, shown in Figure 4. Similarly the yellowish orange chromogen formed by the coupling of the diazotized ATV and NEDA attained the maximum colour after 10 min and was stable up to 4 h, shown in Figure 5. Reproducible results were found in both the methods irrespective of any temperature change. Both the reactions are quite feasible at room temperature.
Accuracy and precision
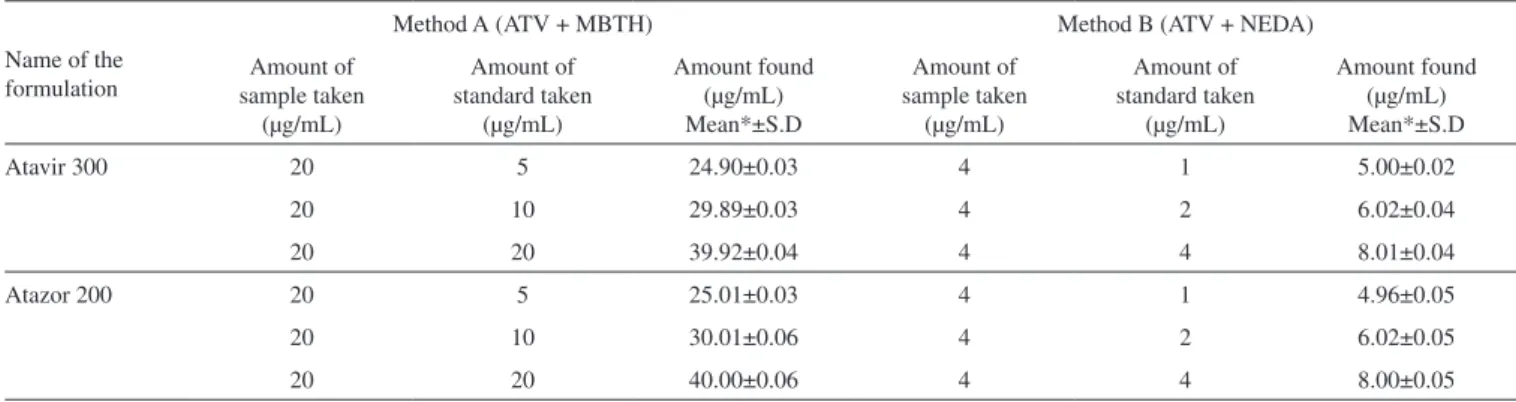
Accuracy of both the methods was done by recovery study by standard addition method. Standard drug was added to pre-analysed solution of formulations at the level of 25, 50 and 100%. Lower value of standard deviation signiies the accuracy of the methods. Precision was evaluated by mean ± S.D of inter-day and intra-day assay. Speciicity and selectivity
Both the methods were done in presence of excipients and changing the reaction conditions slightly. In presence of excipients, no interference was found. The reaction conditions were varied like change of reaction medium, variation in strength and volume of reagents altered the results, which signiies the selectivity of the methods.
DISCUSSION
From the above results and comparison between two methods, the Method B was found to be more sensitive than Method A. Me-thod B can be used for critical evaluation of raw materials of active pharmaceutical ingredients (API) before manufacturing of formu-lations and also when there are changes in methods and materials during the manufacturing of formulations. Method A can be used for routine quality control of bulk and inished formulations. The choice of method for estimation of active ingredient in formulation should be based on the simplicity and cost of the analysis. The HPLC method should be a method of choice where it involves the assay of the drugs as well as identiication and quantiication of the related substances present in the API and the inished formulation. But the pharmacopoeal method for the estimation of ATV utilizes HPLC method only for the estimation of the drug itself. Hence it is opined that a more selective and sensitive UV-Visible spectrophotometric method would be a better choice for the estimation of the drug (ATV) in capsule formulation.
Table 2. Assay of ATV in pharmaceutical formulations
Name of the formulation Label claim (mg)
Amount of drug found (mg) Mean* ± S.D
Method A (ATV + MBTH)
Method B (ATV + NEDA)
Atavir 300 300 300.98 ± 0.7 298.08 ± 0.2
Atazor 200 200 200.63 ± 0.6 200.99 ± 0.6
*Mean of 5 determinations Scheme 2
CONCLUSION
Table 3. Accuracy of the method (Recovery study)
Name of the formulation
Method A (ATV + MBTH) Method B (ATV + NEDA)
Amount of sample taken
(µg/mL)
Amount of standard taken
(µg/mL)
Amount found (µg/mL) Mean*±S.D
Amount of sample taken
(µg/mL)
Amount of standard taken
(µg/mL)
Amount found (µg/mL) Mean*±S.D
Atavir 300 20 5 24.90±0.03 4 1 5.00±0.02
20 10 29.89±0.03 4 2 6.02±0.04
20 20 39.92±0.04 4 4 8.01±0.04
Atazor 200 20 5 25.01±0.03 4 1 4.96±0.05
20 10 30.01±0.06 4 2 6.02±0.05
20 20 40.00±0.06 4 4 8.00±0.05
*Mean of 5 determinations
Table 4. Precision of the methods
Name of the formulation Intra-day precision (n =5) Mean*(mg) ± S.D Inter-day precision (n = 3) Mean*(mg) ± S.D Method A (ATV + MBTH) Method B (ATV + NEDA) Method A (ATV + MBTH) Method B (ATV + NEDA)
Atavir 300 300.5 ± 0.6 300.1 ± 0.6 299.3 ± 0.5 299.1 ± 0.3
Atazor 200 200.9 ± 0.5 201.0 ± 0.6 200.6 ± 0.6 200.2± 0.4
*Mean of 5 determinations
SUPPLEMENTARY MATERIAL
Available at http://quimicanova.sbq.org.br, in PDF ile, with free access.
ACKNOWLEDGEMENT
The authors are thankful to Siksha ‘O’ Anusandhan University for providing the research facility to carry out the present work. REFERENCES
1. Fukushima, K.;Terasaka, S.;Haraya, K.;Kodera, S.;Seki, Y.; Wada, A.; Ito, Y.;Shibata, N.; Sugioka, N.; Takada, K.; Biol. Pharm. Bull.2007,
30, 733.
2. Perloff, E. S.; Duan, S. X.; Skolnik, P. R.; Greenblatt, D. J.; von Moltke L. L.; Drug Metab. Dispos. Biol. Fate Chem.2005, 33, 764.
3. Robledo, V. R.; Smyth, W .F.; Anal. Chim. Acta2008, 623, 221. 4. Fayet, A.; Beguin, A.; de Tejada, B. M.;Colombo, S.; Cavassini, M.;
Gerber, S.;Eap, C. B.; Telenti, A.; Buclin, T.; Biollaz, J.; Decosterd, L. A.;Ther. Drug. Monit.2008, 30, 511.
5. Cattaneo, D.; Maggiolo, F.; Ripamonti, D.; Perico, N.; J. Chromatogr. Sci.2008, 46, 485.
6. D’Avolio, A.; Siccardi, M.; Sciandra, M.; Lorena, B.; Bonora, S.; Trentini, L.; di Perri, G.; J. Chromatogr., B: Anal. Technol. Biomed. Life Sci. 2007, 859, 234.
7. Jung, B. H.; Rezk, N. L.; Bridges, A. S.;Corbett, A. H.; Kashuba, A. D. M.; Biomed. Chromatogr.2007, 21, 1095.
8. ter Heine, R.; Alderden-Los, C. G.;Rosing, H.; Hillebrand, M. J. X.; van Gorp, E. C. M.; Huitema, A. D. R.; Beijnen, J. H.;Rapid. Commun. Mass. Spectrom.2007, 21, 2505.
9. Weller, D. R.; Brundage, R. C.;Balfour Jr., H. H.;Vezina, H. E.; J. Chromatogr., B: Anal. Technol. Biomed. Life Sci. 2007, 848, 369. 10. Loregian, A.; Pagni, S.; Ballarin, E.; Sinigalia, E.; Parisi, S.G.;Palu, G.;
J. Chromatogr., B: Anal. Technol. Biomed. Life Sci. 2006, 42, 500. 11. Crommentuyn, K. M. L.; Huitema, A. D. R.; Beijnen, J. H.; J. Pharm.
Biomed. Anal. 2005, 38, 139.
12. Colombo, S.; Beguin, A.; Telenti, A.; Biollaz, J.; Buclin, T.; Rochat, B.; Decosterd, L.A.; J. Chromatogr., B: Anal. Technol. Biomed. Life Sci.
2005, 819,259.
13. Seshachalam, U.; Rao, D. V. L. N.; Haribabu, B.; Chandrasekhar. K. B.;
Chromatographia2007, 65, 355.
14. Dey, S.; Reddy, Y. V.; Reddy, T.; Sahoo, S. K.; Murthy, P. N.; Mohapatra, S.; Patro, S. S.; Int. J. Pharm. Bio. Sci. 2010, 1,1.
Supplementary Material
*e-mail: [email protected]
SPECTROPHOTOMETRIC METHOD FOR DETERMINATION OF ATAZANAVIR SULFATE IN CAPSULE DOSAGE FORM
Anindita Behera*, Swapan Kumar Moitra and Sudam Chandra Si
School of Pharmaceutical Sciences, Siksha ‘O’ Anusandhan University, Bhubaneswar, Orissa, India Dannana Gowri Sankar
Pharmaceutical Analysis and Quality Assurance Division, College of Pharmaceutical Sciences, Andhra University, Visakhapatnam, Andhra Pradesh, India
Figure 1S.Optimization of strength of ferric chloride for maximum colour development of the chromogen
Figure 2S. Optimization of volume of ferric chloride for maximum colour development of the chromogen
Figure 3S. Optimization of strength of MBTH for maximum colour develo-pment of the chromogen
Figure 5S.Optimization of strength of hydrochloric acid for maximum colour development of the chromogen
Figure 6S.Optimization of volume of hydrochloric acid for maximum colour development of the chromogen
Figure 7S.Optimization of strength of sodium nitrite for maximum colour development of the chromogen
Figure 8S.Optimization of volume of sodium nitrite for maximum colour development of the chromogen
Figure 9S.Optimization of strength of ammonium sulfamate for maximum colour development of the chromogen