Ar
ti
go
*e-mail: [email protected]
SELECTIVE AND NON-EXTRACTIVE SPECTROPHOTOMETRIC DETERMINATION OF CEFDINIR IN FORMULATIONS BASED ON DONOR-ACCEPTOR COMPLEX FORMATION
Babita K. Singh* e Dilip V. Parwate
Department of Chemistry, RTM Nagpur University Campus, Nagpur, India Seema Srivastava
Central Forensic Science Laboratory, Ramanthapur, Hyderabad, India Sudhir. K. Shukla
Central Forensic Science Laboratory, Chandigarh, India
Recebido em 29/9/09; aceito em 22/3/10; publicado na web em 30/7/10
Cefdinir has broad spectrum of activity and high prescription rates, hence its counterfeiting seems imminent. We have proposed a simple, fast, selective and non-extractive spectrophotometric method for the content assay of cefdinir in formulations. The method is based on complexation of cefdinir and Fe under reducing condition in a buffered medium (pH 11) to form a magenta colored donor-acceptor complex (λ
max = 550 nm; apparent molar absorptivity = 3720 L mol
-1 cm-1). No other cephalosporins, penicillins and common
excipients interfere under the test conditions. The Beer’s law is followed in the concentration range 8-160 µg mL-1.
Keywords:cefdinir; donor-acceptor complex; spectrophotometry.
INTRODUCTION
Due to counterfeiting, the drug quality has become a source of major concern worldwide, particularly in many developing coun-tries. The most commonly counterfeited drugs are anti-infectives or antibiotics. Use of poor quality antibiotics bears serious health implications such as treatment failure, adverse reactions, drug re-sistance, increased morbidity, and mortality.1 Among antibiotics, cephalosporins are much recently introduced, widely prescribed and costlier. Therefore, incentive to produce their counterfeits because of proit margin increases considerably.
Cefdinir is a third-generation cephalosporin. It has broad spec-trum of activity, excellent therapeutic action against susceptible bacteria, and relatively high price. The oficial monograph of the drug is presently available only in Japanese Pharmacopoeia (2001). The oficial method for the content assay is a gradient elution RP-HPLC method. In literature, some other RP-HPLC methods have been reported for the analysis of cefdinir in formulations,2,3 biological samples,4 and few methods also offer separation of drug from related impurities.5,6 Liquid chromatography electrospray io-nization tandem mass spectrometry has been reported for analysis of the drug in human plasma7 and environmental samples.8 Other methods of analysis available in the literature are based on square wave stripping voltammetry,9 differential pulse voltammetry10 and spectroluorimetry.11 These sophisticated instrumental methods are not suitable for counterfeit drug assay as they are expensive and cannot be used in the ield. A simple, inexpensive, selective and rugged visible spectrophotometric would be more appropriate for the analysis of counterfeits. The spectrophotometric methods reported in the literature for the analysis of cefdinir are based on UV measurement,12-14 a method involving oxidation of cefdinir with excess of bromosuccinimide and estimating unreacted N-bromosuccinimide either with celestine blue or p-N-Methyl amino phenol sulfate - sulfanilamide,15 a method based on reduction of ferric ion with cefdinir and complexation of resultant ferrous ions with 1, 10-phenanthroline to form a blood-red chromogen,16 and
reaction of cefdinir with Folin-Ciocalteu reagent under alkaline condition to from a blue colored chromogen.14,16 The UV spec-trophotometric method, although sensitive, are not suitable for the analysis of counterfeits due to lack of selectivity. All visible spectrophotometric methods reported are indirect and lack selec-tivity because a third generation cephalosporin ceixime, which is structurally similar to cefdinir, has been reported to form identical chromogens in presence of ferric: 1,10-Phenanthroline17 and Folin-Ciocalteu under alkaline condition.18
In this study, we have developed a selective non-extractive visible spectrophotometric method based on the formation of donor-acceptor complex between cefdinir and Fe. The complex has an intense magenta color. The optimum pH and other conditions for the formation of complex were determined. The proposed method offers high selectivity as even ceixime do not interfere with the estimation.
EXPERIMENTAL
Apparatus
The spectrophotometric measurements were made on Cintra 10e UV-visible spectrophotometer (GBC, Australia).
Reagents
dissolved in water and its pH was adjusted to 11 with 0.1 N NaOH using a calibrated pH meter (Elico, India). The inal volume of the buffer was made up to 500 mL.
Method validation
Calibration plot
To different aliquots (0.05 to 1 mL) of cefdinir stock solution 1 mL dithionite, 2 mL phosphate buffer (pH 11; 0.1M) and 0.5 mL ferrous ammonium sulfate were added and inal volume was adjusted to 5 mL with deionised water. The solutions were allowed to stand for 20 min and later absorbances were measured at 550 nm against a reagent blank prepared in the same manner.
Tablet analysis and recovery study
Twenty tablets were inely powdered. An amount of tablet equi-valent to 20 mg of cefdinir was weighed accurately and transferred to a 50 mL volumetric lask. The powder was dissolved in 1 mM NaOH by mechnaical shaking or sonication for 10 min. After dissolution, the solution iltered using Whatman 41 ilter paper, this is the stock solution of the tablet sample. To 0.5 mL of this stock solution 1 mL dithionite, 2 mL phosphate buffer (pH 11; 0.1M) and 0.5 mL ferrous ammonium sulfate were added; the inal volume was made 5 mL with deionised water. The measurement was performed on six replicates using the general procedure.
The tablet sample was spiked separately with the working stan-dard of cefdinir corresponding to 100 and 200% label claim, and then analyzed by the procedure described for the tablet analysis. This is done to check for the recovery of the drug at different concentration levels in formulations.
Characterization of complex
Job’s and Mole ratio method for determining stoichiometry of complex
The stoichiometry of complex was determined by both Job’s method and Mole ratio method. A 0.01 M dithionite solution and phosphate buffer (pH 11; 0.1M) were employed in both the methods. In case of Job’s method, a 1.25 mM standard solution of cefdinir and 1.25 mM solution of ferrous ammonium sulfate were used. A series of solutions was prepared in which the total volume of cefdinir and ferrous ammonium sulfate was kept 2 mL, but their proportion was varied between 1:19 and 19:1. To all the systems 2 mL phos-phate buffer and 1 mL sodium dithionite were added and the general procedure was followed.
A 1.25 mM standard solution of cefdinir and 0.125 mM ferrous ammonium sulfate solution were used in mole ratio method. A series of solutions was prepared, in which 2 mL of ferrous ammonium sulfate was used throughout, but the volume of cefdinir was varied to get Fe:Cefdinir ratio between 1:0.25 to 1:10. To all systems 1 mL sodium dithionite and 2 mL phosphate buffer were added. The inal volume was adjusted to 5 mL with water. Thereafter, the general procedure was followed.
Spectroscopic studies for structure determination
The complex species formed is highly polar and cannot be extracted with organic solvents. In order to accomplish extrac-tion, K2CO3 was used as “salting-out” agent. An excess of K2CO3 decreases activity of “free” water, this allows use of ethanol as extractant.19 The crystalline product obtained is stable over a week when stored in the dark. In sunlight, the complex decomposes readily in a day as determined by the diffuse relectance measu-rement made on the complex.
Mössbauer spectroscopy
The Mössbauer instrument is locally fabricated by Nucleonix, India. The instrument has a gas illed proportional counter as detector and it has 512 channel analyser. The crystalline sample was powdered and screened through 100 mesh sieve. The sample was sealed in the sample holder with a cellophane ilm. The measurement was made in transmission geometry at the room temperature. The calibration was performed with natural α-Fe. The experimental data obtained was evaluated by Lorentzian curve itting.
Electron proton resonance spectroscopy
The ESR (Electron spin resonance) measurement was performed on a Varian E-112 spectrometer using X-band microwave frequency with the sensitivity of 5×10¹⁰ spins. The ESR spectrometer settings for the study were as follows: Modulation frequency = 100 kHz; modulation amplitude = 1 Gauss, microwave frequency = 9.1 GHz, microwave power = 5 mW, receiver gain = 2×10³.
RESULTS AND DISCUSSION
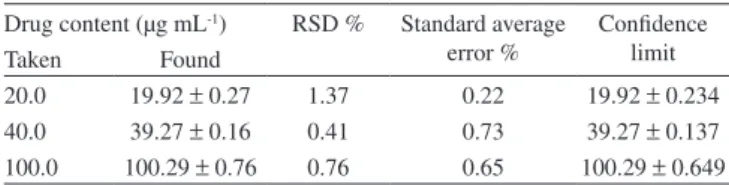
Cefdinir is known to be interfered by Fe supplements, which sometimes may render red or pink color to urine and stools. The appearance of color is due to the formation of a stable complex be-tween ferrous ion and cefdinir. In the proposed method, cefdinir has been shown to form an intense magenta complex with Fe in alkaline medium under reducing conditions having absorption maxima at 550 nm (Figure 1A).
Stability of complex
The results of kinetic study indicate that the time required to reach equilibrium of complexation reaction is 20 min. The complex is stable up to 50 min as there is 5% reduction in absorbance at 60 min. Therefore, all measurements were carried out between 20 and 50 min. The fading of color of the complex on prolonged standing is due to alkaline hydrolysis of cefdinir.
Selection of reducing agent
Due to fast oxidation of ferrous to ferric in presence of sunlight, the stability of complex is affected. Thus, some reducing agent is required to enhance the stability of complex. Various reducing agents viz stannous chloride, thiomalic acid and sodium dithionite served the purpose. Sodium dithionite was found most suitable as it has suficient reducing action in the neutral and alkaline condition. Stannous chlo-ride is readily soluble in highly alkaline solution, but it has limited solubility at pH ≤ 11. To estimate optimum dithionite concentration required to circumvent oxidation of Fe II various systems containing Fe: dithionite in the mole ratio between 1:1 and 1:100 were prepared. The stability was maximum when the Fe:dithionite mole ratio lies in the range 1:5 to 1:50. For further studies, we ixed the Fe: dithionite mole ratio at 1:40 because at this level dithionite effectively reduces ferric to ferrous as well as eliminate Fe(OH)2 precipitation that might cause deviation due to dispersion of light.
Effect of pH
formation completes before deprotonation of oxime, the development of bright and intense magenta color occurs only after deprotonation of oxime group.
The anion in buffer solution may interfere as Fe II complexes with many inorganic anions. Therefore, the stability of complex was assessed in various buffer solutions of pH 11 viz 0.05 M Borax/ 0.1 M NaOH (1:1, v/v), 0.1 M NaHCO3/ 0.091 M NaOH (1:1, v/v), 0.1 M Na2HPO4/0.0164 M NaOH (1:1, v/v) and a pH 12 buffer solution of 0.1 M KCl/ 0.012 M NaOH (1:1, v/v). The stability of complex was not affected by carbonate, phosphate or chloride anions furnished by the respective buffers. For further study, pH 11 phosphate buffer was employed.
Selectivity
The selectivity of the method for cefdinir under experimental condition is most remarkable as no other cephalosporins, congener penicillins and excipients commonly formulated with the drug inter-fere with the estimation.
Usually, cephalosporins and pencillins complex with Fe through N and S donors on dihydrothiazine and thioazolidene rings res-pectively, but such complexes have very low stability. According to our hypothesis, the complexation in cefdinir is mainly due to presence of oxime function, and N on thiazole ring is also involved. The resultant complex species is considerably stable. Behavior of other cephalosporins possesing thiazole ring viz ceixime, cefetamet and cefempidone, but differing from cefdinir in the sense that they possess caroboxymethoxy imino, methoxy imino and oxopyrrolidin-3-yloxyimino groups respectively, instead of oxime group have been tested. None of them formed color complex with Fe, thus upholding the validity of our hyothesis.
The excipients like starch, cellulose, lactose, titanium dioxide, polyethylene glycol and magnesium sterate, which are commonly formulated with cefdinir do not interfere.
Quantitative analysis
Under the experimental conditions described earlier, the stan-dard calibration curve was plotted. The concentration of the complex exhibited linear relationship with absorbance, and the regression analysis on Beer’s law plot revealed good correlation (r = 0.9993). The Beer’s law range, Ringbom range, molar absorptivity, Sandell’s sensitivity and other statistical parameters were calculated, and provided in Table 1. The method is suficiently sensitive for the analysis of cefdinir.
Method validation
The samples of pure drug were prepared and tested at three concentration levels (20, 40 and 100 µg mL-1) of cefdinir using the proposed spectrophotometric method. The complete set of validation assay was performed. The results obtained for pure drug are given in Table 2. The precision and accuracy were determined by performing six replicate measurements at each concentration level. The relative standard deviation, standard average error and conidence limit (95% level) were calculated (Table 2). The method is suficiently accurate and precise for quantitation purpose.
Tablet analysis and recovery study
Two different brands of tablet samples were analysed. The pro-posed method when used for extraction and subsequent estimation of cefdinir from tablets after spiking with 100 and 200% of the drug working standard afforded recovery of 99.11 to 101.32%. The results shown in Table 3 conirmed that there is no loss of drug during sample solution preparation and the method is not liable to interference by excipients usually formulated with cefdinir. The proposed method is sensitive, selective, and simple in terms of reagent requirement and methodology. Therefore, it is convenient for the quantitative analysis of both pure drug and tablet formulations.
Characterization of complex
The results of Job’s and mole ratio method are shown in Figure 1C and 1D respectively. A single maxima in Job’s method plot and two straight intersecting portions in mole ratio curve indicate that a single complex species is formed in the binary system and its composition is Fe:Cefdinir = 1:2. The value of overall stability constant determined from the Job’s method plot is 1.5 × 10⁹ L2 mole-2.
The zero ield Mössbauer spectrum recorded (Figure 2) at the room temperature gives isomer shift, δ = 0.32 mm s-1 (w.r.t α-Fe) and quadrapole splitting, |∆E
Q| = 1.54 mm s
-1. This indicates presence of ferric species in octahedral high spin 3d(t2g)3(e
g)
2 coniguration.20 Further, `the ESR measurement made on the complex has a single line (g = 1.9778). The single line is due to -1/2 to +1/2 transition, other ine structure lines were not visible. The g value is very close to free spin value and isotropic indicating presence of Fe3+ (d5) in a cubic
Table 1. Optical characteristics, regression analysis, accuracy and precision of the proposed method for the analysis of cefdinir
Parameters Observed values
λ
max (nm)
Beer’s law limit (µg mL−1)
Ringbom concentration rangea (µg mL−1)
Apparent molar absorptivity (L mole−1 cm−1)
Sandell’s sensitivity (µg cm−2 per 0.001 absorbance unit)
LOD (µg mL−1)
LOQ (µg mL−1)
Standard deviation % Range of error %
Linear regression equation (A = mC + b ) Slope or speciic absorptivity (m) Intercept (b)
Correlation coeficient (r)
550 8-160 17-70 3720 0.108 0.56 1.71 0.66 ± 2.2 0.0093 0.0462 0.9993
aFor ilter photometric analysis
Table 2. Evaluation of accuracy and precision of the proposed method for the analysis of cefdinir (n = 6)
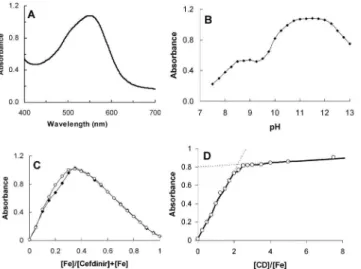
Drug content (µg mL-1) RSD % Standard average
error %
Conidence limit Taken Found
20.0 19.92 ± 0.27 1.37 0.22 19.92 ± 0.234 40.0 39.27 ± 0.16 0.41 0.73 39.27 ± 0.137 100.0 100.29 ± 0.76 0.76 0.65 100.29 ± 0.649
Table 3. Tablet analysis and recovery study (n = 6) Pharmaceutical
formulation
Taken (µg mL-1)
Standard added (µg mL-1)
Examined drug, found
(µg mL-1)
RSD % Recovery % Ocepha (300 mg/tablet)
40 0 39.64 ± 0.16 0.40 99.11 40 79.65 ± 0.73 0.92 100.02 80 119.53 ± 0.60 0.50 99.85 Kefnirb
(300 mg/tablet)
40 0 40.14 ± 0.39 0.97 100.35 40 80.37 ± 0.89 1.11 100.57 80 121.19 ± 0.37 0.30 101.32
Figure 2. Zero ield 57Fe Mössbauer spectrum of cefdinir and Fe complex
recorded at room temperature in transmission geometry. The solid line through data was obtained by lorentzian curve itting
Figure 3. Complexation between cefdinir and Fe; pH dependence of complex
structure and color
ield. The ESR result corroborates with the indings of Mössbauer spectrum analysis. The negative deviation of g value from free spin value indicates that the metal ligand bond has fair amount of covalent nature.21 The revelation that oxidation state of Fe is 3+ in the complex is conlicting with our presumption. According to our presumption, the oxidation state of Fe is 2+ in the complex, which is justiied by the fact that under the highly reducing condition created by adding dithionite the existence of ferric species is improbable. However, if we assume that after complexation the Fe donates one electron to O (through N) on oxime function, then the ESR and Mössbauer spectroscopic behavior holds consistent with our presumption. The validity of this assumption is strengthened by the fact that the molar absorptivity of complex is 3720 L mole-1cm-1, which can only be due to donor-acceptor complex formation because the absorption band due to forbidden d-d transition are very weak. The proposed structure of complex and its formation scheme is shown in Figure 3.
CONCLUSIONS
The proposed method is simple, fast and at the same time fairly
accurate and precise. With these virtues, it is suitable for quantitation of drugs in counterfeit formulations. The chemicals and reagent requi-rement is minimal. The quantitative assay in ield can be accomplished with a simple ilter photometer. The selectivity of test for cefdinir under the given condition is most remarkable, as none of the cephalosporins including ceixime, congener penicillins and excipients would inter-fere. The only apparent limitation is due to the stability of reagents as ferrous ammonium sulfate slowly oxidizes and dithionite decomposes in presence of sunlight. However, this limitation can be overcome by either storing reagents in the dark or by using freshly prepared reagents.
ACKNOWLEDGMENTS
The authors thank Head, Department of Chemistry, RTM Nagpur University for providing laboratory facilities. The authors thank Prof. C. Bansal, School of Physics, University of Hyderbad for Mössbauser spectroscopic measurment and SAIF, IIT Mumbai for recording ESR spectrum. One of the authors Ms. Babita Singh want to thank Central Forensic Science Laboratory, Directorate of Forensic Science, Minis-try of Home Affairs, Hyderabad, India for providing her fellowship.
Figure 1. Formation of cefdinir-Fe complex: A) Visible absorption spectrum
REFERENCES
1. United States Pharmacopeia Drug Quality and Information Program. 2004. A review of drug quality in Asia with focus on anti-infectives, United States Pharmacopoeia, Drug Quality and Information Program 1-46.
2. Sankar, D. G.; Priya, K. D.; Krishna, M. V.; Latha, P. V. M.; Acta Ciencia Indica2004, 30, 273.
3. Gandhimathi, M.; Suganthi, A.; Ravi, T. K.; Pattasseril, M. B.; Indian J. Pharm. Sci.2004, 66, 248.
4. Hadad, G. M.; Emara, S.; Mahmoud, W. M. M.; Chromatographia2009, 70, 1593.
5. Mehta, T. N.; Subbaiah, G.; Pundarikakshudu, K.; J. AOAC Int.2005, 88, 1661.
6. Okamoto, Y.; Itoh, K.; Namiki, Y.; Matsushita, J.; Fujioka, M.; Yasuda, T.; J. Pharm. Biomed. Anal.1996, 14, 739.
7. Chen, Z. J.; Zhang, J.; Yu, J. C.; Cao, G. Y.; Wu, X. J.; Shi, Y. G.; J. Chromatogr., B: Anal. Technol. Biomed. Life Sci. 2006, 834, 163. 8. Nageswara Rao, R.; Venkateswarlu, N.; Narsimha, R.; J. Chromatogr.,
A2008, 1187, 151.
9. Jain, R.; Radhapyari, K.; Jadon, N.; J. Electrochem. Soc. 2007, 154, F199.
10. Tao, F.; Yu, Z.; Han, X.; Zheng, S.; Dong, S.; Yaowu Fenxi Zazhi2008, 28, 1512.
11. Suganthi, A.; Shrikumar, S.; Pattesseril, M. B.; Umamaheswari, M.; Ravi, T. K.; Indian J. Pharm. Sci. 2004, 66, 689.
12. Sankar, D. G.; Sudarshan, M.; Krishna, M. V.; Latha, P. V. M.; J. Inst. Chem. (India) 2005, 77, 5.
13. Patil, S. S.; Kasture, P. V.; Indian Pharmacist2008, 7, 110.
14. Shah, P. B.; Pundarikakshudu, K.; Indian J. Pharm. Sci. 2004, 66, 665. 15. Srinivas, L. D.; Prasad Rao, K. V. S.; Sastry, B. S.; Int. J. Chem. Sci.
(India) 2005, 3, 353.
16. Sankar, D. G.; Surekha, M. L.; Krishna, M. V.; Latha, P. V. M.; Int. J. Chem. Sci. (India) 2005, 3, 499.
17. Al-Momani, I. F.; J. Pharm. Biomed. Anal.2001, 25, 751.
18. Sankar, D. G.; Sushma, K.; Lakshmi, R. V.; Reddy, M. N.; Murthy, T. K.; Rao, S. Y.; Indian Drugs2001, 38, 617.
19. Karger, B. L.; Synder, L. R.; Horvath, C.; An Introduction to Separation Science, Wiley: USA, 1973.
20. Huynh, H. H; Kent, T. A In Advances in Mössbauer Spectroscopy; Thosar, B. V.; Iyengar, P. K., eds.; Elsevier, 1983.