Article
Printed in Brazil - ©2016 Sociedade Brasileira de Química0103 - 5053 $6.00+0.00*e-mail: [email protected]
Voltammetric Determination of Ethionamide in Pharmaceutical Formulations and
Human Urine using a Boron-Doped Diamond Electrode
Bruno R. L. Ferraz,* Fernando R. F. Leite, Bruna L. Batista and Andréa R. Malagutti
Departamento de Farmácia, Universidade Federal dos Vales do Jequitinhonha e Mucuri, 39100-000 Diamantina-MG, Brazil
This work reports a simple and low cost voltammetric approach comprising a boron-doped diamond electrode (BDDE) to determine the antibiotic ethionamide (ETO). Cyclic voltammetry studies revealed that ETO exhibits an irreversible reduction peak at −0.95 V and an irreversible oxidation peak at +1.4 V onto BDDE (vs. saturated Ag/AgCl reference electrode) in Britton-Robinson buffer solution (pH 5.0, 0.1 mol L−1). Different voltammetric scan rates (from
10 to 150 mV s−1) suggested that the reduction of ETO on the BDDE surface is a diffusion-controlled
process. Square wave voltammetry (SWV) optimized conditions showed a linear response to ETO from 1.00 to 80.0 µmol L−1 (R2 = 0.998) with a limit of detection of 0.294 µmol L−1 and
limit of quantification of 0.980 µmol L−1. The developed square wave voltammetric method was
successfully used in the determination of ETO in human urine and pharmaceutical formulation. The ETO quantification results in pharmaceutical tablets obtained by SWV-BDDE were comparable to those found by official analytical protocols.
Keywords: ethionamide, square wave voltammetry, boron-doped diamond electrode, antitubercular drugs
Introduction
Ethionamide (ETO, 2-ethylpyridine-4-carbothiamide; Figure 1) is an oral bacteriostatic antibiotic used for
treatment of tuberculosis (TB).1 It has been an important
second line drug in the therapy of drug-resistance
tuberculosis (MDR-TB) caused by Mycobacterium
tuberculosis, which has become resistant to the first line
anti-tuberculosis drugs, such as isoniazid and rifampicin.2,3
ETO is almost fully metabolized by the liver, being only approximately 5% of the antibiotic excreted in an unaltered
form in the urine.4 However, the minimum dose of ETO
to inhibit the growth of M. tuberculosis is sufficiently
high to cause grave side effects, including gastrointestinal disorders, hepatotoxicity, neurotoxicity, cardiovascular
effects, endocrine effects and skin reactions.4 The duration
of the treatment of MDR-TB is usually from two to four years, and requires the use of second-line drugs that are less effective and often poorly tolerated, especially by patients with a weakened immune system, leading to high
recurrence rates and mortality.3
In this context, the development of a reproducible, sensitive and reliable analytical method to determine ETO in biological fluids and pharmaceutical formulations has been crucial to monitor the efficacy of the MDR-TB treatment and also to ascertain whether a drug has the proper content of active substance. To date, some analytical
methodologies, such as spectrophotometry,5,6 fluorimetry7,8
and high-performance liquid chromatography (HPLC)9-13
have been applied to quantify ETO in pharmaceutical formulations and body fluids or tissues after its intake.
Electrochemical techniques have also been applied for the determination of anti-tuberculosis drugs by using
a variety of chemically modified electrodes.14-16 Such
have reported the use of electrochemical methods
for ETO detection.17,18 Iwamoto and Osteryoung17
used a rotating silver disc electrode to determine five thioamides (thiocetamide, thiourea, thionicotinamide, thiosemicarbazide and ethionamide) by cathodic stripping voltammetry. The ETO showed stripping
reduction peak at ca. −0.77 V vs. saturated calomel
electrode (SCE) in borate buffer solutions (pH 9.2,
0.1 mol L−1). The authors demonstrated that the
thioamides exhibit sharp stripping peaks in acetate
buffer solution (pH 4.6, 0.1 mol L−1), but the sensitivity
of the disc electrode to these analytes decreased. They also showed that in alkaline solutions, thiomides are unstable and tend to suffer hydrolysis. A linear range for
ETO from 0.09 to 60 µmol L−1 was obtained. In another
study, Jain et al.18 reported the use of a voltammetric
sensor based on zirconia nanoparticles deposited onto glassy carbon electrodes for ETO quantification. The voltammetric behavior of ETO was investigated by cyclic voltammetry (CV) and square wave voltammetry (SWV) techniques, using sodium lauryl sulphate (0.1%) as an anionic surfactant. It was shown that the electrode process is controlled by diffusion. A linear range
from 150 to 650 ng mL−1 and a limit of detection of
47.6 ng mL−1 were obtained in that study.
Although the mentioned works achieved such significant results, the effectiveness of the electrode sensors in detecting ETO in biological fluids and pharmaceutical formulations was not demonstrated. A comprehensive search in literature revealed that the use electrochemical sensors for quantification of ETO in pharmaceutical formulations and bodily fluids has not been reported yet. Thus, the objective of the present work was to investigate the electrochemical behavior of ETO on a boron-doped diamond electrode (BDDE) and to develop an electroanalytical methodology to quantify this antibiotic. The electroanalysis using BDDE is a fast, inexpensive and very sensitive procedure. BDDE is also particularly attractive for a wide range of electrochemical applications owing to its long-term stability, inert surface for absorption of reaction products, good resistance to passivation, high chemical stability, lower residual current and broad electrochemical window in aqueous medium, which allows the quantification of electroactive species
without interference of water decomposition.19-24
Due to these advantages, BDDE have been successfully used in electroanalytical determinations of pharmaceutical
compounds.25-29 However, to the best of our knowledge,
this is the first time that an electrochemical sensor based on BDDE is applied to the quantification of ETO in a pharmaceutical formulation and human urine.
Experimental
Reagents and solutions
Ethionamide was purchased from Sigma-Aldrich®
(St. Louis, USA). A stock solution of ETO (1.0 mmol L−1)
in 10% ethanol aqueous solution (99.5%; Proquimios, Rio de Janeiro, Brazil) was prepared and stored in a refrigerator at 4-6 °C. The Britton-Robinson buffer solution
(BRBS, 0.1 mol L−1) was prepared by mixing equimolar
amounts of phosphoric acid (85.0%; Dinamica, Diadema, Brazil), acetic acid (99.8 %; Proquimios, Rio de Janeiro, Brazil), and boric acid (99.5 %; Alphatec, Macaé, Brazil) and then its pH was adjusted with sodium hydroxide
solution 1.0 mol L−1 (99.0%; Proquimios, Rio de Janeiro,
Brazil). Ascorbic acid, uric acid and sodium carbonate were purchased from Isofar (Duque de Caxias, Brazil). Citric acid was purchased from Vetec Química Fina (Duque de Caxias, Brazil). Starch, magnesium stearate and microcrystalline cellulose were obtained from Valdequímica (São Paulo, Brazil). All chemicals were of analytical grade and all solutions were prepared with deionized water.
Apparatus
The voltammetric measurements were carried out on an Autolab PGSTAT 128 N (Metrohm Autolab B.V., Utrecht, The Netherlands) potentiostat/galvanostat controlled by NOVA 1.10.4 electrochemical software. The three-electrode electrochemical cell was set with BDDE as a working
electrode, an Ag/AgCl 3 mol L−1 KCl electrode as a reference
electrode, and a 1.0 cm2 platinum foil as a counter electrode.
The BDDE consisted of a thin film of boron-doped diamond deposited on a polycrystalline silicon wafer (Adamant Technologies SA, La Chaux-de-Fonds, Switzerland). The film thickness was approximately 1.2 µm and the exposed
area was 0.35 cm2. The content of boron in the BDDE was
approximately 8000 ppm. Prior to the experiments, the BDDE was first rinsed with deionized water and cathodically treated by applying a potential of +3.0 V for 15 s followed by −3.0 V for 45 s in H2SO4 0.5 mol L−1.30
The pH measurements were done with a metrohm 827 pH lab pHmeter (Metrohm Autolab B.V., Utrecht, The Netherlands) calibrated with standard buffers at room temperature. The methodology used for comparison with the electrochemical method proposed in this study was
performed according to the United States Pharmacopeia.31
Analytical procedures
The electrochemical behavior of ethionamide on BDDE was first investigated using a CV. A volume of 10.0 mL
of 0.1 mol L−1 BRBS (pH 5.0) containing 0.1 mmol L−1
of ETO was placed in the glass electrochemical cell and the electrochemical behavior of ETO at BDDE was
investigated by CV at scan rate of 100 mV s−1 over the
potential range from +1.6 to −1.4 V. Also, the scan rate
was varied from 10 to 150 mV s−1 in a potential range of
+0.1 to −1.4 V. The influence of the support electrolyte solution on the BDDE response for ETO was also
examined by CV. The CV was registered for 0.1 mmol L−1
ETO in 10.0 mL of 0.1 mol L−1 acetate buffer (pH 5.0) and
for 0.1 mmol L−1 ETO in 10.0 mL of 0.1 mol L−1 BRBS
(pH 5.0) at scan rate of 100 mV s−1 over the potential
range from +0.1 to −1.4 V.
In order to study the effect of pH on the electrochemical behavior of ETO at BDDE, SWV were recorded for
0.1 mmol L−1 ETO in 0.1 mol L−1 BRBS with pH varying
from 2.0 to 8.0 at step potential of 4.0 mV, frequency of
50 s−1 and potential pulse amplitude of 50 mV.
The analytical method was developed by SWV. The
potential pulse amplitude (a), step potential (∆Es) and
frequency (f) were considered as parameters to assess the
optimum experimental performance for quantification
of ETO using the BDDE. 10.0 mL of 0.1 mol L−1 BRBS
(pH 5.0) containing 0.1 mmol L−1 ETO was placed in the
glass electrochemical cell and potential pulse amplitude was varied from 10 to 70 mV (with a frequency and step
potential fixed at 50 s−1 and 1 mV, respectively). The ∆E
s
was varied from 1 to 6 mV (with potential pulse amplitude
and frequency fixed at 60 mV and 50 s−1, respectively), and
the frequency was varied from 10 to 90 s−1 (with potential
pulse amplitude and the step potential fixed at 60 mV and 1 mV, respectively). The optimized SWV parameters were:
a = 60 mV, ∆E
s = 1 mV and f = 50 s−1.
The best experimental condition for ETO analysis using
the BDDE was obtained in 0.1 mol L−1 BRBS (pH 5.0) at
a = 60 mV, ∆Es = 1 mV and f = 50 s−1. The linearity of the
method was evaluated by preparing twelve ETO solutions
with concentrations varying from 1.0 to 80.0 µmol L−1 at
three different days. The results were plotted as a calibration curve and the linear correlation coefficient was determined by linear fitting.
The limits of detection (LOD) and limits of quantification
(LOQ) were determined using the ratio of 3σ/b and 10σ/b,
respectively, where b is the slope of the calibration
curve and σ is the standard deviation value from ten
voltammograms of the blank determined, according to the
IUPAC recommendations.32
Before each measurement, oxygen was removed by bubbling nitrogen through the solutions for 3 min. All the electrochemical experiments were carried out at room temperature.
After optimizing the experimental parameters, SWV of ETO reduction were recorded to quantify the antibiotic in pharmaceutical formulation and human urine.
Preparation and electrochemical analysis of pharmaceutical formulation and human urine
The developed voltammetric method was tested for determination of ETO in pharmaceutical formulations (tablets) and human urine. ETO tablets were purchased from a local drugstore. According to the manufacturer’s information, each tablet contained 250 mg of ETO. Twenty tablets were powdered and then an amount of the powder equivalent to ca. 250 mg of ETO was accurately weighed, dissolved in 10% ethanol solution using magnetic stirring for 20 min and transferred to a 200 mL volumetric flask.
After, it was diluted with 0.1 mol L−1 BRBS (pH 5.0) to
the final volume of the volumetric flask. This solution was filtrated and an aliquot of 20 µL was transferred to a
25 mL volumetric flask and diluted with 0.1 mol L−1 BRBS
(pH 5.0) to the final volume of the volumetric flask (this solution it was named test solution). The test solution was placed in an electrochemical cell and ETO concentration was determined by the standard addition method. The results obtained were compared with an official United
States Pharmacopeia protocol.31
The suitability of the developed voltammetric method for analysis of ETO in biological fluids was also investigated by direct analysis of ETO in human urine. For this purpose, a sample of human urine (25 mL) was collected from a
volunteer and stored at temperature of approximately 4 oC.
The urine sample was fortified by adding an aliquot of
1250 µL of 1.0 mmol L−1 ETO standard stock solution and
a final concentration of 50.0 µmol L−1 ETO was obtained.
An aliquot of 2500 µL of the 50.0 µmol L−1 ETO solution
was added to a 25 mL volumetric flask and the final
volume was completed with 0.1 mol L−1 BRBS (pH 5.0).
This solution was added to the electrochemical cell and the ETO concentration was determined by the standard addition method.
Results and Discussion
Electrochemical behavior of ETO on BDDE
The electrochemical behavior of ETO in 0.1 mol L−1
the potential range of +1.6 to −1.4 V. According to Figure 2, the ETO presents an oxidation peak at 1.4 V and also a reduction peak at −0.95 V. The reduction peak observed
is more intense cathodic/anodic current peak (Ipc/Ipa ca. 4)
and more defined than the oxidation peak. Therefore, the reduction peak was chosen for further studies.
Effect of pH
The influence of solution pH on the ETO electrochemical
reduction was investigated by SWV in 0.1 mol L−1 BRBS
with pH varying from 2.0 to 8.0. It was observed that an increase in pH up to 5.0 increased significantly the current response. For higher pH values, however, the cathodic peak current decreased (Figure 3), probably due to the instability and tendency of thioamides to suffer hydrolysis in alkaline
solutions.17 Thus, the pH of 5.0 was chosen for the further
analysis of ETO. It was also observed that the cathodic peak
potential (Epc) exhibited a dependence on the pH solution
(Figure 3, insert).
The transference of protons in aqueous medium from or toward organic molecules is usually considered to be a fast
process, meaning that protons are in equilibrium in solution
near the electrode,33 thereby justifying this investigation.
A linear correlation was obtained from pH 2.0 to 8.0 in
the Epcvs. pH curve with a slope of 0.058 V/pH at 25 °C,
according to the following equation (equation 1).
Epc (V) = −(0.59 ± 0.01) – (0.058 ± 0.001)pH (1)
The obtained slope is close to a Nernst system, where
n (number of protons) = ne (number of electrons).34 This
result is in agreement with a previous report by Kane,35
in which the reduction process of ETO is described as involving four electrons and four protons, according to the scheme shown in Figure 4.
Influence of support electrolyte
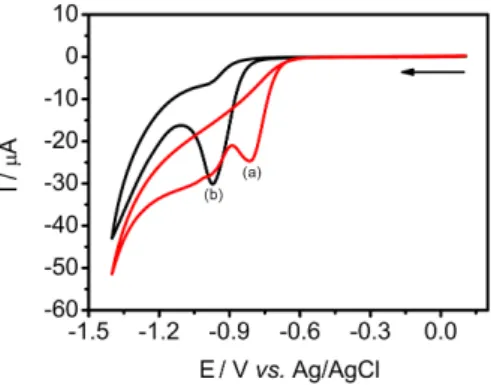
In order to use the BDDE for ETO determination, the optimization of the voltammetric method was performed through a systematic study of the dependence of the analytical signal on the CV experimental parameters. In this sense, the influence of the buffer solution on the BDDE response was examined by testing two different buffer solutions (acetate and BRBS), which have maximum buffering capacity at pH 5.0 (Figure 5).
As shown in Figure 5, the BRBS provides the best response with better defined cathodic peak and improved sensitivity in comparison with the acetate buffer.
Figure 4. Reaction mechanism of the ethionamide (ETO) reduction as suggested by Kane.35
Figure 3. Square wave voltammograms of 0.1 mmol L−1 ethionamide (ETO) in 0.1 mol L−1 Britton-Robinson buffer solution (BRBS) in different pH values obtained with boron-doped diamond electrode (BDDE). Step potential = 4.0 mV, frequency = 50 s−1 and potential pulse amplitude = 50 mV. Insert: cathodic peak potential (Epc) vs. pH plot.
Figure 2. Cyclic voltammograms obtained with a boron-doped diamond electrode (BDDE) in 0.1 mol L−1 Britton-Robinson buffer solution (BRBS, pH 5.0) in the absence (a) and presence (b) of ethionamide (ETO, 0.1 mmol L−1). Scan rate: 100 mV s−1.
Effect of scan rate
The effect of the potential scan rate on the BDDE electrochemical response was also investigate and a plot of the Ipc vs. square root of the potential scan rate (ν1/2)
for 0.1 mmol L−1 ETO solution in 0.1 mol L−1 BRBS
(pH 5.0) resulted in a straight line (Figure 6), suggesting that the electrochemical process is controlled by diffusion. Moreover, a linear correlation was obtained in the log Ipcvs. log ν curve (Figure 6, insert) with a slope value
of 0.53. This slope is very close to the theoretical values
reported in literature for diffusion-controlled processes.36,37
Influence of the potential pulse amplitude, step potential and frequency
The effect of the potential pulse amplitude on the SWV
response of the BDDE for 0.1 mmol L−1 ETO was verified
maintaining the frequency and the step potential at 50 s−1
and 1 mV, respectively. The values of current peak displayed an increase with increasing potential pulse amplitude from 10 to 70 mV. On the other hand, when the potential pulse amplitude was higher than 60 mV, the increase of the current peak value was accompanied by a peak distortion effect. Therefore, the best voltammetric sensitivity was obtained with 60 mV, which was selected for further investigations.
The values of current peak were also found to vary with respect to the steps potential (1-6 mV) applied on SWV at constant potential pulse amplitude of 60 mV and frequency
of 50 s−1. The step potential of 1 mV was selected as it sets
the best voltammetric profile owing higher sensitivity and selectivity for ETO determination.
The effect of the frequency from 10 to 90 s−1 on the
SWV response of the BDDE for 0.1 mmol L−1 ETO was
also evaluated, maintaining the potential pulse amplitude at 60 mV and the step potential at 1 mV. The values of
current peak presented an increase when the frequency was
increased from 10 to 50 s−1. Thus, the frequency value of
50 s−1 was chosen for further studies. A plot of the I
pcvs. the
square root of the frequency was constructed and resulted in a straight line, indicating that the ETO reduction process
is controlled by diffusion.38
Analytical characterization
In order to obtain an analytical curve for the determination of ETO, square wave voltammograms of ETO reduction were obtained for different concentrations
of ETO in BRBS (pH 5.0, 0.1 mol L−1), after optimization
of the experimental parameters (Figure 7a).
The BDDE showed a linear response range from
1.0 to 80.0 µmol L−1 (Figure 7b) as expressed by equation 2:
jpc (µA) = −(0.688 ± 0.012) [ETO] + (0.101 ± 0.155) (2)
The correlation coefficient was 0.998 (n = 12). A
lower limit of detection of 0.294 µmol L−1 and the limit
of quantification of 0.980 µmol L−1 were determined
using a ratio of 3σ/slope and 10σ/slope, respectively,
where σ is the standard deviation value from ten
voltammograms of the blank determined according to the
IUPAC recommendations.32 The linear range and limit of
detection of the proposed electroanalytical method were similar or better than those reported in earlier reports on electrochemical or other analytical techniques (Table 1). In addition, the reaction occur at the BDDE reached a dynamic equilibrium very rapidly upon addition of ETO, leading to a response time to reach 100% of signal shorter than 1 s. The advantages exhibited by the BDDE for ETO reduction are principally its high sensitivity, low limit of detection, Figure. 6. Cyclic voltammograms of 0.1 mmol L−1 ethionamide (ETO)
in 0.1 mol L−1 Britton-Robinson buffer solution (BRBS, pH 5.0) obtained with a boron-doped diamond electrode (BDDE). Potential scan rates = 10-150 mV s−1. Insert: log cathodic current peak (I
pc) vs. log potential scan rate (v) plot.
fast response time and simplicity, demonstrate that this electrode could be potentially used as a electrochemical detector for determination of ETO in HPLC and capillary electrophoresis systems, for example.
Intra-day and inter-day precision
The intra-day precision of the current peak magnitude was determined by successive measurements (n = 7) at 40.0,
60.0 and 70.0 µmol L−1 ETO solution in 0.1 mol L−1 BRBS
(pH 5.0). When these repeated current peak values were compared with the initial values, relative standard deviations (RSD) of 3.30, 2.90 and 2.30% were obtained, respectively, indicating a good intra-day precision of the proposed voltammetric method. The inter-day precision for the current
peak magnitude of the 40.0, 60.0 and 70.0 µmol L−1 ETO in
0.1 mol L−1 BRBS (pH 5.0) was evaluated over a period of
7 days. A good RSD values were also obtained: 4.80, 4.50 and 3.50%, respectively. Hence, it is possible to conclude that the SWV-BDDE approach for ETO determination provides results with adequate precision.
Interference study
Prior to analyzing the samples (pharmaceutical and human urine), the selectivity of the proposed method for ETO was tested by the assessment of the effect of possible interfering (commonly occurring in pharmaceutical formulations and human urine), such as magnesium stearate, starch, microcrystalline cellulose, uric acid, ascorbic acid and citric acid. Solutions of these compounds were freshly prepared at a ETO solution:interferent compound concentration ratio of 1:100 under the same
conditions used for 10.0 µmol L−1 ETO in 0.1 mol L−1
BRBS (pH 5.0). The analytical response was monitored and compared with the signal obtained for the pure ETO solution (Table 2). The results revealed that the proposed
method is highly selective for ETO, once the possible interfering did not affect the cathodic current of the antibiotic under the concentration tested.
Determination of ETO in pharmaceutical formulation and human urine, and recovery tests
The BDDE was applied to determine ETO in tablets and human urine. Each experiment was conducted in triplicate and using the standard addition method. For comparison purposes, the concentration of ETO in the tablets was also
determined by the official spectrophotometric protocol.31
The data were statistically compared through the paired
t-test and F-test,39 and the results are summarized in Table 3.
It was possible to observe that there was no statistical difference between these two methods at a confidence level of 95%, indicating that the BDDE can be successfully used for voltammetric determinations of ETO in pharmaceutical formulations.
Furthermore, the proposed method presents some advantages when compared to the official spectrophotometric protocol: sample preparation of the proposed method is simple because it does not require analyte extraction steps using large amounts of organic solvent, besides showing a higher sensitivity and a large linear range.
Table 1. Comparison of different analytical methods proposed for determination of ethionamide (ETO)
Technique Linear range Limit of detection / (µmol L−1) Sample Reference
Spectrophotometry 60.2-601.5 4.27 pharmaceuticals and serum 5
Fluorimetry 6.00-48.1 0.481 urine, plasma 7
HPLC-UV 1.50-60.1 0.300 plasma 8
HPLC-MS 0.154-36.8 0.046 plasma 11
HPLC 0.60-18.0 0.300 serum 12
Eletrochemical 0.09-60.0 data not showed not applied 17
Electrochemical 0.90-3.91 0.283 not applied 18
This paper (electrochemical) 1.00-80.0 0.294 pharmaceutical and urine –
HPLC: high-performance liquid chromatography; UV: ultraviolet; MS: mass spectrometry.
Table 2. Effect of possible interfering compounds on the determination of ethionamide (ETO)a
Interfering compoundb Relative response / %
Magnesium stearate 98.0 ± 2.3
Starch 100.1 ± 3.3
Microcrystalline cellulose 96.9 ± 4.2
Uric acid 97.3 ± 1.3
Ascorbic acid 98.6 ± 3.1
Citric acid 98.5 ± 0.4
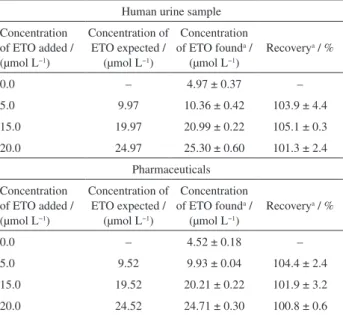
The accuracy of the SWV-BDDE method and the possibility of matrix interferences were further checked by performing analytical recovery experiments. Precise amounts of ETO were added to pharmaceutical tablet sample and the recovery percentage values were calculated from the actual and added ETO concentrations (Table 4). It can be clearly observed that there was no influence of the matrix on the response obtained by SWV-BDDE.
Conclusions
This work demonstrated that a SWV-BDDE method can be used to quantify ETO in human urine and pharmaceutical formulations. Under optimized experimental conditions, the cathodic current peak was linear for ETO concentrations
from 1.00 to 80.0 µmol L−1 with a limit of detection of
0.294 µmol L−1, which was similar or better than many reported
analytical methods for ETO determination. Additionally, the concentrations of ETO found in pharmaceutical tables
by SWV were equivalent to those attained by UV-Vis spectrophotometry at a confidence level of 95%. Satisfactory recovery results were obtained in the determination of ETO in human urine, indicating that the BDDE was also successfully applied in this kind of sample. The SWV involving BDDE is a simple, sensitive, precise, accurate and environmentally-friendly approach that does not need sophisticated instruments or any separation step, allowing the analysis of ETO without laborious and time-consuming procedures. The analytical frequency of the proposed method
is approximately 10 determinations per hour.
Acknowledgements
The authors thank CNPq, CAPES and FINEP for the financial support, and FAPEMIG for the scholarship.
References
1. Brunton, L. L.; Chabner, B. A.; Knollmann, B. C.; As Bases Farmacológicas da Terapêutica de Goodman e Gilman, Artmed:
Porto Alegre, 2012.
2. World Health Organization (WHO); Guidelines for the Programmatic Management of Drug-Resistant Tuberculosis;
WHO: Geneva, Swiss, 2008.
3. Lemos, A. C. M.; Matos, E. D.; Braz. J. Infect. Dis.2013, 17, 239.
4. Arbex, M. A.; Varella, M. D. C. L.; de Siqueira, H. R.; de Mello, F. A. F.; J. Bras. Pneumol. 2010, 36, 641.
5. Sikorska-Tomicka, H.; Mikrochim. Acta1985, 3, 151. 6. Walash, M. I.; Metwally, M. E. S.; El-Brashy, A. M.; Abdelal,
A. A.; Il Farmaco2003, 58, 1325.
7. Walash, M. I.; El-Brashy, A. M.; Metwally, M. E. S.; Abdelal, A. A.; Acta Chim. Slov.2004, 51, 283.
8. Walash, M. I.; El-Brashy, A. M.; Metwally, M. E. S.; Abdelal, A. A.; J. Chin. Chem. Soc. 2004, 51, 1059.
9. Hemanth Kumar, A. K.; Sudha, V.; Ramachandran, G.; Asian J. Biomed. Pharm. Sci. 2014, 38, 1.
10. Gennaro, M. C.; Calvino, R.; Abrigo, C.; J. Chromatogr. B: Anal. Technol. Biomed. Life Sci.2001, 754, 477.
11. Conte, J. E.; Wang, G.; Lin, E. T.; Zurlinden, E.; J. Chromatogr. B: Anal. Technol. Biomed. Life Sci.2001, 753, 343.
12. Deshpande, A. Y.; Gurav, S.; Punde, R.; Zambre, V.; Kulkarni, R.; Pandey, S.; Mungantiwar, A.; Mullangi, R.; Biomed. Chromatogr. 2011, 25, 985.
13. Bhanushali, C. J.; Zidan, A. S.; Rahman, Z.; Habib, M. J.; AAPS PharmSciTech2013, 14, 1313.
14. Bergamini, M. F.; Santos, D. P.; Zanoni, M. V. B.; J. Electroanal. Chem. 2013, 690, 47.
15. Cheemalapati, S.; Devadas, B.; Chen, S. M.; Ali, M. A.; Al-Hemaid, F. M. A.; Anal. Methods 2014, 6, 6774.
Table 3. Ethionamide (ETO) determination results for pharmaceutical samples according to the proposed electroanalytical square wave voltammetry boron-doped diamond electrode (SWV-BDDE) method and the official spectrophotometric protocol31
Sample Label value / (mg per tablet)
By proposed method / (mg per tablet)a
By official method / (mg per tablet)a
Tablet 250 252.4 ± 9.7 247.8 ± 7.7
an = 3.
Table 4. Results of addition-recovery experiments using boron-doped diamond electrode (BDDE) for determination of ethionamide (ETO) in urine and pharmaceutical samples
Human urine sample
Concentration of ETO added / (µmol L−1)
Concentration of ETO expected /
(µmol L−1)
Concentration of ETO founda /
(µmol L−1)
Recoverya / %
0.0 – 4.97 ± 0.37 –
5.0 9.97 10.36 ± 0.42 103.9 ± 4.4
15.0 19.97 20.99 ± 0.22 105.1 ± 0.3
20.0 24.97 25.30 ± 0.60 101.3 ± 2.4
Pharmaceuticals
Concentration of ETO added / (µmol L−1)
Concentration of ETO expected /
(µmol L−1)
Concentration of ETO founda /
(µmol L−1)
Recoverya / %
0.0 – 4.52 ± 0.18 –
5.0 9.52 9.93 ± 0.04 104.4 ± 2.4
15.0 19.52 20.21 ± 0.22 101.9 ± 3.2
20.0 24.52 24.71 ± 0.30 100.8 ± 0.6
16. Thapliyal, N.; Karpoormath, R. V.; Goyal, R. N.; Anal. Chim. Acta2015, 853, 59.
17. Iwamoto, M.; Osteryoung, R. A.; J. Electroanal. Chem.1984, 169, 181.
18. Jain, R.; Tiwari, D. C.; Pandey, P.; J. Mol. Liq. 2014, 198, 364. 19. Pleskov, Y. V.; Russ. J. Electrochem.2002, 38, 1275. 20. Compton, R. G.; Foord, J. S.; Marken, F.; Electroanalysis2003,
15, 1349.
21. Panizza, M. C.; Cerisola, G.; Electrochim. Acta2005,51, 191. 22. Rao, T. N.; Loo, B. H.; Sarada, B. V.; Terashima, C.;
Fujishima, A.; Anal. Chem. 2003, 75, 1564.
23. Pedrosa, V. A.; Malagutti, A. R.; Mazo, L. H.; Avaca, L. A.; Anal. Lett. 2006, 39, 2737.
24. Codognoto, L.; Tanimoto, S. T.; Pedrosa, V. A.; Suffredini, H. B.; Machado, S. A. S.; Avaca, L. A.; Electroanalysis2006, 18, 253.
25. Boonsong, K.; Chuanuwatanakul, S.; Wangfuengkanagul, N.; Chailapakul, O.; Sens. Actuators, B 2005, 108, 627.
26. Faria, E. O.; Lopes Junior, A. C. V.; Souto, D. E. P.; Leite, F. R. F.; Damos, F. S.; Luz, R. D. C. S.; dos Santos, A. S.; Franco, D. L.; dos Santos, W. T. P.; Electroanalysis2012, 24, 1141.
27. Ardila, J. A.; Sartori, E. R.; Rocha-Filho, R. C.; Fatibello-Filho, O.; Talanta2013, 103, 201.
28. Sartori, E. R.; Trench, A. B.; Rocha-Filho, R. C; Fatibello-Filho, O.; J. Braz. Chem. Soc.2013, 24, 1504.
29. Santos, S. B.; Valezi, C. F.; Scremin, J.; Salamanca-Neto, C. A. R.; Dall’Antonia, L. H.; Sartori, E. R.; Quim. Nova2014, 37, 1579.
30. Suffredini, H. B.; Pedrosa, V. A.; Codognoto, L.; Machado, S. A. S.; Rocha-filho, R. C.; Avaca, L. A.; Electrochim. Acta
2004, 49, 4021.
31. United States Pharmacopeia Convention; US Pharmacopeia 38, National Formulary 33, United States Pharmacopeia
Convention, Rockville, 2015.
32. Analytical Methods Committee; Analyst1987,112, 199. 33. Laviron, E.; J. Electroanal. Chem. Interfacial Electrochem.
1981, 124, 1.
34. Papouchado, L.; Sandford, R. W.; Petrie, G.; Adams, R. N.; J. Electroanal. Chem. Interfacial Electrochem.1975,65, 275.
35. Kane, P. O.; J. Electroanal. Chem.1961, 2, 152.
36. Gosser, D. K.; Cyclic Voltammetry: Simulation and Analysis of Reaction Mechanisms, VCH Publishers: New York, 1994.
37. Bard, A. J.; Faulkner, L. R.; Electrochemical Methods: Fundamentals and Applications; 2nd ed.; John Wiley & Sons:
New York, 2001.
38. Lovric, M.; Lovric, S. K.; J. Electroanal. Chem. Interfacial Electrochem.1988, 248, 239.
39. Triola, M. F.; Introdução à Estatística, 11ª ed.; LTC: Rio de Janeiro, 2013.
Submitted: September 9, 2015