Article
0103 - 5053 $6.00+0.00*e-mail: [email protected]
Simultaneous Determination of Captopril and Thioguanine in Pharmaceutical
Compounds and Blood using Cathodic Adsorptive Stripping Voltammetry
Ali Asghar Ensafi* and Reza Hajian
College of Chemistry, Isfahan University of Technology, Isfahan, 84156-83111, Iran
Apresentamos um procedimento altamente seletivo e sensível para a determinação simultânea de captopril e de tioguanina baseado em processo de redissolução catódica adsortiva dos complexos de Cu(I)-captopril e de Cu(I)-tioguanina em um eletrodo gotejante de mercúrio. Captopril e tioguanina foram pré-concentrados na superfície da gota do eletrodo de mercúrio usando Cu(II) como sensor e tempo de acumulação igual a 90 s. Em seguida, os complexos pré-concentrados foram analisados por voltametria adsortiva de pulso diferencial catódica. O efeito de vários parâmetros na sensibilidade, tais como, pH, concentração de cobre, potencial de acumulação, tempo de acumulação e velocidade de varredura, na sensibilidade do método foram estudados. As condições ótimas para a determinação simultânea de captopril e de tioguanina foram: pH = 3,5, concentração de cobre(II) = 45,0 ng mL-1, potencial de acumulação = -0,10 V e velocidade de varredura = 60 mV s-1. Nas condições ótimas e tempo de acumulação igual a 90 s, os picos de corrente medidos em torno de -0,15 V e -0,40 V (vs. Ag/AgCl) foram proporcionais às concentrações de tioguanina e de captopril nas faixas de 0,15-180 e 0,5-100 nmol L-1. Os limites de detecção para tioguanina e captopril foram 0,08 e 0,3 nmol L-1, respectivamente. Os desvios padrões relativos para cinco replicatas de 20,0 nmol L-1 de captopril e de tioguanina foram 2,5% e 2,1%. O método para a determinação de captopril e de tioguanina foi testado em amostras de misturas sintéticas, farmacêuticas e em soro humano, apresentando resultados satisfatórios.
A reliable, highly selective and sensitive procedure is presented for simultaneous determination of captopril and thioguanine based on cathodic adsorptive stripping of captopril and Cu(I)-thioguanine complexes on a hanging mercury drop electrode. Captopril and Cu(I)-thioguanine were preconcentrated onto the surface of hanging mercury drop electrode using Cu(II) as a suitable probe, with accumulation time of 90 s. Then the preconcentrated complexes were analyzed by cathodic stripping differential pulse voltammetry. The effect of various parameters such as pH, concentration of copper, accumulation potential, accumulation time and scan rate on the sensitivity were studied. The optimum conditions for simultaneous determination of captopril and thioguanine include pH=3.5, 45.0 ng mL-1 copper(II) concentration, accumulation potential of -0.10 V and scan rate of 60 mV s-1. Under the optimum conditions and for an accumulation time of 90 s, the measured peak currents at about -0.15 V and -0.40 V (vs. Ag/AgCl) are proportional to the concentrations of thioguanine and captopril over the ranges of 0.15-180 and 0.5-100 nmol L-1, respectively. The limits of detection are 0.08 and 0.3 nmol L-1 for thioguanine and captopril, respectively. The relative standard deviations for five replicate analyses of 20.0 nmol L-1 captopril and thioguanine are 2.5% and 2.1%, respectively. The method was applied to the determination of captopril and thioguanine in synthetic mixed samples, pharmaceutical samples and human serum with satisfactory results.
Keywords: captopril, thioguanine, copper(II), adsorptive cathodic stripping voltammetry
Introduction
Captopril, 1-[(2S)-3-mercapto-2-methylpropionyl]-L
-proline (Scheme 1) is a synthetic dipeptide serving as an orally active inhibitor of the angiontensin-covering enzyme
and has been widely used as antihypertensive drug,1,2 and
to moderate heart failure.3 Captopril is metabolized chiefly
rashes, and drug fever, which may occur in as many as
10% of patients.4,5
6-Thioguanine, 2-amino-7H-purine-6-thiol (Scheme 2) has been used in treatment of various types of tumors. It is well known that thiopurines inhibit the synthesis of DNA and RNA and have been used successfully in the
treatment of acute leukaemia.6,7 Because of their ability to
interact with genetic material in the cell, this substance has mutagenic or carcinogenic properties. Thus, work with this substance yields biologically harmful waste materials, and glassware and instruments become contaminated.
Various instrumental methods have been developed
for the determination of captopril including HPLC,8-15
spectrophotometry,7,16-19 fluorimetry,20,21 capillary
electrophoresis22 and chemiluminescence methods.23 But
all of the reported methods suffer from many interferences such as ascorbic acid, Fe2+, Fe3+, NO
2
- and/or do not have
good limit of detection (>18 nmol L-1). Only three methods
have been reported for the determination of thioguanine.24-26
Those reported methods could not measure thioguanine less
than 120 nmol L-1. One of the important limitation of HPLC
or spectrophotometric techniques is the fact that captopril and thioguanine lack sufficient UV absorption. So a pre- or post-column derivative procedure is normally required and these results increased cost and complication of analysis.
Recently, Wang et al.27 have reported an electrochemical
method based DNA sensor for the determination of
thioguanine, with a limit of detection of 120 nmol L-1. The
method was not used for real sample analysis.
Electrochemical methods allow the decrease of the analysis time comparing to the time consuming in spectrophotometric and chromatographic methods. The electrochemical detection of captopril has been reported
using graphite28-30 and selective membrane electrodes as
a working electrode.30 Nevertheless, the sensitivity and
reproducibility of the electrodes were not high because the surface of these electrodes was easy to contaminate by fouling caused by products and impurities. Other
electrochemical techniques such as amperometry,31-33
square wave voltammetry2,33 and differential pulse stripping
voltammetry34 were also used for the determination of
captopril. But these methods suffer from relatively high limit of detection (~2.3 nmol L-1), in addition to low
sensitivity, long analysis time. On the other hand, the selectivity of those techniques was not studied.
A new combination dosage form of captopril and thioguanine is indicated for the treatment and management
of hypertension and leukemia.26,28 According to our
knowledge, there is no report for simultaneous determination of both drugs in biological fluids. Therefore, it is necessary to establish a new analytical method for their simultaneous determination.
The proposed method is a highly sensitive, simple, fast and accurate method with lower detection limits for simultaneous determination of captopril and thioguanine in tablets and blood. The method is based on cathodic adsorptive stripping of captopril and Cu(II)-thioguanine complexes on a hanging mercury drop electrode (HMDE). Then the preconcentrated complexes were analyzed by cathodic stripping differential pulse voltammetry.
Experimental
Chemicals
All the chemicals were of analytical grade and were purchased from Merck (Darmstadt, Germany) unless otherwise stated. Doubly distilled water was used throughout. Captopril and thioguanine were purchased from Aldrich and Fluka companies, respectively.
Stock solution (100 µg mL-1) of Cu(II) was prepared
by dissolving 0.0100 g of copper metal in 10 mL of
0.01 mol L-1 HNO
3 and diluted with water in a 100 mL
volumetric flask.
A 1.0 × 10⁻³ mol L-1 captopril solution was prepared
daily by dissolving 0.0224 g captopril (97%) in water and the solution was diluted to 100 mL with water in a 100 mL volumetric flask. The solution was kept in a refrigerator at
4 oC and in dark. More dilute solutions were prepared by
serial dilution with water.
A 1.0 × 10⁻³ mol L-1 thioguanine solution was prepared
daily by dissolving 0.0174 g thioguanine (96%) in water and the solution was diluted to 100 mL with water in
Scheme 1.
a 100-mL volumetric flask. The solution was kept in a refrigerator at 4 oC in dark. More dilute solutions were
prepared by serial dilution with water.
Captopril tablets (Exir Pharmaceutical Co., Iran, labeled 25 and 50 mg captopril per tablet) were purchased from Red Cross drug store in Isfahan. Thioguanine tablet (Glaxo Smith King, Italy, labeled 40 mg thioguanine per tablet) was purchased from Red Cross drug store in Isfahan.
Britton–Robinson (B-R) buffers (0.1 mol L-1 in
phosphate, acetate and borate) in the pH range of 2-9 were used, throughout.
Apparatus
Voltammetric measurements were carried out using a Metrohm instrument, Model 797 VA, computrace with stand three-electrodes containing a HMDE as a working electrode, a carbon rod as an auxiliary electrode and an
Ag/AgCl (3.0 mol L-1 KCl) reference electrode.
A Pentium IV (2.0 MHz) computer controlled all of the setting and data processing.
A pH-meter (Corning, Model 140) with a double junction glass electrode was used to check the pH of the solutions.
Preparation of real samples
For preparation of tablets solutions, five tablets were mixed and powdered. A portion of the powder containing approximately 20 mg of captopril and/or thioguanine was accurately weighted and then dissolved in 20 mL of water. After mixing completely, the mixture was filtered with an ordinary filter paper. Then the filtered solution was transferred into a 1000 mL volumetric flask and the solution was diluted to the mark with water.
Serum samples were obtained and stored frozen until the assay. Into each of 10 centrifugation tubes containing a certain concentration of captopril and/or thioguanine, 0.10 mL of the human serum sample was transferred, and then mixed well with 1.0 mL of methanol to precipitate the blood proteins. The precipitated proteins were separated by centrifuging of the mixture for 20 min at 4000 rpm. The clear supernatant layer was filtered through a 0.45 µm milli-pore filter to produce protein-free human serum. The human serum sample was transferred into a 25 mL calibrated flask, completed to the volume with B-R buffer of pH 3.5, and then introduced to the voltammetric cell.
Whole blood (1.0 mL), plus 1.5 mL water and
2 mL of 1 mol L-1sulfuric acid were heated in a 10 mL
polypropylene screw cap tube (Sarstedt, Germany) for
45 min at 100 oC. The samples were centrifuged at 4000
rpm for 10 min and the supernatant (2.5 mL) was transferred to a new tube for precipitation with 23% (m/v) perchloric acid (10 mL). This solution was extracted with 1.0 mL
dichloromethane and centrifuged for 10 min at 4000 rpm.26
Aqueous supernatant (1.3 mL) was transferred into a clean
12 × 75 mm glass tube and aliquots of 0.1 mol L-1 sodium
bicarbonate (pH 10.1) was added to adjust the solution pH to approximately 3.5. Then 30 µL of the supernatant was injected into the voltammetric cell.
Recommended procedure
For simultaneous determination of captopril and thioguanine, 25 mL of the supporting electrolyte solution
(B-R buffer at pH 3.5) containing 45.0 ng mL-1 copper(II)
was pipetted into the electrochemical cell. The solution was purged with nitrogen gas for 4 min. The adsorption potential at -0.10 V vs. Ag/AgCl was applied to a fresh HMDE and the adsorption were carried out in a stirred solution (200 rpm) for a period of 90 s. Then a differential pulse stripping voltammogram was recorded from 0.00 to –0.50 V with
a potential scan rate of 60 mV s-1 and pulse amplitude of
100 mV. After the background voltammogram was obtained
(Ipb), aliquots of the sample solution containing a certain
concentration of captopril and thioguanine were introduced into the cell while maintaining a nitrogen atmosphere above the solution. A differential pulse stripping voltammogram was recorded as described above to obtain the sample peak currents (Ips). The difference currents (Ips-Ipb) were considered as a net signal (∆Ip). All data were obtained at room temperature. Calibration graphs were prepared by plotting the net peak currents versus captopril and/or thioguanine concentrations.
Results and Discussion
Captopril, 1-[(2S)-3-mercapto-2-methylpropionyl]-L
-proline is a synthetic dipeptide and is a thiol. 6-Thioguanine, 2-amino-7H-purine-6-thiol is also a thiol compound that has been used in treatment of various types of tumors. Copper(II) can react with thiol (such as captopril and/ or thioguanine) to oxidize the thiol with formation of
Cu(I)-thiolate complexes.35 Figure 1 displays the cathodic
stripping differential pulse voltammograms for the system.
A blank solution (B-R buffer at pH 3.5 plus 20 ng mL-1
With the addition of Cu(II) to the solution of captopril and thioguanine, two large cathodic peaks were obtained (Figure 1c) in the potential ranges of -0.15 to -0.25 V and -0.30 to -0.40 V, which are related to thioguanine and captopril, respectively. The peak currents were omitted without applying any accumulation time (Figure 1d). In
addition, when 10 µg mL-1 of Triton X-100 was added
to the solution, each of the peak currents was reduced to 40% of its initial value. This phenomenon suggests that the complex was adsorbed before undergoing electrode reaction.
In order to obtain the coordination numbers (m) and
the formation constant (β) of the complexes adsorbed on
the surface of the electrode, the following equation can be used:36,37
(1)
where i
p is the measured peak current, ip,max is the peak
current when all the metal ions form the complex, β is the
formation constant of the complex and c is the concentration of the ligand. By plotting 1/ip vs. c-mfor different m values,
a straight line will be constructed for the corresponding complex. The results of our calculation shows that when
m = 1, a straight line with r = 0.9945 is obtained for thioguanine (Figure 2a). A similar straight line with r =
0.9953 is obtained for captopril at m = 1 (Figure 2b). The
results indicate that the compositions of the electroactive complexes on the surface of the mercury electrode are 1:1 (metal/ligand) for both thioguanine and captopril.
According to the above results, the reduced form of Cu(II) in the presence of the thiols (Cu(I)) makes
complex with thioguanine and/or captopril in the solution. Then the complexes were adsorbed on the surface of the electrode by applying the accumulation potential during the accumulation time. The adsorbed complexes were reduced by scanning the potential from 0.00 to -0.50 V. The electrode processes can be summarized as follows:
(2)
(3)
Accumulation step (4)
Stripping step (5)
where Lox and n are ligand (thioguanine or captopril) in the
oxidation form and coordination number of the complexes, respectively. According to the above results the formation constants for thioguanine and captopril complexes are
4.9(±0.3) × 1015 and 2.5(±0.2) × 1016, respectively.
Optimization of the variables
In our experiments, we studied the effect of instrumental
Figure 1. Differential pulse voltammograms of captopril–copper(I) and thioguanine-copper(I) systems: (a) 20 ng mL-1 copper(II) in B-R buffer
(pH=3.5) after 90 s accumulation at -0.10 V and scan rate of 60 mV s-1;
(b) 50 nmol L-1 captopril and/or thioguanine in B-R buffer (pH=3.5) after
90 s accumulation time at -0.10 V; (c) b plus 20.0 ng mL-1 copper(II); (d)
c without application of any accumulation time.
Figure 2. The plots of 1/ipvs C-1 for (a) thioguanine and (b) captopril.
Conditions: pH 3.5, 45 ng mL-1 copper(II), accumulation potential of
Figure 5 shows the dependence of the adsorptive peak currents on the accumulation potential over the range of
+0.20 to -0.60 V (vs. Ag/AgCl) for 50 nmol L-1 captopril
and 100 nmol L-1 thioguanine at pH 3.5 and copper(II)
concentration of 45 ng mL-1. The results show that the peak
currents increase by changing accumulation potential from +0.20 to -0.10 V. More negative accumulation potentials cause decreasing the peak currents. This is due to the fact that for more negative potentials, Cu(II) reduced directly to Cu(Hg) on the surface of the electrode, whereas to get higher sensitivity, Cu(I) is needed to make complexes with the thiols. In addition, due to the existence of two separate peak potential and higher sensitivity for captopril and thioguanine in the accumulation potential of -0.10 V, accumulation potential of -0.10 V was selected for simultaneous determination of the two thiols.
Figure 6 shows the dependence of the adsorptive peak currents on the accumulation time in the presence of 50 mol L-1 captopril and 100 nmol L-1 thioguanine
and chemical factors including pH, Cu(II) concentration, accumulation potential, accumulation time and scan rate on the peak currents.
Figure 3 illustrates the dependence of the peak currents on pH of the solution containing both captopril and thioguanine. The results show that the peak currents were increased from pH 2 to 3.5. However, by increasing pH from 3.5 to 6.0 the peak currents decreased due to decrease of the stability of captopril-Cu(I) and thioguanine-Cu(I) complexes. So a pH of 3.5 was selected for further optimization steps.
The dependence of the peak currents on the copper(II) concentration was evaluated over the range of 0.0 to 50 ng mL-1 copper(II) for 50 nmol L-1 captopril and 100 nmol
L-1 thioguanine at pH 3.5. The results (Figure 4) showed
that the peak current values were maximal for copper(II)
concentration of 45 ng mL-1. Therefore, copper(II)
concentration of 45 ng mL-1 was selected for the study.
Figure 3. Effect of pH on the adsorptive cathodic stripping peak currents of 50 nmol L-1 and 100 nmol L-1 of (a) captopril and (b) thioguanine,
respectively. Conditions: 20 ng mL-1 copper(II), scan rate of 60 mV s-1 and
accumulations time of 60 s at -0.30 V vs. Ag/AgCl reference electrode.
Figure 4. Influence of copper(II) concentration on the peak currents. Conditions: a) 50 nmol L-1 captopril in B-R buffer (pH=3.5); b) 100 nmol L-1
thioguanine in B-R buffer (pH=3.5). Other conditions are: accumulation potential, -0.30 V; accumulation time, 60 s; and scan rate, 60 mV s-1.
Figure 5. Influence of accumulation potential on the peak currents of (a) 50 nmol L-1 captopril and (b) 100 nmol L-1 thioguanine. Conditions: Cu(II),
45 ng mL-1; accumulation time, 60 s; pH=3.5; and scan rate, 60 mV s-1.
Figure 6. Influence of accumulation time on the peak currents of a) 50 nmol L-1 captopril and b) 100 nmol L-1 thioguanine. Conditions:
Cu(II), 45 ng mL-1; accumulation potential, -0.10 V; pH, 3.5; and scan
at pH 3.5 and copper(II) concentration of 45 ng mL-1.
As shown in Figure 6, by increasing accumulation time up to 90 s lead to increasing the peak current for both captopril-copper(I) and thioguanine-copper(I) complexes. As the accumulation time increases (> 90 s), the peak currents tend to leveled off, showing that the adsorptive equilibrium is reached above these times. According to the above results, an accumulation time of 90 s was selected for further studies.
The influence of potential scan rate on the reduction peak currents of the captopril-copper(I) and thioguanine-copper(I) complexes were also studied under the optimized
conditions containing 45.0 ng mL-1 copper(II), pH 3.5,
accumulation potential of -0.10 V and accumulation time
of 90 s in the present of 50 nmol L-1 captopril, 100 nmol L-1
thioguanine. As it is expected in differential pulse
voltammetry,the results showed that the peak currents for
captopril and thioguanine are independent on scan rate
in the range of 10 to 90 mV s-1. Therefore, a scan rate of
60 mV s-1 was selected for further studies.
Accordingly, the established optimal operational parameters of the proposed differential pulse adsorptive cathodic stripping voltammetric procedure were B-R buffer at pH 3.5 as a supporting electrolyte, copper(II)
concentration of 45 ng mL-1, accumulation potential of
-0.10 V (versus Ag/AgCl), accumulation time of 90 s, scan
rate of 60 mV s-1 and pulse amplitude of 100 mV.
Validation of the proposed analysis procedure
The validation of the proposed method was examined via evaluation of the linear dynamic range (LDR), sensitivity, limit of detection (LOD), limit of quantitation (LOQ), repeatability and selectivity. Under the optimum conditions, the corresponding calibration graphs were linear over the concentration ranges reported in Table 1. The LOD and
LOQ were estimated as LOD = (B + 3SB)/b and LOQ =
(B + 10SB)/b,38 where B, S
B and b are current of the blank,
standard deviation of the blank and slope of the calibration
curve, respectively. The estimated values of LOD and LOQ (Table 1) show an improvement in sensitivity of the proposed procedure for quantification of captopril and thioguanine
compared to that of the reported methods.8-34
The relative standard deviations for five replicates
analyses of 20 nmol L-1 captopril and thioguanine are 2.5%
and 2.1%, respectively.
An attractive feature of an analytical procedure is its relative freedom from interferences. The selectivity of the proposed procedure for the assay of captopril and thioguanine was identified by studying the effect of excipients that often accompany with captopril and thioguanine in pharmaceutical
formulations. Samples containing 50 nmol L-1 captopril and/
or thioguanine in the absence and presence of excipients were analyzed by means of the proposed procedure. Tolerance limit was defined as the concentrations which
give an error of ≤5% in the determination of captopril and/
or thioguanine. The effects of all examined compounds at several molar ratios over captopril and thioguanine on the measured analytical concentration are given in Table 2. The results show no significant interference from excipients. This is due to the fact that in acidic media, pH (~3.5), many organic substances can not make complex with Cu(I) in aqueous media.
Table 1. Characteristics of the calibration plots of captopril and thioguanine under the optimum conditions
Species Regression equation* r LDR** LOD** LOQ**
Slope (b) Intercept (a)
Captopril 23.974 (± 2.2) 11.66(± 12.7) 0.997 0.5 – 10 0.3 0.5
17.07(± 3.2) 113.96(± 21.4) 0.997 10 – 100
Thioguanine 38.68(± 2.9) 33.14(± 9.7) 0.994 0.15 – 10 0.08 0.15
20.17(± 0.9) 262.47(± 37.8) 0.990 10 – 100
8.10(± 2.1) 1482.9(± 44.6) 0.990 100 – 180
* Ip (nA) = bC (nmol L-1) + a; ** nmol L-1
Table 2. Maximum tolerable concentration of interfering species in the present of 50 nmol L-1 captopril and/or 50 nmol L-1 thioguanine
Species Tolerance limit (mol/mol)
L-Serine, Alanine, L -Asparag-ine, L-Phenylalanine, Glycine,
L-Threonine, L-Proline, Histi-dine, Methionine, Ascorbic Acid,
DL-Glucose, Lactose, Saccarose, Fructose, Benzoic acid, Methanol, Ethanol, Urea, Fe(II), Fe(III), NO2
-1000
Cystine 100
DL-Tryptophan 50
Application
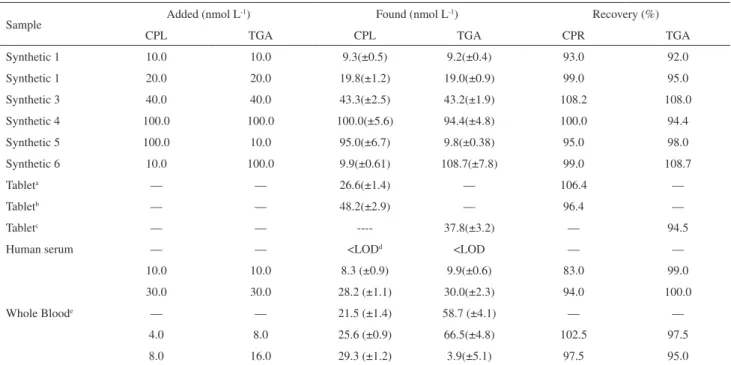
To investigate the applicability of the proposed method for the stripping voltammetric determination of captopril and thioguanine, the method was applied to the determination of captopril and thioguanine in synthetic mixed samples, tablets and human serum by standard addition method. The results are given in Table 3. As it is obvious, the results obtained by the proposed method reveal the capability of the method for determination of captopril and thioguanine in pharmaceutical and biological fluids without considerable error.
Conclusion
The present study demonstrates that the adsorptive stripping voltammetric analysis of captopril and thioguanine in the presence of copper(II) is a good method for determination of ultra trace amount of captopril and thioguanine. According to our knowledge, it is the first method that offered for simultaneous determination of captopril and thioguanine in real samples. In conclusion, the above system, offers a practical potential for selective trace determination of captopril and thioguanine, high sensitivity and simplicity in the presence of amino acids, good repeatability, suitable speed (less than 6 min for each test), good accuracy, and lower detection limits that have
Table 3. Determination of captopril and thioguanine in synthetic and real samples (n=4)
Sample Added (nmol L
-1) Found (nmol L-1) Recovery (%)
CPL TGA CPL TGA CPR TGA
Synthetic 1 10.0 10.0 9.3(±0.5) 9.2(±0.4) 93.0 92.0
Synthetic 1 20.0 20.0 19.8(±1.2) 19.0(±0.9) 99.0 95.0
Synthetic 3 40.0 40.0 43.3(±2.5) 43.2(±1.9) 108.2 108.0
Synthetic 4 100.0 100.0 100.0(±5.6) 94.4(±4.8) 100.0 94.4
Synthetic 5 100.0 10.0 95.0(±6.7) 9.8(±0.38) 95.0 98.0
Synthetic 6 10.0 100.0 9.9(±0.61) 108.7(±7.8) 99.0 108.7
Tableta — — 26.6(±1.4) — 106.4 —
Tabletb — — 48.2(±2.9) — 96.4 —
Tabletc — — ---- 37.8(±3.2) — 94.5
Human serum — — <LODd <LOD — —
10.0 10.0 8.3 (±0.9) 9.9(±0.6) 83.0 99.0
30.0 30.0 28.2 (±1.1) 30.0(±2.3) 94.0 100.0
Whole Bloode — — 21.5 (±1.4) 58.7 (±4.1) — —
4.0 8.0 25.6 (±0.9) 66.5(±4.8) 102.5 97.5
8.0 16.0 29.3 (±1.2) 3.9(±5.1) 97.5 95.0
CPL: Captopril; TGA: Thioguanine; aLabeled: Captopril (25 mg) for each tablet; bLabeled: Captopril (50 mg) for each tablet; cLabeled: Thioguanine (40
mg) for each tablet; d Limit of detection; eBlood samples were taken from people who had heart failure and leukemia together.
not been presented together in the previously reported literature.
Acknowledgments
The authors gratefully acknowledge the support of this work by Research Council of Isfahan University of Technology (IUT). Also the assistance of Omid Hospital staff for collecting patients’ blood is gratefully acknowledged.
References
1. Florey, K. Analytical Profiles of Drug Substances, Academic Press: New York, 1982.
2. Ioannides, X.; Economou, A.; Voulgaropoulos, A.; J. Pharm.
Biomed. Anal.,2003, 33, 309.
3. Goodman, A.; Goodman, L. S.; Rall, T. W.; Murad, F.; Las Bases
Farmacologicas de la Terapeutica, Panamericana: Madrid,
1989.
4. Korolkovas, A.; Essentials of Medicinal Chemistry, Wiley: New York, 1988.
5. Katazung, B. G.; Basic & Clinical Pharmacology, Prentice-Hall: New Jersey, 1992.
6. Nelson, J. A.; Carpenter, J. W.; Rose, L. M.; Adamson, D. Y.;
Cancer Res. 1975, 35, 2872.
8. Ouyang, J.; Baeyens, W. R. G.; Delanghe, J.; Van der Weken, G.; Van Daele, W.; de Keukeleire, D.; Garcia Campana, A. M.;
Anal. Chim. Acta1999, 386, 257.
9. Tache, F.; Farca, A.; Medvedovici, A.; David, V.; J. Pharm.
Biomed. Anal. 2002, 28, 549.
10. Huang, T.; He, Z.; Yang, B.; Shao, L.; Zheng, X.; Duan, G.; J.
Pharm. Biomed. Anal. 2006, 41, 644.
11. Mirza, T.; Tan, H. S. I.; J. Pharm. Biomed. Anal.2001, 25, 39.
12. El Walily, A. F. M.; Razak, O. A.; Belal, S. F.; Bakry, R. S.; J.
Pharm. Biomed. Anal. 1999, 21, 439.
13. Arroyoa, C.; Calulla, C. L.; Capdevilaa, L. G.; Gichb, I.; Barbanojb, M.; Bonala, J.; J. Chromatogr. B1997, 688, 339. 14. Amini, M.; Zarghi, A.; Vatanpour, H.; Pharm. Acta. Helvetiae
1999, 73, 303.
15. Bahmaeia, M.; Khosravi, A.; Zamiri, C.; Massoumi, A.; Mahmoudian, M.; J. Pharm. Biomed. Anal.1997, 15, 1181. 16. Askal, H. F.; Talanta1991, 38, 1155.
17. Emara, M. K.; Mohamed, I. A. M.; Askal, F. H.; Anal. Lett. 1993, 26, 2385.
18. Karlicek, R.; Solich, P.; Pharmazie1998, 53, 549.
19. Tzanavaras, P.D.; Themelis, D.G.; Economou, A.; Theodoridis,
G.; Talanta2002, 57, 575.
20. Imai, K.; Toyoka, T., Watanabe, Y.; Anal. Biochem. 1983, 128, 471.
21. Thomas, A.D.; Talanta1976, 23, 383.
22. Russell, J. D.; Rubenstein, L.; Anal. Biochem. 1996, 242, 136.
23. Zhang, Z. D.; Baeyens, W. R. G.; Zhang, X. R.; Van der Weken,
G.; J. Pharm. Biomed. Anal.1996, 14, 939.
24. Erdmann, G. R.; Steury, J. C.; Carleton, B. C.; Stafford, R. J.; Bostrom, B. C.; Canafax, D. M.; J. Chromatogr. Biomed. Appl.
1991, 571, 149.
25. Fraga, P. M.; Gonzalez, E.B.; Medel, A.S.; Anal. Chim. Acta
1988, 212, 181.
26. Pike, M.G.; Franklin, C. L.; Mays, D. C.; Lipsky, J. J.; Lowry, P. W.; Sandborn, W. J.; J. Chromatogr. B 2001, 757, 1. 27. Wang, W.; Wang, S. F.; Xie, F.; Sens. Actuators, B 2006, 120,
238.
28. Stefan, R. I.; Van Staden, J. F.; Aboul-Enein, H. Y.; Talanta
2000, 51, 969.
29. Siangproh, W.; Ngamukot, P.; Chailapakul, O.; Sens. Actuators, B2003, 91, 60.
30. Wakabayashi, H.; Yamato, S.; Nakajima, M.; Shimada, K.; J.
Pharm. Biomed. Anal. 1994, 12, 1147.
31. Stefan, R. I.; Van Staden, J. F. H. ; Aboul–Enein, Y.; Biosens.
Bioelectron. 2000, 15, 1.
32. Palomeque, M. E.; Fernandez Band, B. S.; J. Pharm. Biomed.
Anal. 2002, 30, 547.
33. Parham, H.; Zargar, H.B., Talanta2005, 65, 776.
34. Passamonti, P.; Bartocci, V.; Pucciarelli, F.; J. Electroanal.
Chem. Interf. Electrochem.1987, 230, 99.
35. Torreggiani, A.; Taddei, P.; Tosi, M. R.; Tugnoli, V.; J. Mol.
Struct. 2001, 565, 347.
36. Gao, X. Handbook on the Physics and Chemistry of Rare Earths; Elsevier: Amsterdam, 1986.
37. Hajian, R.; Shams, E.; J. Iran. Chem. Soc. 2006, 3, 32. 38. Miller, J. C.; Miller, J. N. Statistics for Analytical Chemistry;
4th ed., Ellis-Horwood: New York, 1994.