Article
*e-mail: [email protected]
Application of Haar and Mexican Hat Wavelets to Double Divisor-Ratio Spectra
for the Multicomponent Determination of Ascorbic Acid, Acetylsalicylic Acid
and Paracetamol in Effervescent Tablets
Erdal Dinç*
,aand Dumitru Baleanu
b,caDepartment of Analytical Chemistry, Faculty of Pharmacy, Ankara University,
06100, Tandolan, Ankara, Turkey
bDepartment of Mathematics and Computer Sciences, Faculty of Arts and Sciences, Çankaya University,
06530 Balgat, Ankara, Turkey
cNational Institute for Laser, Plasma and Radiation Physics,Institute of Space Sciences,
Magurele-Bucharest, P.O. Box MG-23, R 76911, Romania
A determinação simultânea de ácido ascórbico (AA), ácido acetilsalicílico (ASP) e paracetamol (PAR) em misturas sintéticas e tabletes efervescentes foi realizada usando-se as técnicas de transformações de Haar e transformações de onda pequena tipo chapéu mexicano (HAAR-CWT e MEXH-CWT, respectivamente), juntamente com a técnica de divisor duplo. Os métodos de processamento de sinal são baseados na aplicação de HAAR-CWT e MEXH-CWT aos espectros relativos com divisor duplo (DDRS). Estes espectros foram obtidos pela divisão do espectro de absorção do composto puro e suas misturas ternárias, por um divisor duplo ou espectro padrão correspondente à mistura de dois compostos em mistura ternária. O uso combinado de HAAR-CWT e MEXH-HAAR-CWT com espectros relativos com divisor duplo (DDRS) foi denominado DDRS-HAAR CWT e DDRS-MEXH CWT. Para avaliar a habilidade ou aplicabilidade dos métodos desenvolvidos DDRS-CWT, foi aplicado como comparação, o método espectrofotométrico por derivada de espectros relativos com divisor duplo (DDRS-DS), às amostras mencionadas acima, contendo AA, ASP e PAR. Resultados satisfatórios foram obtidos.
Simultaneous determination of ascorbic acid (AA), acetylsalicylic acid (ASP) and paracetamol (PAR) in their synthetic mixtures and effervescent tablets were performed by Haar and Mexican continuous wavelet transforms (HAAR-CWT and MEXH-CWT, respectively) together with double divisor technique. The signal processing methods are based on the application of HAAR-CWT and MEXH-CWT to the double divisor-ratio spectra (DDRS). These spectra were obtained by dividing the absorption spectra of pure compound and its ternary mixtures by a double-divisor or standard spectrum corresponding to a mixture of two compounds in ternary mixture. A combined use of HAAR-CWT and MEXH-CWT with double divisor-ratio spectra (DDRS) was denoted by DDRS-HAAR CWT and DDRS-MEXH CWT. To check the ability or applicability of the developed DDRS-CWT methods, the double divisor-ratio spectra-derivative spectrophotometric (DDRS-DS) method, as a comparison method, was applied to the above mentioned samples containing AA, ASP and PAR and satisfactory results were obtained.
Keywords: Haar wavelet transform, mexican wavelet transform, double divisor-ratio spectra, ternary mixture analysis, effervescent tablet
Introduction
Analytical studies related to the quality control and
methods are found to be preferable instead of hyphenated analytical instrumentations or techniques such as liquid mass spectroscopy, gas chromatography-mass spectroscopy, liquid chromatography-nuclear magnetic resonance, etc., due to the fast quantitative resolution of samples containing two or more substances without needing any chemical pretreatment. In addition of that, the above mentioned hyphenated techniques require a prior step such as derivatization, extraction and other tedious analytical process during analysis. In some cases, these analytical techniques may not give desirable results for some of complex analytical problems. On the other hand, the related techniques having complex components bring high cost and time consumption.
Taking into account all above arguments, the quantitative spectrophotometric resolution of the mixtures of two or more compounds having overlapped spectra is an interesting issue for the analytical chemistry. Besides, the existing spectrophotometric methods were found to be very easy to apply, very rapid, sensitive and yet very cheap for analysis of mixture.
Several spectrophotometric methods, such as derivative spectrophotometry,1-5 ratio spectra derivative method,6 ratio spectra derivative-zero crossing method,7-9 DDRS-DS method10-14 and double divisor-ratio spectra derivative-zero crossing method15 have been reported in the literature and applied for ternary and quaternary mixtures. However, it was observed that the derivative spectrophotometry and ratio spectra derivative method provide a good analytical resolution of binary mixtures but these two methods do not give always desirable results for the analysis of ternary and quaternary mixtures. For the ternary mixtures, ratio spectra-derivative-zero-crossing and DDRS-DS methods have been applied but these spectrophotometric methods contain some limitations in their analytical applications.7-14 When DDRS-DS method is applied for resolving a ternary mixture, the selection of the optimal double divisor concentrations, the selection of interval, the use of appropriate smoothing function for deformed spectra and the use of the scaling factor for low signal amplitudes play a very important role for obtaining the highest spectral recovery. If the above spectral conditions are not fulfilled, then the obtained analytical results lead us to some wrong interpretation.
For the quaternary mixture analysis a method based on the use of the double divisor-ratio spectra derivative method and zero-crossing technique was suggested.15 For resolving the complex mixtures, the analytical chemist needs new analytical methods or approaches to obtain accurate, precise and safe results. Therefore, the analytical chemists have focused mainly to the use of new technological instrumentations and new mathematical algorithms or the
combined use of the mentioned approaches together with traditional analytical techniques.
In this context, the wavelet method is a powerful tool for signal processing in many branches of science and engineering.16,17 In the last decade the developments of wavelet transform (WT) methods and their applications in the analytical chemistry (see for example Refs.16-19 and the references therein) have significantly amplified the potential power of various spectral techniques. The CWT approach is a powerful signal processing method for data reduction, de-noising, baseline correction and resolution of multi-component overlapping spectra.
To overcome the above mentioned drawbacks of the classical spectrophotometric and separation techniques, CWT was used for the simultaneous determination of active compounds in samples. For example, in our previous studies, the CWT method in combination with zero-crossing and single divisor-ratio spectra were directly applied to multicomponent determination and satisfactory results were observed.20-27
In this study, the main aim was to develop a new hybrid approach consisting of DDRS procedure followed by identification of appropriate CWT families for resolving a ternary mixture consisting of AA, ASP and PAR. After the identification of the optimal wavelet families providing the best spectral recoveries and displaying the ability and applicability of this new signal processing approach, HAAR CWT and DDRS-MEX CWT were applied to the simultaneous quantitative resolution of the above compounds in their ternary mixtures and effervescent tablets. For a comparison, DDRS-DS approach as a literature method was applied to the same ternary mixture to check the proposed DDRS-CWT methods.11 The assay results obtained were compared with each other and a good agreement for the application of the investigated methods to the synthetic and real samples was observed.
Experimental
Apparatus and software
USA). The CWT calculations were performed by means of Wavelet toolbox in MATLAB 7.0 and the DS calculations and calibrations were performed by using Microsoft Excel.
Pharmaceutical preparation
Commercial AFEBRYL effervescent tablets produced by Laboratories SBM Farmaceutica, N.V., Belgium) consisting of 300 mg AA, 300 mg ASP and 200 mg PAR per tablet were analyzed by using the
proposed DDRS-HAAR CWT, DDRS-MEXH CWT and DDRS-DS methods.
Standard solution
Stock solutions of 25 mg 100 mL-1 AA, ASP and PAR for each compound were prepared in methanol. A standard series of the solutions containing 8-28 g mL-1 for each compound were obtained from the stock solutions for the preparation of DDRS-HAAR CWT, DDRS-MEXH and DDRS-DS methods. Three different validation sets of 18 mixture solutions containing AA, ASP and PAR were also prepared by using the same stock solutions. All dilutions made with methanol (Merck).
Effervescent tablet analysis
Twenty commercial effervescent tablets were weighted and powdered in a mortar. A tablet amount was transferred to a 100 mL calibrated flask and dissolved in 100 mL methanol and stirred until effervescence tablet particles dissolved completely. After dissolution process, these prepared solutions were filtered with 0.2 m disposable membrane filter (Sartorious, minisart, = 0.20 m) by using an injector. The final solution was diluted to the working concentration range for application of the investigated methods. All the solutions were prepared freshly and protected from light.
Theoretical aspects
Wavelet method
The most general principle of the wavelet method is to use both dilatations and translations. As it is very well known, commonly used wavelets form a complete orthonormal system of functions with a finite support. As a result, by changing a scale they can distinct the local characteristics of a signal at various scales, and by translations they cover the whole region in which it is analyzed. CWT method represents an important signal processing technique for the overlapping peak resolution and for the significant peak identification. This method is successfully applied to the
spectrophotometric multicomponent analysis of relevant compounds in samples. For a given mother wavelet ( ) by scaling (or dilatation) and shifting (or translation) of
( ) a set of functions denoted by a, b( ) is obtained as follows
, (1)
where,a denotes the scale parameter, which is a variable, used to control the scaling, b is the translation parameter
controlling the translation and R represents the domain of real numbers.17 Therefore, CWT of a given signal f ( ) is defined as
(2)
where the superscript * is the complex conjugate and ¢f( ) a,b² represents the inner product of function f( )
onto the wavelet function a,b( ). The wavelet is called invertible if the following condition
(3)
is satisfied.
In this study we are dealing with Haar and Mexican hat wavelet families.17
Double Divisor-Ratio Spectra procedure
The DDRS procedure has been used with derivative spectrophotometry for resolving ternary and quaternary mixtures systems.10-15
Let us consider a mixture containing three compounds X, Y and Z. Under the conditions that the Beer-Lambert’s law is valid for all compounds over the whole wavelength range used and if the path length is considered as 1 cm we can write the following
(4)
where, Am, irepresents the absorbance of the mixture at wavelength, i; X, i, y, i and Z, i denote the absorptivites of the X, Y and Z compounds. CX, CY and CZ correspond to the concentrations of X, Y and Z, respectively.
When the standard spectrum of two of compounds in the same ternary mixture are used as a double divisor, we obtain
(5)
(6)
The equation (6) is simplified as
(7)
where represents a constant for
a given linear concentration range with respect to i in a certain region or point of wavelength.
When CºX and CºY are the same or very close to each other, namely CºX= CºYor CºX CºY, we can write
(8)
and the equation (7) becomes
(9)
The equation (9) corresponds to the double divisor-ratio spectra of Z compound in a given ternary mixture. In some cases the same concentration of two compounds in the double divisor can not be used because it keeps the theoretical isospestic point.
Double Divisor Ratio Spectra-Continuous Wavelet transform
The mathematical result obtained by applying a continuous wavelet transform (CWT) to the equation (9) is expressed in the following equation
(10)
In (10), the concentration of Z in its ternary mixture with X and Y is proportional to the coefficients,
at the wavelength, i. If this
DDRS-CWT method is repeated for pure Z compound and its ternary mixture, then the CWT (a,b) coefficients of pure X compound and its ternary mixture in working linear concentration range coincides at some characteris-tic points or regions corresponding to CWT(a,b)(k) = 0 in the working spectral range of wavelength. In this way we introduced the core of DDRS-CWT method for resolving a ternary mixture.
A calibration graph for Z is obtained by measuring the DDRS-CWT amplitudes at the wavelength, i, corresponding to minimum or maximum points of
wavelength, (or corresponding to points or regions next to maxima or minima of wavelength). By using a calibration graph, the amount of Z in its ternary mixture is determined. Similar procedures are repeated for the determination of X and Y compounds in the same ternary mixture.
Double Divisor Ratio SpectraDerivative Spectro -photometry
This combined method is based on the simultaneous use of the derivative spectrophotometry and the DDRS procedure for resolving ternary and quaternary mixtures. In application of DDRS-DS method to the analysis of a given ternary mixture,if we take the derivative of both sides of the equation (9), it can be written the following expression:
(11)
The equation (11) allows determining the concentration of the Z compound in a given ternary mixture without interference from the other components (X and Y ) of the ternary system. If the above mathematical procedure giving the equation (11) is separately repeated for the pure Z compound and its ternary mixtures, the concentration of the Z compound is proportional to the derivative amplitudes of DDRS at the wavelength,
i and a calibration graph is obtained by measuring the
derivative amplitudes of DDRS of the Z compound, versus the increasing concentration of pure Z. By introducing the values of derivative amplitudes of DDRS obtained for ternary mixtures to the above calibration equation, the amount of Z in the ternary mixture can be calculated. The determination of X and Y in samples can be performed by analogous procedures.
In conclusion, DDRS-DS method contains two main steps. The first one is to find an appropriate double divisor concentration corresponding to a standard spectrum of a binary mixture of two compounds in ternary mixture and the second one is to identify the optimal derivation parameters ( interval, appropriate smoothing function and scaling factor) to obtain the best spectral recoveries. If the above conditions are provided, then the derivative of the double divisor-ratio spectra will give the coincidence of a pure compound and its ternary mixture at characteristic points or region of wavelength.
Results and Discussion
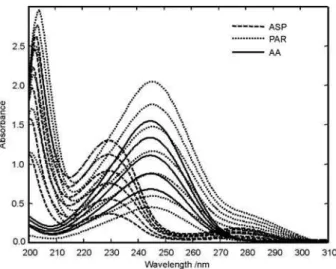
The absorption spectra of AA, ASP and PAR in the linear calibration series of 8-28 g mL-1 overlap in the wavelength range of 200-310 nm as it can be seen in Figure 1. Therefore, the direct determination of the subject compounds in their ternary mixtures and pharmaceutical formulations is not possible due to their strongly overlapping spectra. For that reason, a new hybrid approach based on the application of the CWT methods to the double divisor-ratio spectra was developed for the simultaneous determination of the above-mentioned compounds in their ternary mixtures and effervescent tablets. The confirmation of the hybrid approach was carried out by applying DDRS-DS to the same ternary mixtures and effervescent tablet samples.11
Method development and optimization
The CWT methods have many interesting properties which make it a very good candidate for analyzing a complex mixture in analytical chemistry. Particularly, when the wavelet transformation is applied on a constant it has the same result as a derivation, namely the result is zero. Besides, the CWT signal processing methods make available sharper and smoothing signals that have the higher values of the signal to noise ratio. These appear automatically due to the wavelet algorithm. In some cases, the amplitude of the CWT signals becomes bigger and in all cases the smoothing process appears automatically due to the wavelet algorithm. Therefore, a calibration based on the use of CWT in combination with other classical analytical methods is a very good candidate to improve the accuracy and precision of the analytical results. On the other hand, the application of the DDRS procedure to the ternary mixtures
has the main advantage to eliminate two compounds of that mixture; therefore the evaluations become easier to be done. As it was described, the direct application of classical derivative and wavelet transforms to the absorption spectra may not provide satisfactory results for the quantitative resolution of ternary mixture systems in all cases.
The question we are asking in this manuscript is the following: can we combine the advantages of DDRS and CWT and build a new hybrid analytical approach such that the resolution of the ternary mixture without using any chemical separation procedure will be improved?
To give an example the hybrid approach based on DDRS procedure followed by CWT was applied to the multicomponent determination of AA, ASP and PAR in samples.
This application contains two steps as explained in the theoretical section. The details of the method application to our example are explained below.
Double Divisor Ratio Spectra-Continuous Wavelets Transform
The absorption spectra of AA, ASP and PAR in the calibration series of 8-28 g mL-1 were plotted versus a blank (methanol) and also it was repeated for the synthetic ternary mixtures and the effervescent tablet samples. The absorption spectra corresponding to AA, ASP and PAR are depicted in Figure 1. For the CWT application, we considered 1024 points in the spectral range of 200-302.3 nm.
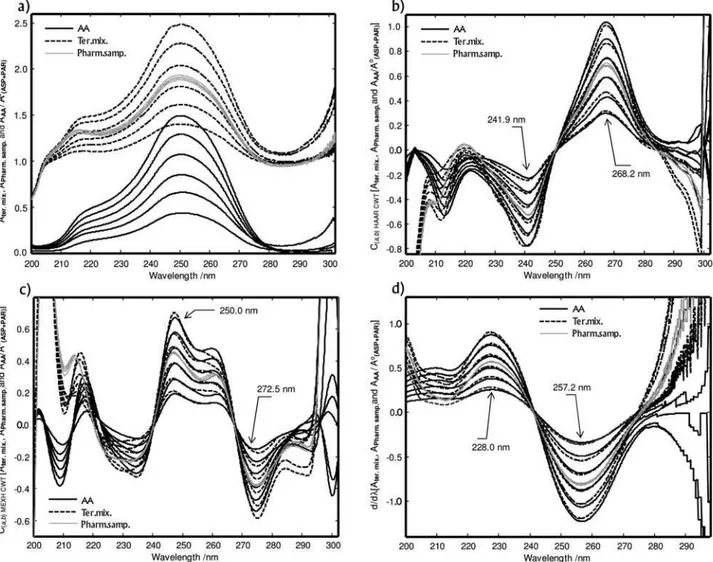
The first step is to determine the concentration of AA. By using the DDRS procedure, the absorption spectra of AA and its ternary samples were divided by the standard double divisor spectrum corresponding to a mixture of 20 g mL-1 ASP and 12 g mL-1 PAR as it can be seen in Figure 2a. In order to get this optimal double divisor we tested several percentage compositions of ASP and PAR and among all obtained results we retained the ones which give the biggest recovery values. After that several CWT families at different scaling factors (a), were applied to the double divisor ratio spectra to obtain elimination of ASP and PAR on the CWT signals and the best spectral recovery values for the determination of AA. It was observed that HAAR-CWT (a=64) and MEX-CWT (a=28) were found to be suitable for the quantitative evaluation of AA in ternary mixture without any effect of ASP and PAR. Taking into account the above analytical conditions, the linear calibration equations for AA were obtained by measuring the HAAR-CWT amplitudes at 241.9 nm and 268.2 nm corresponding to maximum and minimum points of the wavelength as shown in Figure 2b.
In the case of MEX-CWT application (see Figure 2c) we measured the corresponding amplitudes at 250.0 nm and 272.5 nm corresponding to the nearest maximum and minimum of
wavelength and we obtained two calibration equations. The amount of AA in ternary mixture and effervescent tablets were determined by the above calibration graphs.
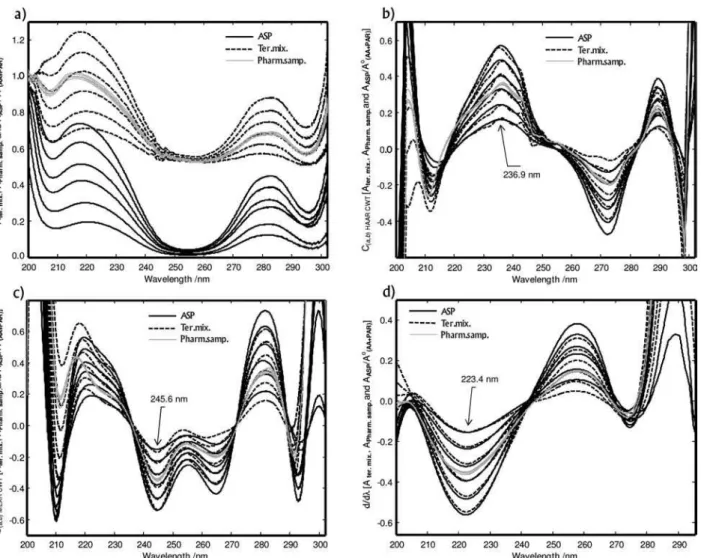
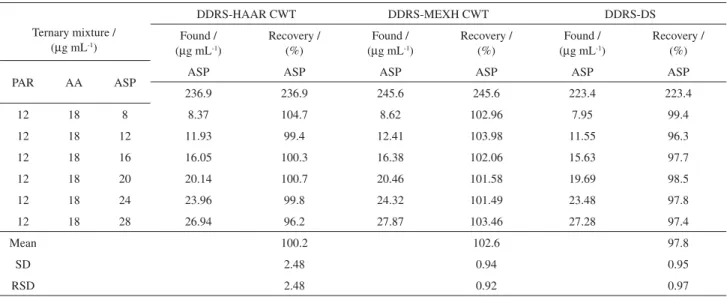
The second step is to find out the concentration of ASP. The same procedure was followed as explained above. In this case the optimal double divisor was found to be 28 g mL-1 AA and 28 g mL-1 PAR and double divisor-ratio spectra were obtained as it is shown in Figure 3a. To obtain zero crossing points for AA and PAR the HAAR-CWT (a=70) and MEX-CWT (a=40) were found to be the optimal families. As it can be seen from Table 1 and Figure 3b and Figure 3c, the calibration graphs of ASP were obtained at 236.9 and 245.6 nm which correspond to the nearest maximum and minimum of the wavelengths. ASP was determined by using the above calibration graphs.
In same manner as before we determined the concentra-tion of PAR. In this case, the optimal double divisor was
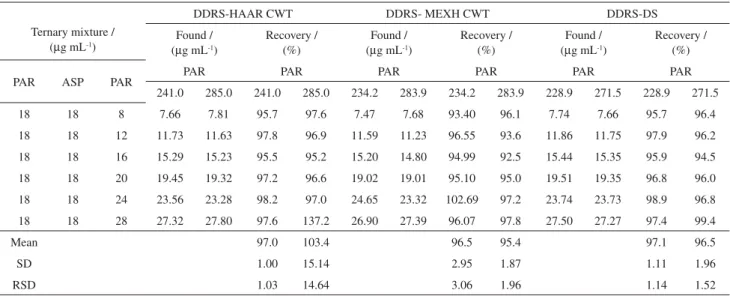
found to be 12 g mL-1 AA and 12 g mL-1 ASP. Then, we applied this obtained double divisor to get the double divisor ratio spectra as shown in Figure 4a. For this case, the optimal wavelet families were reported to be HAAR-CWT (a=256) and MEX-HAAR-CWT (a=70). Table 1 indicates the calibration data at 241.0 nm and 285.0 nm; 234.2 and 283.9 nm corresponding to the nearest minima. Figure 4b and Figure 4c indicate the corresponding graphs.
The linear regression analyses and their statistical results obtained in the above mentioned hybrid analytical methods for the AA, ASP and PAR determinations were presented in Table 1.
Double Divisor Ratio Spectra-Derivative method
In the previous study DDRS-DS method was applied to the quantitative resolution of the same investigated ternary
Figure 2. a) Ratio spectra, b) HAAR-CWT spectra, c) MEXH-CWT spectra and d) first derivative spectra of the ratio spectra of AA in the calibration series of 8, 12, 16, 20, 24 and 28 g mL-1 (—), ternary mixtures [(8 g mL-1 AA + 18 g mL-1 ASP + 12 g mL-1 PAR), (12 g mL-1 AA + 18 g mL-1 ASP + 12 g mL-1 PAR), (16 g mL-1 AA + 18 g mL-1 ASP + 12 g mL-1 PAR), (20 g mL-1 AA + 18 g mL-1 ASP + 12 g mL-1 PAR), (24 g mL-1 AA + 18 g mL-1 ASP + 12 g mL-1 PAR), (28 g mL-1 AA + 18 g mL-1 ASP+ 12 g mL-1 PAR)] (
---) and pharmaceutical samples ( ), when
mixture.11 In this study we applied the same analytical approach for the simultaneous quantitative determination of AA, ASP and PAR in the ternary mixtures by using methanol as a solvent system and different double-divisor concentration (12 g mL-1 PAR and 20 g mL-1 ASP) for AA determination to check the application of the proposed DDRS-CWT methods. For each compound, a calibration series consisting of the concentration range of 8-28 g mL-1 was prepared and the corresponding calibration graphs were obtained as given below.
For the determination of AA in its ternary mixture, DS was applied to the DDRS shown in Figure 2a and DDRS-first derivative spectra were obtained by using =20 nm intervals and the scaling factor 20. The application of this procedure is explained in Figure 2d. The calibration graphs for AA, at 228 and 257.2 nm were obtained by using the relation between the
DDRS-first derivative amplitude and concentration. These calibration graphs were applied to determine the content of AA in the samples.
The other two drugs were determined by using the same procedure which is illustrated briefly in the following.
For ASP we used =20nm, a scaling factor of 20 and the smoothing function ( =5) was applied after the derivation. This process was applied on the spectra illustrated in Figure 3a and the result of it can be seen in Figure 3d. In this case the calibration graph for 223.4 nm was obtained.
The determination of PAR requires a prior smoothing process ( =5nm) for the double divisor-ratio spectra. After that we used the standard method described above, namely we used =20 nm intervals and a scaling factor of 20. The method was applied on Figure 4a and the results are shown in Figure 4d. The calibration graphs were constructed at 228.9 nm and 271.5 nm, respectively.
Figure 3. a) Ratio spectra, b) HAAR-CWT spectra, c) MEXH-CWT spectra and d) first derivative spectra of the ratio spectra of ASP in the calibration series of 8, 12, 16, 20, 24 and 28 g mL-1 (—), ternary mixtures [(8 g mL-1 ASP + 18 g mL-1 AA + 12 g mL-1 PAR), (12 g mL-1 ASP + 18 g mL-1 AA + 12 g mL-1 PAR), (16 g mL-1 ASP + 18 g mL-1 AA + 12 g mL-1 PAR), (20 g mL-1 ASP + 18 g mL-1 AA + 12 g mL-1 PAR), (24 g mL-1 ASP + 18 g mL-1 AA + 12 g mL-1 PAR), (28 g mL-1 ASP + 28 g mL-1 AA + 12 g mL-1 PAR)] (---) and pharmaceutical samples ( ), when a mixture of 28 g mL-1 AA and 28 g mL-1 PAR was used as a double divisor (Ao
The statistical values for the calibration graphs for three investigated compounds are indicated in Table 1.
Method validation
A good linearity in the concentration range of 8-28 g mL-1 for AA, ASP and PAR was observed according
to the correlation coefficients (r) as it is indicated in Table 1. Precision of the developed DDRS-CWT and DDRS-DS approaches was tested by analyzing 18 mixture solutions by dilution of the stock solutions.
The ternary mixtures were designed by considering the concentration of one compound in the calibration series and the remaining two were kept constants according to the
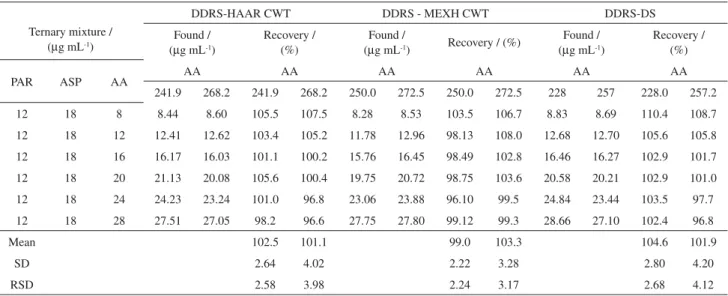
Table 2. Recovery results of AA in its synthetic ternary mixtures by using the proposed analytical signal processing methods
Ternary mixture / ( g mL-1)
DDRS-HAAR CWT DDRS - MEXH CWT DDRS-DS
Found / ( g mL-1)
Recovery / (%)
Found /
( g mL-1) Recovery / (%)
Found / ( g mL-1)
Recovery / (%)
PAR ASP AA AA AA AA AA AA AA
241.9 268.2 241.9 268.2 250.0 272.5 250.0 272.5 228 257 228.0 257.2
12 18 8 8.44 8.60 105.5 107.5 8.28 8.53 103.5 106.7 8.83 8.69 110.4 108.7
12 18 12 12.41 12.62 103.4 105.2 11.78 12.96 98.13 108.0 12.68 12.70 105.6 105.8
12 18 16 16.17 16.03 101.1 100.2 15.76 16.45 98.49 102.8 16.46 16.27 102.9 101.7
12 18 20 21.13 20.08 105.6 100.4 19.75 20.72 98.75 103.6 20.58 20.21 102.9 101.0
12 18 24 24.23 23.24 101.0 96.8 23.06 23.88 96.10 99.5 24.84 23.44 103.5 97.7
12 18 28 27.51 27.05 98.2 96.6 27.75 27.80 99.12 99.3 28.66 27.10 102.4 96.8
Mean 102.5 101.1 99.0 103.3 104.6 101.9
SD 2.64 4.02 2.22 3.28 2.80 4.20
RSD 2.58 3.98 2.24 3.17 2.68 4.12
SD: Standard Deviation; RSD: Relative Standard Deviation.
Table 1. Linear regression analysis and its statistical results by the proposed analytical signal processing methods
Calibration parameter
Drug Method Range / g mL-1)
/ (nm)
Slope (m)
Intercept
(n) r
SE (m)
SE (n)
SE (r)
LOD / g mL-1)
LOQ / g mL-1)
AA
DDRS-HAAR CWT
8-28 241.9 -2.73x10⁻² -9.50x10⁻³ 0.9999 2.22 x10⁻⁴ 4.27 x10⁻³ 3.71 x10⁻³ 1.15 3.83
8-28 268.2 3.74x10⁻² -1.21x10⁻² 0.9995 5.68 x10⁻⁴ 1.09 x10⁻² 9.50 x10⁻³ 2.15 7.15
DDRS-MEXH CWT
8-28 250.0 2.20x10⁻² -1.38x10⁻³ 0.9998 2.17 x10⁻⁴ 4.17 x10⁻³ 3.63 x10⁻³ 1.39 4.64
8-28 272.5 -1.76x10⁻² -2.69x10⁻⁴ 0.9996 2.52 x10⁻⁴ 4.85 x10⁻³ 4.21 x10⁻³ 2.02 6.74
DDRS-DS 8-28 228.0 3.10x10⁻² 2.32x10⁻³ 0.9999 2.22 x10⁻⁴ 4.28 x10⁻³ 3.72 x10⁻³ 1.02 3.38
8-28 257.2 -4.52x10⁻² 2.95x10⁻² 0.9994 7.74 x10⁻⁴ 1.49 x10⁻² 1.30 x10⁻² 2.42 8.07
ASP
DDRS-HAAR CWT
8-28 236.9 2.0 x10⁻² -2.35x10⁻³ 0.9998 2.14 x10⁻⁴ 4.12 x10⁻³ 3.58 x10⁻³ 1.49 4.98
DDRS-MEXH CWT
8-28 245.6 -1.93x10⁻² 3.12x10⁻³ 0.9997 2.46 x10⁻⁴ 4.74 x10⁻³ 4.12 x10⁻³ 1.80 6.01
DDR-DS 8-28 223.4 -2.03x10⁻² 5.82x10⁻³ 0.9997 2.34 x10⁻⁴ 4.50 x10⁻³ 3.92 x10⁻³ 1.63 5.43
PAR
DDRS-HAAR CWT
8-28 241.0 -2.87x10⁻¹ -9.01x10⁻² 0.9999 2.00 x10⁻³ 3.85 x10⁻² 3.34 x10⁻² 0.99 3.29
8-28 285.0 -6.98x10⁻¹ 1.66x10+0 0.9967 2.86 x10⁻² 5.50 x10⁻¹ 4.78 x10⁻¹ 2.36 7.87
DDRS-MEXH CWT
8-28 234.2 -2.89x10⁻² -4.19x10⁻³ 0.9998 2.99 x10⁻⁴ 5.76 x10⁻³ 5.01 x10⁻³ 1.47 4.89
8-28 283.9 -1.20x10⁻¹ 2.53x10⁻¹ 0.9973 4.44 x10⁻³ 8.55 x10⁻² 7.43 x10⁻² 2.13 7.11
DDRS-DS 8-28 228.9 1.02x10⁻¹ 3.41x10⁻² 0.9999 3.47 x10⁻⁴ 6.69 x10⁻³ 1.10 x10⁻³ 0.94 2.22
8-28 271.5 2.78x10⁻¹ -7.03x10⁻¹ 0.9970 5.20 x10⁻³ 2.10 x10⁻³ 5.81 x10⁻² 3.13 7.41
Figure 4. a) Ratio spectra, b) HAAR-CWT spectra, c) MEXH-CWT spectra and d) first derivative spectra of the ratio spectra of PAR in the calibration series of 8, 12, 16, 20, 24 and 28 g mL-1 (—), ternary mixtures [(8 g mL-1 PAR + 18 g mL-1 AA + 18 g mL-1 ASP), (12 g mL-1 PAR + 18 g mL-1 AA + 18 g mL-1 ASP), (16 g mL-1 PAR + 18 g mL-1 AA + 18 g mL-1 ASP), (20 g mL-1 PAR + 18 g mL-1 AA + 18 g mL-1 ASP), (24 g mL-1 PAR + g mL-1 AA + 18 g mL-1 ASP), (28 g mL-1 PAR + 28 g mL-1 AA + 18 g mL-1 ASP)] (---) and pharmaceutical samples ( ), when a mixture of 12 g mL-1 AA and 12 g mL-1 ASP was used as a double divisor (Ao
(AA+ASP)).
Table 3. Recovery results of ASP in its synthetic ternary mixtures by using the proposed analytical signal processing methods
Ternary mixture / ( g mL-1)
DDRS-HAAR CWT DDRS-MEXH CWT DDRS-DS
Found / ( g mL-1)
Recovery / (%)
Found / ( g mL-1)
Recovery / (%)
Found / ( g mL-1)
Recovery / (%)
PAR AA ASP ASP ASP ASP ASP ASP ASP
236.9 236.9 245.6 245.6 223.4 223.4
12 18 8 8.37 104.7 8.62 102.96 7.95 99.4
12 18 12 11.93 99.4 12.41 103.98 11.55 96.3
12 18 16 16.05 100.3 16.38 102.06 15.63 97.7
12 18 20 20.14 100.7 20.46 101.58 19.69 98.5
12 18 24 23.96 99.8 24.32 101.49 23.48 97.8
12 18 28 26.94 96.2 27.87 103.46 27.28 97.4
Mean 100.2 102.6 97.8
SD 2.48 0.94 0.95
pharmaceutical formulation. The corresponding numerical values are indicated in Table 2 for AA, Table 3 for ASP and in Table 4 for PAR, respectively.
The expression of the relative standard deviation (RSD) was calculated as follows
(14)
where, SD denotes the standard deviation and X is the mean of the percentage main recovery. The percentage recoveries and their corresponding RSD values for the precision were
Table 4. Recovery results of PAR in its synthetic ternary mixtures by using the proposed analytical signal processing methods
Ternary mixture / ( g mL-1)
DDRS-HAAR CWT DDRS- MEXH CWT DDRS-DS
Found / ( g mL-1)
Recovery / (%)
Found / ( g mL-1)
Recovery / (%)
Found / ( g mL-1)
Recovery / (%)
PAR ASP PAR PAR PAR PAR PAR PAR PAR
241.0 285.0 241.0 285.0 234.2 283.9 234.2 283.9 228.9 271.5 228.9 271.5
18 18 8 7.66 7.81 95.7 97.6 7.47 7.68 93.40 96.1 7.74 7.66 95.7 96.4
18 18 12 11.73 11.63 97.8 96.9 11.59 11.23 96.55 93.6 11.86 11.75 97.9 96.2
18 18 16 15.29 15.23 95.5 95.2 15.20 14.80 94.99 92.5 15.44 15.35 95.9 94.5
18 18 20 19.45 19.32 97.2 96.6 19.02 19.01 95.10 95.0 19.51 19.35 96.8 96.0
18 18 24 23.56 23.28 98.2 97.0 24.65 23.32 102.69 97.2 23.74 23.73 98.9 96.8
18 18 28 27.32 27.80 97.6 137.2 26.90 27.39 96.07 97.8 27.50 27.27 97.4 99.4
Mean 97.0 103.4 96.5 95.4 97.1 96.5
SD 1.00 15.14 2.95 1.87 1.11 1.96
RSD 1.03 14.64 3.06 1.96 1.14 1.52
Table 5. Determination results of AA, ASP and PAR in commercial effervescent tablets by using the proposed analytical signal processing methods
Drug Method (nm) / Repetition experiments mgper tablet
1 2 3 4 5 Mean SD RSD SE CL
AA
DDRS-HAAR CWT 241.9 313.5 308.9 309.5 311.0 308.7 310.3 1.76 0.57 0.79 1.55
268.2 317.5 309.0 305.5 305.7 310.5 309.6 4.39 1.42 1.96 3.85
DDRS-MEXH CWT 250.0 302.8 300.7 299.3 301.6 302.0 301.3 1.18 0.39 0.53 1.04
272.5 337.0 325.7 320.3 318.7 327.1 325.7 6.44 1.98 2.88 5.65
DDRS-DS 228.0 306.5 302.0 301.1 304.1 306.2 304.0 2.18 0.72 0.97 1.91
257.2 310.9 306.3 303.3 306.6 313.0 308.0 3.47 1.13 1.55 3.05
ASP
DDRS-HAAR CWT 236.9 296.2 302.0 296.1 294.6 303.0 298.4 3.45 1.15 1.54 3.02
DDRS-MEXH CWT 245.6 294.3 299.7 288.4 290.8 302.3 295.1 5.23 1.77 2.34 4.59
DDRS-DS 223.4 294.5 300.0 290.7 293.3 302.5 296.2 4.39 1.48 1.96 3.84
PAR
DDRS-HAAR CWT 241.0 192.9 189.1 189.9 191.5 191.1 190.9 1.31 0.69 0.59 1.15
285.0 212.1 217.3 224.7 223.5 216.1 218.7 4.71 2.15 2.10 4.13
DDRS-MEXH CWT 234.2 210.4 208.4 210.1 213.6 212.1 210.9 1.79 0.85 0.80 1.57
283.9 213.0 214.5 222.1 219.5 207.7 215.4 5.06 2.35 2.26 4.43
DDRS-DS 228.9 190.8 187.3 187.5 189.3 189.4 188.8 1.30 0.69 0.58 1.14
271.5 208.6 214.2 221.4 220.0 212.9 215.4 4.71 2.18 2.10 4.12
SD = Standard Deviation, SE = Standard Error, CL = Confidence Limit. Label claim = 300 mg AA, 300 mg ASP and 200 mg PAR per effervescent tablet.
presented in Table 2 for AA, in Table 3 for ASP and in Table 4 for PAR, respectively.
The limit of detection (LOD) and the limit of quantitation (LOQ) were calculated by using the standard deviation of the intercept and slope values of calibration function and their values were shown in Table 1.
Analysis of effervescent tablets
DDRS-MEXH and DDRS-DS approaches. The assay results of pharmaceutical tablet formulation were indicated in Table 5. It was observed that the determination results are close to each other; therefore a good agreement was found. According to the obtained results, any effect of the excipients on the analysis was not observed during the analysis.
Conclusions
For the multicomponent analysis, HPLC methods require expensive, time consuming and sophisticated apparatus, DS methods have a limited area of applicability and chemometric methods require the knowledge of sophisticated mathematical algorithms and the preparation of appropriated concentration sets. Therefore, the analytical chemist needs various new, less expensive, rapid, and easy to apply analytical methods.
In this study, a new hybrid approach based on the simultaneous use of DDRS and CWT was established and applied to the multicomponent analysis of ternary mixtures and effervescent tablets containing AA, ASP and PAR, without a priori plural steps. The confirmation of the developed DDRS-HAAR and DDRS-MEX were carried out by using DDRS-DS as a standard method. It was reported that AA and ASP gives better recovery results. For commercial effervescent tablets, PAR gives comparable results.
The state of the art of this method is to reduce the problem at the determination of one compound in the ternary mixture. The method contains division and transformation procedures for pure compounds and their ternary mixtures by using a double divisor spectrum consisting of two compounds in ternary mixtures. In these procedures, the transformed coincident spectra corresponding to one or more zero-crossing points of wavelengths should be considered for the determination of one compound in the working linear concentration range. In addition, double divisor concentration plays a very important role to provide the above spectral conditions and to get the spectral recoveries results. If the above conditions are obtained, this method can be applied to analyze the ternary and quaternary mixtures.
The derivative method produces some noises which are mixed with the relevant spectra. The CWT method has the ability to remove the noises (signal/noise ratio is higher) and to produce sharp and higher peak amplitudes. For example, in our application of the DDRS-DS method, we used a scaling factor of 20 to increase the signal amplitude, otherwise we obtained the derivative signals having low amplitudes
The proposed signal processing methods can be applied to the routine analysis and quality control of the commercial effervescent tablets containing AA, ASP and PAR compounds.
We believe that the combination of CWT methods and DDRS approach can be considered as an alternative signal processing method, if the conditions of applicability are obtained, as a substitute of classical derivative methods.
References
1. O’Haver, T. C.; Green, G. L.; Anal.Chem.1976,48, 312. 2. Levillain, P.; Fompeydie, D.; Analysis1986,14, 1.
3. El-Sayed, A. A. Y.; El-Salem, N. A.; Anal. Sci.2005,21, 595. 4. Bosch, O. C.; Sanchez, R. F.; Anal.Chim. Acta2004,518, 1. 5. Karpi ska, J.; Talanta2004,64, 801.
6. Salinas, F.; Berzas Nevado, J. J.; Mansilla, M. A.; Talanta1990,
37, 347.
7. Berzas Nevado, J. J.; Cabanilas, C. G.; Salinas, F.; Talanta1992,
39, 547.
8. Dinç, E.; Kökdil, G.; Onur, F.; J. Pharm. Biomed. Anal.2001,
26, 769.
9. Kelani, K. M.; J. AOAC Int.2005,88, 1126. 10. Dinc, E.; Onur, F.; Anal. Chim. Acta1999,359, 93. 11. Dinç, E.; Talanta 1999,48, 1145.
12. Dinç, E.; Baydan, E.; Kanbur, M.; Onur, F.; Talanta2002,58, 579. 13. Markopoulou, C. K.; Malliou, E. T.; Koundourellis, J. E.; J.
Pharm. Biomed. Anal.2005,37, 249.
14. Markopoulou, C. K.; Malliou, E. T.; Koundourellis, J. E.;
Farmaco2005,60, 755.
15. Ghasemi, J.; Abbasi, B.; Niazi, A.; Nadaf, E.; Mordai, A.; Anal.
Lett.2004,37, 2609.
16. Walczak, B.; Wavelets in Chemistry, Elsevier Press: Amsterdam, The Netherlands, 2000.
17. Daubechies, I.; Ten Lectures on Wavelets, Society for Industrial and Applied Mathematics: Philadelphia, 1992.
18. Ma, C. X.; Shao, X. B.; J. Chem. Inform. Compt. Sci.2004,
44, 907.
19. Dinç, E.; Baleanu, D.; A Review on the Wavelet Transform Applications in Analytical Chemistry. Mathematical Methods
in Engineering, Tas, K.; Tenreiro Machado, J. A.; Baleanu, D.,
eds.; Springer: The Netherlands, 2007, pp. 265-284. 20. Dinç, E.; Baleanu, D.; Spectrochim. Acta, Part A 2006,63, 631. 21. Dinç, E.; Baleanu, D.; Talanta2003,59, 707.
22. Dinç, E.; Baleanu, D.; J. Pharm. Biomed.Anal.2003,31, 969. 23. Dinç, E.; Baleanu, D.; J.AOAC Int.2004,87, 360. 24. Dinç, E.; Baleanu, D.; J.AOAC Int.2004,87, 834.
25. Dinç, E.; Kanbur, M.; Baleanu, D.; Pharmazie2005,60, 892. 26. Dinç, E.; Baleanu, D.; Üstündag, Ö.; Spectrosc. Lett.2003,36, 341. 27. Dinç, E.; Baleanu, D.; Tas, A.; Rev. Chim. (Bucuresti)2006,
57, 626.
Received: May 12, 2007