Debora Soares-Geraldo(a) Taís Scaramucci(a)
Washington Steagall-Jr(a) Sheila Regina Maia Braga(a) Maria Angela Pita Sobral(a)
(a) Department of Restorative Dentistry, School
of Dentistry, University of São Paulo, São Paulo, Brazil.
Corresponding author:
Maria Angela Pita Sobral
E-mail: [email protected]
Received for publication on May 18, 2011 Accepted for publication on Jul 13, 2011
Interaction between staining and
degradation of a composite resin in
contact with colored foods
Abstract: Composite resins might be susceptible to degradation and staining when in contact with some foods and drinks. This study eval-uated color alteration and changes in microhardness of a microhybrid composite after immersion in different colored foods and determined whether there was a correlation between these two variables. Eighty com-posite disks were randomly divided into 8 experimental groups (n = 10): kept dry; deionized water; orange juice; passion fruit juice; grape juice; ketchup; mustard and soy sauce. The disks were individually immersed in their respective test substance at 37 ºC, for a period of 28 days. Su-pericial analysis of the disk specimens was performed by taking micro-hardness measurements (Vickers, 50 g load for 45 seconds) and color alterations were determined with a spectrophotometer (CINTRA 10- us-ing a CIEL*a*b* system, 400-700 nm wavelength, illuminant d65 and standard observer of 2º) at the following times: baseline (before immer-sion), 1, 7, 14, 21 and 28 days. Results were analyzed by ANOVA and Tukey’s test (p < 0.05). Both variables were also submitted to Pearson’s correlation test (p < 0.05). The passion fruit group underwent the great-est microhardness change, while the mustard group suffered the greatgreat-est color alteration. Signiicant positive correlation was found between the two variables for the groups deionized water, grape juice, soy sauce and ketchup. Not all color alteration could be associated with surface degra-dation.
Descriptors: Composite Resins; Coloring Agents; Hardness; Dental Restoration Failure.
Introduction
In the era of the tooth-colored dental restorations, color stability has become one of the major requirements of restorative materials. It is well known that the original color of composite resins can be changed with-in a certawith-in period of time.1 The long-term color changes in composite
restorations can occur due to surface and marginal staining, microleak-age, wear-dependent surface changes, and internal material deterioration, which may compromise the visual acceptability of these restorations and result in additional expenses for replacement.2 Secondary caries was the
main reason for failure of resin composite, followed by discoloration.3
This process concerns patient and dentist and consumes time and money.4
Surface staining of a composite is mainly related to the absorption or
adsorption of coloring substances,4-7 such as those
found in the patient’s diet. In modern societies diet includes a wide range of colored foods and drinks, which can affect the natural color of composite res-torations to different degrees. So far, many studies have extensively reported the harmful effects of cof-fee, tea, grape juice, yerba mate and cola drinks on dental composites.8-10 More recently, other
reseach-ers4,11-13 reported the color changes promoted by
lemon juice, cherry juice, carrot juice, red wine, snow cone syrup and grape drink. However, there are some other important colored foods that are very com-mon in the patient’s diet, such as ketchup and mus-tard, and yet, the effects of these foods on the color of composites have received little attention. Fontes
et al.10 advised additional studies to investigate the
color stability of composite resin-based materials. In addition to color alteration, some of these products can also cause supericial degradation on the composite surface by reducing its microhard-ness,14 which could possibly favor more supericial
staining. Corroborating this theory, Okte et al.15
showed decreased microhardness values of microhy-brid and nano resin composites after immersion in both, coffee and wine solutions. Therefore, the aim of this study was to evaluate the color and micro-hardness alterations of a composite resin when im-mersed in different colored foods and to determine whether there is a correlation between these two variables.
Methodology
Disk specimens preparation
Eighty cylindrical disk specimens of a
microhy-brid composite resin (Filtek Z-250, shade A1, 3M, St. Paul, USA) were prepared using a brass mold. Forty of these disk specimens were 10 mm in diam-eter and 1.5 mm high (color assessment), and forty were 5 mm in diameter and 2 mm high (microhard-ness evaluation). Composite was dispensed, ma-nipulated, and polymerized according to the man-ufacturers’ instructions. The mold was placed on a transparent polyester ilm strip (3M Flip-Frame, 3M Visual Systems Division, Austin, USA) and a glass microscope slide. The composite was packed into the mold until it was intentionally overilled. The material was covered with another polyester ilm strip and a glass microscope slide. The excess material was extruded by light pressure, and the resin composite was light polymerized with a halo-gen light unit (Astralis 3, Ivoclar-Vivadent, Schaan, Liechtenstein) with the light tip 1 mm away from the specimens. The energy density used was 500 mW/ cm² measured with a radiometer.
Experimental procedures
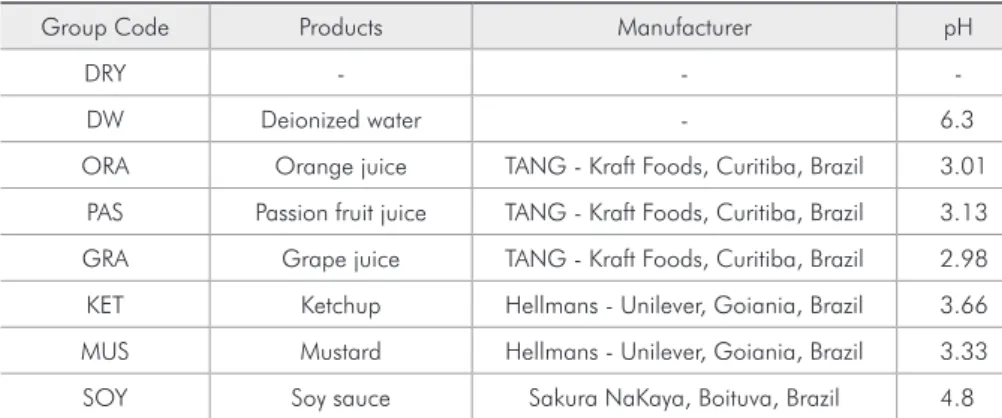
The disk specimens were randomly divided into 8 experimental groups (n = 10, in which 5 were 10 mm in diameter and 5 were 5 mm in diameter) as described in Table 1. Each disk specimen was individually immersed in 25 ml of its respective solution at 37 ºC for a total of 28 days. With the exception of the dry group, the solutions were re-placed every 7 days. Before each evaluation, the disk specimens were washed with distilled water, gently brushed and blot dried with absorbent paper. The juices were diluted according to the manufacturers’ instructions.
Group Code Products Manufacturer pH
DRY - -
-DW Deionized water - 6.3
ORA Orange juice TANG - Kraft Foods, Curitiba, Brazil 3.01
PAS Passion fruit juice TANG - Kraft Foods, Curitiba, Brazil 3.13
GRA Grape juice TANG - Kraft Foods, Curitiba, Brazil 2.98
KET Ketchup Hellmans - Unilever, Goiania, Brazil 3.66
MUS Mustard Hellmans - Unilever, Goiania, Brazil 3.33
SOY Soy sauce Sakura NaKaya, Boituva, Brazil 4.8
Color assessment
Quantitative color measurements were per-formed in the 10 mm diameter disk specimens with the use of an ultraviolet-visible recording spectro-photometer (Cintra 10UV- Visible Spectrometer, GBC Scientiic Equipment, Dandenong, Australia) according to the CIELAB (Commission Interna-tionale de I’Eclairage L*, a*, b*) system. The il-lumination source was provided by a light with 400-700 nm of wavelength, standard illuminant D65, standard observer of 2°, against a white back-ground. The measurements were made at the follow-ing times: baseline (after the polymerization); after 1 day of immersion in the solutions (T1); after 7 (T2); 14 (T3); 21 (T4) and 28 (T5) days. Each specimen was measured twice by the same person and the ∆E
values were calculated according to the formula.
where:
∆L = LTx−LTbaseline ∆a = aTx−aTbaseline ∆b = bTx−bTbaseline
Tx = T1, T2, T3, T4, T5
It is known that under clinical conditions, the human eye can detect ∆E alterations with values above 3.3.16 Therefore, qualitatively, ∆E > 3.3 can
be considered unacceptable, and ∆E < 3.3 impercep-tible to the normal observer.
Microhardness evaluation
Vickers surface microhardness (HMV 2000, Shi-madzu, Kyoto, Japan) was determined by perform-ing 5 indentations with 50g load for 45 seconds (100 µm of distance), at the following times: after polymerization of the specimens (baseline), after 24hs (T1), 7 (T2), 14 (T3), 21 (T4) and 28 days (T5) of immersion in the solutions, where ∆V (delta Vick-ers) represents the difference between the initial mi-crohardness and the measurements made after each experimental time.
Statistical analysis
Data were submitted to statistical analysis using the SPSS (Statistical Package for the Social Sciences - SPSS Inc., Chicago, USA). The data obtained were submitted to 2-way ANOVA (experimental time × staining solutions), and Tukey’s tests were carried out for statistical comparisons and statistical signii-cance (p < 0.05). To establish a possible relationship between staining and microhardness changes, Pear-son’s correlation test was used to compare the ∆E
and ∆V values for each solution in all the experimen-tal times of evaluation (p < 0.05).
Results
Color change
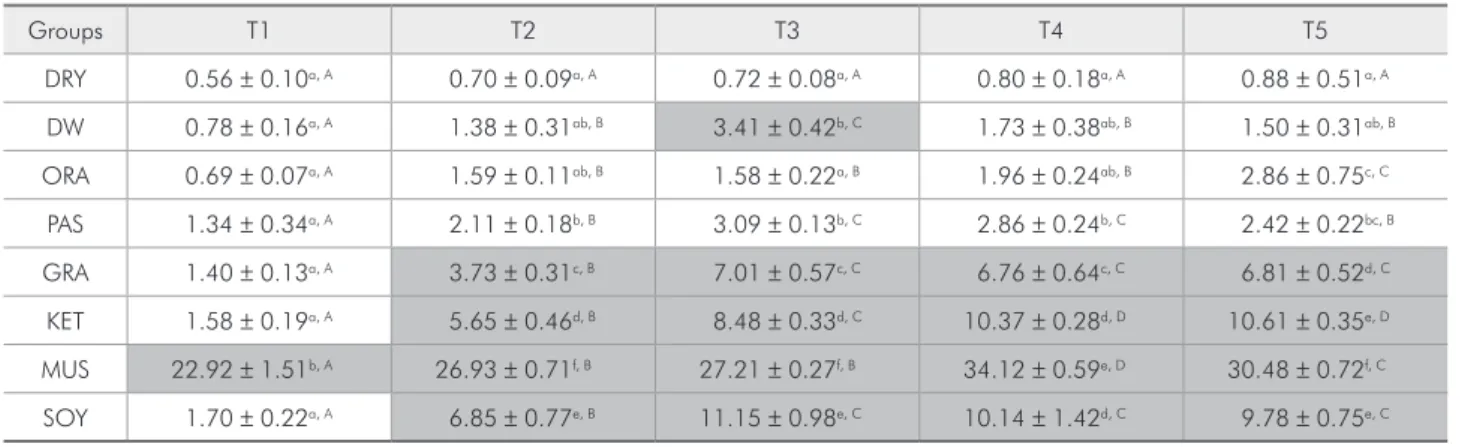
Means, standard deviations (±) and statisti-cal difference of color changes (∆E) for the tested substances at each experimental time are shown in Table 2. During all experimental times the groups
Table 2 - Means and standard deviations of ∆E values for each experimental time.
Groups T1 T2 T3 T4 T5
DRY 0.56 ± 0.10a, A 0.70 ± 0.09a, A 0.72 ± 0.08a, A 0.80 ± 0.18a, A 0.88 ± 0.51a, A
DW 0.78 ± 0.16a, A 1.38 ± 0.31ab, B 3.41 ± 0.42b, C 1.73 ± 0.38ab, B 1.50 ± 0.31ab, B
ORA 0.69 ± 0.07a, A 1.59 ± 0.11ab, B 1.58 ± 0.22a, B 1.96 ± 0.24ab, B 2.86 ± 0.75c, C
PAS 1.34 ± 0.34a, A 2.11 ± 0.18b, B 3.09 ± 0.13b, C 2.86 ± 0.24b, C 2.42 ± 0.22bc, B
GRA 1.40 ± 0.13a, A 3.73 ± 0.31c, B 7.01 ± 0.57c, C 6.76 ± 0.64c, C 6.81 ± 0.52d, C
KET 1.58 ± 0.19a, A 5.65 ± 0.46d, B 8.48 ± 0.33d, C 10.37 ± 0.28d, D 10.61 ± 0.35e, D
MUS 22.92 ± 1.51b, A 26.93 ± 0.71f, B 27.21 ± 0.27f, B 34.12 ± 0.59e, D 30.48 ± 0.72f, C
SOY 1.70 ± 0.22a, A 6.85 ± 0.77e, B 11.15 ± 0.98e, C 10.14 ± 1.42d, C 9.78 ± 0.75e, C
Different letters show statistical difference (p < 0.05) between the products tested. Capital letters show statistical difference between the experimental times for each product. ∆E values considered unacceptable (perceived by the human eye).
DRY, PAS and ORA did not present color altera-tions perceptible to the observer (∆E < 3.3). DW group showed some change in the color (∆E = 3.41) after 14 days (T3); however, until the end of the ex-periment, it was able to recover its original color. The groups KET, GRA and SOY showed color alter-ation after 7 days (T2). The greatest color alteralter-ation occurred in the group MUS (T4 = 34.12), at all ex-perimental times, and this alteration could be noted after only 24 hours.
Microhardness change
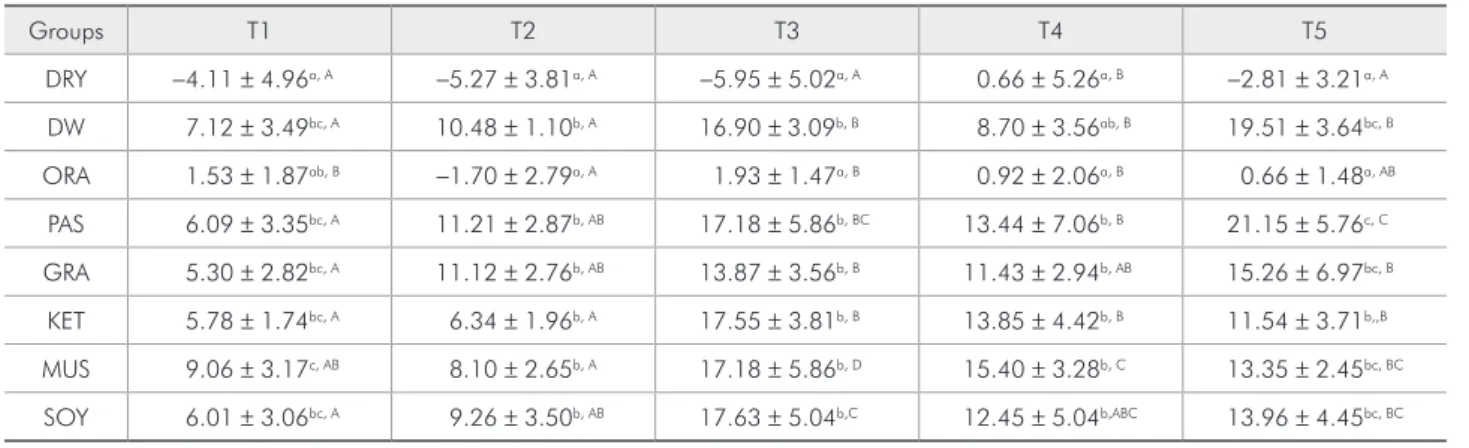
Means, standard deviations (±) and statistical difference of microhardness change (∆V) for the test-ed substances at each experimental time are present-ed in Table 3. After one day MUS group showpresent-ed the greatest change in the microhardness (T1 = 9.06). At the end of the experiment, PAS group showed the greatest microhardness alteration, followed by DW, GRA, SOY and MUS. KET and ORA groups were next in a decreasing sequence. The group DRY showed a signiicant microhardness change after 21 days; however, at the end of the experiment, its mi-crohardness was not signiicantly different from the initial value.
Correlation between color and microhardness alterations
The results of the Pearson’s correlation test are presented in Table 4. Groups DW, KET, GRA and SOY showed a signiicant positive correlation
be-tween ∆E and ∆V values.
Discussion
It is widely accepted that the susceptibility to extrinsic staining as well as the degradation of a composite can be determinate by its degree of water sorption. According to Bagheri et al.,5 if the
com-posite is able to absorb water, then it is also capable of absorbing other luids, resulting in its discolor-ation17 and in the reduction of its mechanical
prop-erties due to polymer matrix degradation.18 Fluid
absorption occurs mainly as direct absorption in the resin matrix. The glass iller particles will not absorb water into the bulk of the material, but can adsorb water onto the surface. Extra water sorption may decrease the life of resin composites by expand-ing and plasticizexpand-ing the resin component,
hydrolyz-Table 3 - Means and standard deviations of ∆V values for each experimental time.
Groups T1 T2 T3 T4 T5
DRY −4.11 ± 4.96a, A −5.27 ± 3.81a, A −5.95 ± 5.02a, A 0.66 ± 5.26a, B −2.81 ± 3.21a, A
DW 7.12 ± 3.49bc, A 10.48 ± 1.10b, A 16.90 ± 3.09b, B 8.70 ± 3.56ab, B 19.51 ± 3.64bc, B
ORA 1.53 ± 1.87ab, B −1.70 ± 2.79a, A 1.93 ± 1.47a, B 0.92 ± 2.06a, B 0.66 ± 1.48a, AB
PAS 6.09 ± 3.35bc, A 11.21 ± 2.87b, AB 17.18 ± 5.86b, BC 13.44 ± 7.06b, B 21.15 ± 5.76c, C
GRA 5.30 ± 2.82bc, A 11.12 ± 2.76b, AB 13.87 ± 3.56b, B 11.43 ± 2.94b, AB 15.26 ± 6.97bc, B
KET 5.78 ± 1.74bc, A 6.34 ± 1.96b, A 17.55 ± 3.81b, B 13.85 ± 4.42b, B 11.54 ± 3.71b,,B
MUS 9.06 ± 3.17c, AB 8.10 ± 2.65b, A 17.18 ± 5.86b, D 15.40 ± 3.28b, C 13.35 ± 2.45bc, BC
SOY 6.01 ± 3.06bc, A 9.26 ± 3.50b, AB 17.63 ± 5.04b,C 12.45 ± 5.04b,ABC 13.96 ± 4.45bc, BC
Different letters show statistical difference (p < 0.05) between the products tested. Capital letters show statistical difference between the experimental times for each product.
Table 4 - Correlation between ∆E and ∆V values.
Groups R (Pearson) P Significant
DRY 0.145 0.488 ns
ORA −0.076 0.717 ns
MUS 0.295 0.153 ns
KET 0.602 0.001** sig
DW 0.496 0.012* sig
PAS 0.384 0.058 ns
SOY 0.634 0.001** sig
GRA 0.536 0.006** sig
ing the silane and causing microcrack formation. Therefore, the microcracks or the interfacial gaps at the interface between iller and matrix allow stain penetration and discoloration.5 This theory could be
conirmed in this study, as can be observed in the alterations found in DW group for both variables:
∆E and ∆V.
The ability of the composite to absorb luids is strongly related to the nature of the material. It was observed that hydrophobic materials, with the absence of a hydroxyl group in their composition, showed low water sorption, but were stained by hy-drophobic solutions, whereas hydrophilic materials with a high degree of water sorption were stained by hydrophilic substances in aqueous solutions.5
According to the manufacturer, the material Filtek Z-250 used in this study is a universal micro-hybrid composite resin with an organic matrix of Bis-GMA, UDMA and Bis-Hema. Its iller consists of 60% by volume of zircon/silica particles rang-ing from 0.01-3.5 µm. The presence of UDMA and, more importantly, Bis-Hema, makes this composite more color stable and more hydrophobic.19,20 This
more hydrophobic characteristic could explain the fact that, in this study, mustard was the substance that promoted the greatest staining. This condiment is composed of vinegar, mustard, corn, sugar, salt, food lavoring, conservative and curcuma, which is a rhizome extensively used in industry to obtain food coloring and pharmaceutical products.21
Cur-cuma has a brilliant yellow color and is insoluble in water, i.e. hydrophobic. This great capacity of cur-cuma to stain composites was also previously ob-served by Stober et al.22
The other substances that also had an impact on the composite color were ketchup, grape juice and soy sauce. Ketchup, another condiment, is very pop-ular among populations all over the world, and its red color is attributed to a substance called lycopene which, like curcuma, is also insoluble in water.2
The color of grapes comes from the anthocyna-nins, which are water-soluble vacuolar pigments23
that may appear red, purple, or blue, according to the pH. Differently from the pigments found in mus-tard and in ketchup, anthocyanins are hydrophilic, and so is the caramel coloring, the pigment present
in the soy sauce. In these circumstances, one might suppose that the staining caused by these two pig-ments was due to their adsorption on the composite surface. However, we do not believe that this was the case, since in order to prevent the mechanical re-tention of these pigments on the composite surface, all specimens were washed and brushed before each evaluation. It can be speculated that some absorp-tion by the hydrophilic component of the organic matrix, mainly the Bis-GMA,4,24 might have
oc-curred.
Immersion of the specimens in deionized water did not alter the color of the composite to a con-siderable extent, which is in agreement with other investigations.13,22,25 Although a perceptible color
al-teration could be noticed after 7 days in this group, by the end of the experiment, the specimens were able to return to their original color. As deionized water has no pigments, this reported small color al-teration might be attributed to some water sorption of the organic matrix. On the other hand, the speci-mens kept in the dry condition did not present any color alteration over the course of time.
As regards microhardness alterations, it was ob-served that acid substances can cause a reduction in the surface microhardness of composites by soften-ing the bis phenol-A-glycidyl methacrylate-based polymers present in the organic matrix.10,14,26 In
agreement with this theory, Villalta et al.25 stated
that low pH may indeed affect the surface integrity of composite resins, and for this reason, it could also promote an increase in the susceptibility to staining.
As can be observed in Table 1, all the solutions tested in this study have low pH and, therefore, a high potential to affect the supericial integrity of the composite. Fontes et al.10 believe that the low pH
microhardness alterations could not be exclusively associated with the pH. Thus, to elucidate these results, further investigations must be conducted, involving the study of other chemical and physical characteristics of these substances that might have exerted some inluence on the change in microhard-ness of the composite.
It was only possible to determine a positive sig-niicant correlation between the two variables tested in this study in the groups treated with deionized water, grape juice, ketchup and soy sauce, which means that discoloration of the composite cannot always be associated with its surface degradation. Yanikog˘lu et al.27 also concluded that the values of
composite materials were statistically different in different immersion solutions.
According Mundim et al.28 patients routinely ask
dentists how long an esthetic restoration should last, and whether their eating habits may inluence the quality and longevity of the restoration. Knowledge
of the effects of staining potential on the surface of a composite resin could guide clinicians as regards the instructions1 they give their patients after the
operatory procedure, to assure better color stability and long-term maintenance of the restoration.
Conclusions
Considering the limitations of this study, it was possible to conclude that:
1. Mustard was the substance that promoted the greatest color alteration.
2. Passion fruit juice caused the greatest microhard-ness change.
3. Not all color alteration could be associated with surface degradation.
Acknowledgements
The authors would like to thank the FAPESP and CAPES for their inancial support.
References
1. Ardu S, Braut V, Gutemberg D, Krejci I, Dietschi D, Feilzer AJ. A long-term laboratory test on staining susceptibility of esthetic composite resin materials. Quintessence Int. 2010 Sep;41(8):695-702.
2. Buchalla W, Attin T, Hilgers RD, Hellwig E. The effect of water storage and light exposure on the color and translucency of a hybrid and a microfilled composite. J Prosthet Dent. 2002 Mar;87(3):264-70.
3. Braga SRM, Vasconcelos BT, Macedo MRP, Martins VRG, Sobral MAP. Reasons for placement and replacement of di-rect restorative materials in Brazil. Quintessence Int. 2007 Apr;38(4):e.189-94.
4. Topcu FT, Sahinkesen G, Yamanel K, Erdemir U, Oktay EA, Ersahan S. Influence of different drinks on the colour stability of dental resin composites. Eur J Dent. 2009 Jan;3(1):50-6. 5. Bagheri R, Burrow MF, Tyas M. Influence of food-simulating
solutions and surface finish on susceptibility to staining of aes-thetic restorative materials. J Dent Res. 2005 May;33(5):389-98.
6. Douglas WM, Craig RG. Resistance to extrinsic stains by hydrophobic composite resin systems. J Dent Res. 1982 Jan;61(1):41-3.
7. Reis AF, Giannini M, Lovadino JR, Ambrosano GM. Ef-fects of various finishing systems on the surface roughness and staining susceptibility of packable composite resins. Dent Mater.2003 Jan;19(1):12-8.
8. Gross MD, Moser JB. A colorimetric study of coffee and tea staining of four composite resins. J Oral Rehabil.1977 Oct;4(4):311-22.
9. Yazici AR, Celik C, Dayangaç B, Ozgünaltay G. The effect of curing units and staining solutions on the color stability of resin composites. Oper Dent.2007 Nov-Dec;32(6):616-22. 10. Fontes ST, Fernández MR, Moura CM, Meireles SS. Color
stability of a nanofill composite: effect of different immersion media. J Appl Oral Sci. 2009 Sep-Oct;17(5):388-91. 11. Güler AU, Güler E, Yücel AC, Ertas¸ E. Effects of polishing
procedures on color stability of composite resins. J Appl Oral Sci.2009 Mar-Apr;17(2):108-12.
12. Curtin JA, Lu H, Milledge TJ, Hong L, Peterson J. In vitro
staining of resin composites by liquids ingested by children. Pediatric Dent. 2008 Jul-Aug;30(4):317-22.
13. Catelan A, Briso AL, Sundfeld RH, Goiato MC, Dos Santos PH.Color stability of sealed composite resin restorative materi-als after ultraviolet artificial aging and immersion in staining solutions.J Prosthet Dent. 2011 Apr;105(4):236-41.
14. Honório HM, Rios D, Francisconi LF, Magalhães AC, Mach-ado MA, Buzalaf MA. Effect of prolonged erosive pH cy-cling on different restorative materials. J Oral Rehabil.2008 Dec;35(12):947-53.
16. Ruyter IE, Nilner K, Moiler B. Color stability of dental com-posite resin materials for crown and bridge veneers. Dent Mater. 1987 Oct;3(5):246-51.
17. Galvão AP, Jacques LB, Dantas L, Mathias P, Mallmann A.Effect of lipstick on composite resin color at different ap-plication times. J Appl Oral Sci. 2010 Dec;18(6):566-71. 18. Ferracane JL. Hygroscopic and hydrolytic effects in dental
polymer networks. Dent Mater.2006 Mar;22(3):211-22. 19. Kerby RE, Knobloch LA, Schricker S, Gregg B. Synthesis
and evaluation of modified urethane dimethacrylate resins with reduced water sorption and solubility. Dent Mater. 2009 Mar;25(3):302-13.
20. Siderdou I, Tserki V, Papanastasiou G. Study of water sorption, solubility and modulus of elasticity of light cured dimethac-rylate resins. Biomaterials. 2003 Feb;24(4):655-65. 21. Goel A, Kunnumakkara AB, Aggarwal BB. Curcumin as
“Cu-recumin”: from kitchen to clinic. Biochem Pharmacol. 2008 Feb;75(4):787-809.
22. Stober T, Gilde H, Lenz P. Color stability of highly filled composite resin materials for facings. Dent Mater. 2001 Jan;17(1):87-94.
23. Passamonti S, Vrhovsek U, Vanzo A, Mattivi F. Fast access of some grape pigments to the brain. J Agric Food Chem. 2005 Sep 7;53(18):7029-34.
24. Shobha HK, Sankarapandian M, Kalachandra S, Taylor DF, McGrath JE. Structure property relationship among novel dental composite matrix resins. J Mater Sci Mater Med. 1997 Jun;8(6):385-9.
25. Villalta P, Lu H, Okte Z, Garcia-Godoy F, Powers JM. Effects of staining and bleaching on color change of dental composite resins. J Prosthet Dent. 2006 Feb; 95(2):137-42.
26. Canay S, Cehreli MC. The effect of current bleaching agents on the color of light-polymerized composite in vitro. J Prosthet Dent. 2003 May;89(5):474-8.
27. Yanikog˘lu N, Duymus¸ ZYes¸il, Yilmaz B. Effects of different solutions on the surface hardness of composite resin Materials. Dent Mater J. 2009 May;28(3):344-51.