ACPD
8, 1709–1755, 2008Analysis of CO outflow from Asia using satellite data
S. Turquety et al.
Title Page
Abstract Introduction
Conclusions References
Tables Figures
◭ ◮
◭ ◮
Back Close
Full Screen / Esc
Printer-friendly Version
Interactive Discussion
EGU Atmos. Chem. Phys. Discuss., 8, 1709–1755, 2008
www.atmos-chem-phys-discuss.net/8/1709/2008/ © Author(s) 2008. This work is licensed
under a Creative Commons License.
Atmospheric Chemistry and Physics Discussions
CO emission and export from Asia: an
analysis combining complementary
satellite measurements (MOPITT,
SCIAMACHY and ACE-FTS) with global
modeling
S. Turquety1, C. Clerbaux1,2, K. Law1, P.-F. Coheur2, A. Cozic3, S. Szopa3, D. A. Hauglustaine3, J. Hadji-Lazaro1, A. M. S. Gloudemans3, H. Schrijver4, C. D. Boone5, P. F. Bernath5,6, and D. P. Edwards7
1
Service d’A ´eronomie/IPSL, Universit ´e Pierre et Marie Curie-Paris 6, CNRS, France
2
Spectroscopie de l’atmosph `ere, Chimie Quantique et Photophysique, Universit ´e Libre de Bruxelles, Brussels, Belgium
3
Laboratoire des Sciences du Climat et de l’Environnement/IPSL, CEA, CNRS, UVSQ, Gif-sur-Yvette, France
4
SRON Netherlands Institute for Space Research, Utrecht, Netherlands
5
Department of Chemistry, University of Waterloo, Waterloo, Ontario, Canada
6
Department of Chemistry, University of York, Heslington, York, UK
7
Atmospheric Chemistry Div., National Center for Atmospheric Research, Boulder, CO, USA
Received: 13 November 2007 – Accepted: 20 December 2007 – Published: 31 January 2008
ACPD
8, 1709–1755, 2008Analysis of CO outflow from Asia using satellite data
S. Turquety et al.
Title Page
Abstract Introduction
Conclusions References
Tables Figures
◭ ◮
◭ ◮
Back Close
Full Screen / Esc
Printer-friendly Version
Interactive Discussion
EGU
Abstract
This study evaluates our current knowledge of pollution outflow from Asia using sim-ulations from the LMDz-INCA global model combined with the available satellite ob-servations of CO during the spring of 2005. CO is measured by several space-borne instruments using different techniques, allowing complementary perspectives. The CO 5
observations from the MOPITT and SCIAMACHY nadir sounders, which provide verti-cally integrated information with excellent horizontal sampling, and from the ACE-FTS solar occultation instrument, which has limited spatial coverage but allows the retrieval of vertical profiles, are used. Combining observations from MOPITT (mainly sensi-tive to the free troposphere) and SCIAMACHY (sensisensi-tive to the full column) allow the 10
evaluation of the boundary layer CO. Underestimated emissions in eastern Asia, and possibly too low lofting in the model, lead to an underestimate of the export to the free troposphere, as highlighted by comparisons with MOPITT and ACE-FTS. Both instru-ments observe large trans-Pacific transport extending from∼20◦N to∼60◦N, with high upper tropospheric CO observed by ACE-FTS above the eastern Pacific (with values of 15
up to 300 ppbv around 50◦N at 500 hPa and up to∼200 ppbv around 30◦N at 300 hPa). The low vertical and horizontal resolutions of the global model do not allow the sim-ulation of the strong enhancements in the observed plumes. However, the transport patterns are well captured, and are mainly attributed to export from eastern Asia, with increasing contributions from South Asia and Indonesia towards the tropics. Additional 20
measurements of C2H2, C2H6and HCN by ACE-FTS provide further information on the
plume history. C2H2and C2H6enhancements are well correlated with the CO plumes,
ACPD
8, 1709–1755, 2008Analysis of CO outflow from Asia using satellite data
S. Turquety et al.
Title Page
Abstract Introduction
Conclusions References
Tables Figures
◭ ◮
◭ ◮
Back Close
Full Screen / Esc
Printer-friendly Version
Interactive Discussion
EGU
1 Introduction
Asia is one of the most important pollution source regions. While anthropogenic emis-sions from North America and Europe appear to be stabilizing or decreasing, emisemis-sions from Asia have increased rapidly in the past decade, becoming the largest contribu-tion (Richter et al., 2005; Akimoto, 2003). Asian energy consumpcontribu-tion has more than 5
doubled since the 1980s due to population growth, rapid industrialization and increas-ing transportation, causincreas-ing significant enhancement in the emissions over this region (Streets et al., 2000, 2006; Ohara et al., 2007). In addition to the degradation of re-gional air quality, it is now recognized that the long range transport of pollution from Asia, both from fossil fuel and biomass burning, has a strong influence on the chem-10
ical composition of the troposphere over the Pacific Ocean and downwind continents (e.g. Wild and Akimoto, 2001; Jaffe et al., 1999, 2004; Heald et al., 2003; Bertschi et al., 2004; de Gouw et al., 2004; Hudman et al., 2004). This issue has been the focus of a number of recent aircraft campaigns (TRACE-P in 2001 (Jacob et al., 2003), ITCT-2k2 in 2002 (Parrish et al., 2004), INTEX-B in 2006). Satellite measurements have also 15
been a valuable tool for evaluating Asian emissions (Martin et al., 2003; Arellano et al., 2004; P ´etron et al., 2004; Heald et al., 2004) and monitoring trans-Pacific transport (Heald et al., 2003, 2006; Allen et al., 2004; Edwards et al., 2004; Hudman et al., 2004). Current global model simulations of carbon monoxide (CO) show a significant underes-timates throughout the Northern Hemisphere compared to satellite observations from 20
the MOPITT/Terra instrument suggesting a missing source year round (Shindell et al., 2006), which could be explained by too low emissions in eastern Asia in the current inventories.
In this study, we explore the information on the Asian pollution outflow provided by the available satellite observations of CO using comparisons with simulations from the 25
ACPD
8, 1709–1755, 2008Analysis of CO outflow from Asia using satellite data
S. Turquety et al.
Title Page
Abstract Introduction
Conclusions References
Tables Figures
◭ ◮
◭ ◮
Back Close
Full Screen / Esc
Printer-friendly Version
Interactive Discussion
EGU and is principally removed by reaction with OH. It is a toxic gas at high concentration,
currently regulated by air quality standards worldwide as a major ozone precursor. It also contributes to climate change through its effect on ozone and methane chemistry. Furthermore, its relatively long lifetime, of the order of several weeks in the free tropo-sphere, makes it an ideal tracer of the transport of pollution. It is routinely measured 5
by several satellite borne instruments. Nadir looking remote sensors allow the retrieval of global CO distributions with a good spatio-temporal resolution, either from measure-ments in the thermal infrared spectral region, with MOPITT on board the Terra satellite since 2000 (Edwards et al., 2004; Deeter et al., 2003), AIRS on board Aqua since 2002 (McMillan et al., 2005), TES on board Aura since 2004 (Rinsland et al., 2006a, 10
Luo et al., 2007), and IASI on board MetOp since 2006 (Turquety et al., 2004, Clerbaux et al., 2007a), or from measurements in the near-infrared with SCIAMACHY on board ENVISAT since 2002 (Buchwitz et al., 2004, Frankenberg et al., 2005; Gloudemans et al., 2005). However, the nadir geometry provides vertically integrated information, implying limited vertical resolution. CO retrievals in the thermal infrared spectral range 15
are characterized by a maximum sensitivity in the free troposphere with low sensitivity in the boundary layer and less than 2 independent pieces of information on the vertical profile, while the near-infrared allow sensitivity down to the Earth’s surface but provides only total column measurements.
Instruments using solar occultation, such as the ACE-FTS on board SCISAT since 20
2003 (Bernath et al., 2005; Clerbaux et al., 2005, 2007b), or emission in a limb viewing geometry, such as MIPAS/ENVISAT (Funke et al., 2007) or MLS/Aura (Pumphrey et al., 2007), allow the retrieval of CO profiles with an improved vertical resolution, but with a poorer horizontal coverage than nadir instruments. Of particular interest for this work investigating tropospheric pollution is ACE-FTS, which allows probing down to 25
ACPD
8, 1709–1755, 2008Analysis of CO outflow from Asia using satellite data
S. Turquety et al.
Title Page
Abstract Introduction
Conclusions References
Tables Figures
◭ ◮
◭ ◮
Back Close
Full Screen / Esc
Printer-friendly Version
Interactive Discussion
EGU from MLS/Aura and ACE-FTS have been used to analyze the trapping of pollution in
the Asian monsoon anticyclone (Li et al., 2005; Park et al., 2007). The MLS/Aura CO measurements have recently been used for the study of transport from Asia (Jiang et al., 2007), showing the close relationship between upper tropospheric CO and surface emissions, deep-convection and horizontal winds.
5
Here, we examine the complementary information provided by the solar occultation measurements from the ACE-FTS and the nadir observations from MOPITT and SCIA-MACHY for the analysis of the export of pollution from Asia.
This analysis is focused on spring 2005. Two reasons motivated the choice of this time period. First, spring corresponds to the maximum in Asian outflow due to active 10
cyclonic activity and strong westerly winds. During this season, the Asian pollution can be transported across the Pacific in 5 to 10 days (e.g. Jaffe et al., 1999; Liang et al., 2004) with the strongest transport in the middle troposphere (e.g. Bey et al., 2001; Stohl et al., 2002). Secondly, the mid-latitudes of the Northern Hemisphere were well covered by ACE-FTS during this time period.
15
After a brief description of the global model and a first validation against MOZAIC aircraft measurements, the satellite observations from ACE-FTS, MOPITT and SCIA-MACHY are presented, as well as an intercomparison of the available CO measure-ments over Asia and the Pacific. Asian outflow and transport is then investigated using the different types of CO satellite measurements. The origin of the exported air masses 20
is further explored using ACE-FTS observations of acetylene (C2H2), ethane (C2H6)
and hydrogen cyanide (HCN).
2 Global CO simulation with the LMDz-INCA model
This analysis of the trans-Pacific transport of CO is based on comparisons between the available satellite observations and simulations from the LMDz-INCA global chemistry 25
ACPD
8, 1709–1755, 2008Analysis of CO outflow from Asia using satellite data
S. Turquety et al.
Title Page
Abstract Introduction
Conclusions References
Tables Figures
◭ ◮
◭ ◮
Back Close
Full Screen / Esc
Printer-friendly Version
Interactive Discussion
EGU Aerosols) chemistry module (Hauglustaine et al., 2004; Folberth et al., 2006). Here,
the LMDz version 4 and INCA version 2 are used, in the nudged version of the model, driven by meteorological fields (winds and temperature) from the ECMWF reanalyses (ERA15). The simulations were performed with the standard horizontal resolution of 3.75◦ in longitude×2.5◦ in latitude on 19 vertical levels extending from the surface to 5
3 hPa. Different convection schemes have been tested, and the best general agree-ment with observations was obtained using the Tiedke scheme.
INCA describes the tropospheric oxidation of NMHC and CH4through 332 chemical reactions using 86 chemical species. In addition to the species commonly included in this chemical scheme, regional CO tracers have been included to track the origin of 10
CO. In particular, the emissions from five regions in Asia are transported independently in the model (Fig. 1). Comparisons between LMDz-INCA and surface CO observations from the NOAA Earth System Research Laboratory (ESRL) Global Monitoring Division (GMD) network (Novelli et al., 1992) for a time period extending from 1997 and 2001 has shown the ability of the model to simulated the interannual variability of CO (Szopa 15
et al., 2007). While meteorology explains most of the variability in the tropics, it is equally explained by biomass burning and meteorological conditions at high latitude stations.
In this study, the anthropogenic emissions from the EDGAR 3.2 inventory (Olivier and Berdowski, 2001) are used. Recent analyses have shown that Asian emissions 20
are too low in current inventories (Arellano et al., 2004; Heald et al., 2004; P ´etron et al., 2004; Streets et al., 2006; Ohara et al., 2007). In order to minimize the effect of this underestimate, the total Asian emissions of CO have been scaled using the inverse modeling results of P ´etron et al. (2004), which was based on the MOPITT observations for the year 2001. The resulting emissions are shown in Fig. 1. Total CO 25
ACPD
8, 1709–1755, 2008Analysis of CO outflow from Asia using satellite data
S. Turquety et al.
Title Page
Abstract Introduction
Conclusions References
Tables Figures
◭ ◮
◭ ◮
Back Close
Full Screen / Esc
Printer-friendly Version
Interactive Discussion
EGU used. During the spring of 2005, fires were mainly burning in south-east Asia and, with
a smaller contribution, in southern Siberia and Canada (Fig. 4).
Model simulations were first evaluated against surface CO data from the GMD net-work (not shown). The agreement between the model and the surface data is very good for downwind measurement sites, although the surface CO is underestimated in 5
the model after mid-April at the high latitude stations. This could be due to an under-estimate of the emissions from the Russian fires which increased at this time period, or to too high photochemical destruction at high latitudes in the model. However, the transport events are well captured across the Pacific Ocean, giving confidence in the model’s ability to simulate long-range transport from Asia during this time period. 10
Evaluation of the vertical distributions of CO was undertaken using the vertical pro-files from the MOZAIC aircraft data, measured during take offand landing of commer-cial aircraft (Nedelec et al., 2003). Figure 2 shows comparisons above Asia (Bangkok, Hong-Kong, Shanghai and Tokyo) and western North America (Vancouver and San Francisco) averaged over the available measurements during the spring of 2005. The 15
model tends to overestimate CO in the upper troposphere and lower stratosphere (UTLS), which could be due to too low vertical resolution in the model or to too large exchange between the troposphere and the stratosphere. The agreement between ∼500 hPa and 300 hPa is generally good, with a small tendency to underestimate CO (up to ∼9% in San Francisco). On the contrary, the model clearly underestimates 20
CO in the middle troposphere (by 10 to 20% between 850 and 500 hPa), although it remains within the measured variability, and at the surface (by less than 20% ex-cept above Bangkok, where CO is underestimated by 49% below 850 hPa). Part of this underestimate is explained by the relatively low horizontal resolution of the model: MOZAIC measures CO above airports, hence in highly polluted areas which are not 25
ACPD
8, 1709–1755, 2008Analysis of CO outflow from Asia using satellite data
S. Turquety et al.
Title Page
Abstract Introduction
Conclusions References
Tables Figures
◭ ◮
◭ ◮
Back Close
Full Screen / Esc
Printer-friendly Version
Interactive Discussion
EGU also shown in Fig. 2, highlight the preponderant contribution from Asia, not only locally
but also above western America in the middle and upper troposphere.
3 Satellite CO observations
3.1 Solar occultation observations from ACE-FTS
ACE-FTS (Atmospheric Chemistry Experiment Fourier Transform Spectrometer) was 5
launched in August 2003 on board the Canadian ACE satellite (also known as SCISAT-1), and measures the infrared (IR) radiation in solar occultation mode (Bernath et al., 2005). Up to thirty occultation sequences are recorded daily, during fifteen sunrises and fifteen sunsets. The solar occultation technique allows the retrieval of a wide range of trace species due to the high signal to noise ratio of the measurements, and 10
the retrieval of vertical profiles with a good vertical resolution from the mid-troposphere to the thermosphere (Coheur et al., 2007). A global fit approach is used, described in Boone et al. (2005), in which all parameters are retrieved simultaneously using a gen-eral non-linear least-squares method. The early ACE-FTS CO retrievals are described and characterized in Clerbaux et al. (2005). In this analysis, we use the data from the 15
version 2.2 of the retrieval algorithm. A full validation of the CO retrievals is provided in Clerbaux et al. (2007b). The ACE-FTS vertical sampling is ∼2 km in the mid and upper troposphere, and the accuracy of the CO mixing ratios was assessed to range between 2% (retrieval error) and 15% (discrepancy with other observations).
The measurements of CO collected during the spring of 2005 over Asia and the Pa-20
cific Ocean correspond to two main observation time periods: 20 March to 10 April and 20 April to 25 May. The ACE CO observed in the upper troposphere above Asia and the Pacific Ocean, averaged over the model 3.75◦×2.5◦ grid, is shown in Fig. 3. Enhanced CO values are measured above central and eastern Asia, and extend over the Pacific Ocean to the Western United States, at latitudes ranging from 15◦N to 25
enhance-ACPD
8, 1709–1755, 2008Analysis of CO outflow from Asia using satellite data
S. Turquety et al.
Title Page
Abstract Introduction
Conclusions References
Tables Figures
◭ ◮
◭ ◮
Back Close
Full Screen / Esc
Printer-friendly Version
Interactive Discussion
EGU ments). These signatures, attributed to pollution outflow from Asia, are further analyzed
in Sect. 5.
Additional measurement of HCN, also routinely provided by the ACE-FTS standard retrieval algorithm, and of C2H2 and C2H6 from the research version of the retrieval
algorithm (Park et al., 2007), are also used to investigate the origin of the air masses 5
by the ACE-FTS.
3.2 Nadir observations from MOPITT/Terra
MOPITT (Measurement Of Pollution In The Troposphere) was launched in December 1999 on board the polar orbiting Terra satellite. At nadir, the ground pixel size of the MOPITT measurement is 22 km×22 km, and the scan angle of 26.1◦ across the satel-10
lite flight track allows a global coverage in∼3 days. It measures the infrared radiation in a nadir viewing geometry using gas correlation radiometry. Here, we use the CO data from the Phase II version 3 of the retrieval algorithm, described in Deeter et al. (2003). The profiles are retrieved on 7 vertical levels, from the surface to 150 hPa using a non-linear optimal estimation method. However, the vertical resolution achieved is limited 15
by the observation technique. Although studies have shown that the MOPITT profiles contain information on the CO vertical structure (Kar et al., 2004), this information is highly correlated. The number of independent pieces of information characterizing the profiles (commonly referred to as degrees of freedom for signal, DOFS) varies from∼2 in the tropics to less than 1 at high latitudes, weighted towards the middle troposphere 20
(Heald et al., 2003; Deeter et al., 2004). The vertical resolution is estimated to be ∼6 km. Retrievals have been validated against aircraft measurements and shown to be biased high by∼6% for the Phase II retrievals used here (Emmons et al., 2007). As the nighttime measurements have not been validated and appear to be biased relative to the daytime measurements (Heald et al., 2004), only daytime data are considered 25
here.
ACPD
8, 1709–1755, 2008Analysis of CO outflow from Asia using satellite data
S. Turquety et al.
Title Page
Abstract Introduction
Conclusions References
Tables Figures
◭ ◮
◭ ◮
Back Close
Full Screen / Esc
Printer-friendly Version
Interactive Discussion
EGU again, strong CO enhancements are observed above eastern and south-eastern Asia
and above the Pacific Ocean. The outflow from Asia is clearly identified above the Pacific Ocean, with a maximum between ∼20◦N to 60◦N. Note that looking at the individual retrieval vertical levels from MOPITT does not change the pattern of the export due to the lack of vertical resolution. The retrieval error is mostly driven by 5
the vertical sensitivity of MOPITT: DOFS strongly depends on surface temperature, with larger DOFS (and hence better vertical resolution) at higher surface temperatures (Deeter et al., 2004), so that the error rapidly increases towards high latitudes (lower signal measured, so larger contribution from the a priori information used during the retrieval).
10
3.3 Nadir observations from SCIAMACHY/Envisat
SCIAMACHY (SCanning Imaging Absorption spectroMeter for Atmospheric CHartog-raphY) was launched in March 2002 on board the ENVISAT satellite, and allows the observation of a number of trace gases with a horizontal resolution of 30 km ×60– 120 km.
15
We use the CO total columns retrieved with the Iterative Maximum Likelihood Method (IMLM) using measurement in the near infrared between 2324.5–2337.9 nm (Gloude-mans et al., 2005). This spectral region allows detection down to the Earth’s surface, with equal sensitivity to all vertical layers, unlike the thermal infrared region which has a lower sensitivity in the boundary layer. In this paper version 7.4 of the IMLM algorithm 20
is used in which the instrument noise is estimated per individual detector pixel using the dark signal measurements instead of assuming an average value over the whole spectral range as is done in IMLM v6.3 used in de Laat et al. (2006, 2007) and Gloude-mans et al. (2006). In addition, this version includes some minor improvements on the calculation of the cross sections. The CO total columns retrieved with IMLM v7.4 are 25
ACPD
8, 1709–1755, 2008Analysis of CO outflow from Asia using satellite data
S. Turquety et al.
Title Page
Abstract Introduction
Conclusions References
Tables Figures
◭ ◮
◭ ◮
Back Close
Full Screen / Esc
Printer-friendly Version
Interactive Discussion
EGU zenith angle. Especially over sea the instrument-noise retrieval errors are large, due to
the low sea surface reflectance in the near infrared. Therefore measurements over sea and measurements with instrument-noise errors >1.5×10¹⁸molec/cm2 are excluded from the analysis. The data are filtered using the same selection criteria as in Gloude-mans et al. (2006) and are averaged over the whole season on the model 3.75◦×2.5◦ 5
grid as recommended in de Laat et al. (2006), using a weighted average based on the instrument-noise retrieval error. Whereas de Laat et al. (2006, 2007) only include data with cloud cover<20%, the Gloudemans et al. (2006) selection criteria are used here, including also data over low clouds. Although over low clouds the lowest part of the CO total column is missing, no significant bias is found when comparing the averaged 10
CO total columns to those based on the de Laat et al. (2006) selection criteria. This suggests that the observations in March–May 2005 contain mostly clouds well below 1.5 km.
The distribution obtained for March–April–May 2005 is shown in Fig. 4. Large en-hancements are observed above eastern Asia, reflecting the main source regions. 15
Large values are also observed at high latitudes, probably associated with CO from the northern mid-latitudes accumulating during the winter. The retrieval error is larger above Indonesia, and generally along the Coast, as well as at latitudes above 60◦N.
3.4 Intercomparison of CO satellite observations
In order to compare vertical profiles retrieved from different instruments, the specific 20
characteristics of each observing system needs to be accounted for. The methodology introduced by Rodgers and Connor (2003) as been used in order to smooth profiles with the higher vertical resolution using the characteristics of lower resolution profiles. These characteristics are represented by the averaging kernel matrixA=∂x/∂xˆ , cor-responding to the sensitivity of the retrieval ˆxat each vertical level to the true profilex. 25
ACPD
8, 1709–1755, 2008Analysis of CO outflow from Asia using satellite data
S. Turquety et al.
Title Page
Abstract Introduction
Conclusions References
Tables Figures
◭ ◮
◭ ◮
Back Close
Full Screen / Esc
Printer-friendly Version
Interactive Discussion
EGU freedom for the signal (DOFS). A smoothed profile is then obtained as follows:
xsmoothed =xa,low+Alow xhigh−xa,low
(1)
wherexhighis the high resolution profile,xa,lowis the a priori profile used for the retrieval
of the low resolution profile, andAlow is the averaging kernel matrix characterizing the
low resolution profiles. 5
The vertical resolution of the solar occultation measurements from ACE is much larger than that of the nadir measurements from MOPITT. We use Eq. (1) for the in-tercomparisons, applying the MOPITT retrieval characteristics to the higher resolution ACE-FTS profiles. ACE-FTS only provides retrievals in the middle and upper tropo-sphere, so that only these levels, and corresponding MOPITT averaging kernels, are 10
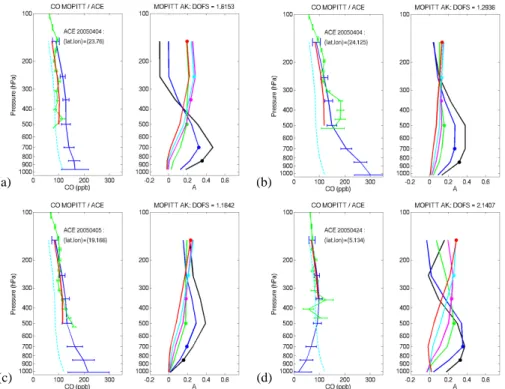
used in the comparison. Figure 5 shows several examples of comparisons, before and after applying the smoothing (Eq. 1) using the MOPITT averaging kernels (also plotted in Fig. 5) to the ACE-FTS profiles. Table 1 summarizes the comparisons at the different levels with collocated data for March-April-May 2005.
First of all, the comparison between the ACE-FTS retrieval and the ACE-FTS 15
smoothed profiles highlights the advantage of such high resolution measurements which can capture the vertical structure of pollution plumes in the upper troposphere. ACE-FTS smoothed and MOPITT are globally in very good agreement considering their respective uncertainty. The relative difference between the two measurements is ∼18% for all levels, with MOPITT giving higher CO values than ACE-FTS. The best 20
agreement is achieved for MOPITT DOFS≥2 (i.e., more than 2 independent elements of information contained in the retrieved profile), in the tropical regions (see Fig. 5d) because the information in the upper troposphere is less correlated to CO in the lower and middle troposphere. On the contrary, when the DOFS decreases, the MOPITT retrieval levels are all highly correlated, with a maximum sensitivity in the middle tropo-25
ACPD
8, 1709–1755, 2008Analysis of CO outflow from Asia using satellite data
S. Turquety et al.
Title Page
Abstract Introduction
Conclusions References
Tables Figures
◭ ◮
◭ ◮
Back Close
Full Screen / Esc
Printer-friendly Version
Interactive Discussion
EGU this contribution is not included, and this results in an artificially low smoothed ACE-FTS
profile, explaining the observed bias. This artifact can be corrected using CO profiles in the lower troposphere to complete the ACE-FTS profiles at lower altitudes. We veri-fied this using the MOZAIC in situ measurements. However, coincident measurements proved difficult to find and a statistical comparison could not be undertaken.
5
Since the instrument noise error of single SCIAMACHY CO total column measure-ments is typically 10–100%, a specific comparison of single CO observations could not be undertaken. The distributions averaged over the whole period without taking into account the exact spatial and temporal collocations of the SCIAMACHY and MOPITT observations are shown in Fig. 4. They show good general agreement in the observed 10
patterns, with CO enhancements over eastern Asia and Indonesia associated with an-thropogenic and biomass burning emissions. Over high altitude regions such as the Himalayas and the Rocky Mountains, MOPITT and SCIAMACHY agree well. SCIA-MACHY observes larger CO over large source regions (southern and eastern Asia in particular). This is largely explained by the ability of SCIAMACHY to sound the full 15
vertical column, whereas MOPITT is mostly sensitive to the free troposphere. SCIA-MACHY is also larger at high latitudes, which could be explained by surface emissions from biomass burning in Siberia and Canada that are not captured by MOPITT (too low sensitivity), or by transport from Europe at low altitudes over this region. However, this may not be significant since both MOPITT and SCIAMACHY show larger retrieval error 20
at high latitudes. On the contrary, MOPITT CO total columns are larger than those of SCIAMACHY over western Siberia and India. This suggests a bias between the datasets.
4 Analysis of the Asian outflow
Pollution is lofted from the Asian boundary layer by three main processes: rapid trans-25
ACPD
8, 1709–1755, 2008Analysis of CO outflow from Asia using satellite data
S. Turquety et al.
Title Page
Abstract Introduction
Conclusions References
Tables Figures
◭ ◮
◭ ◮
Back Close
Full Screen / Esc
Printer-friendly Version
Interactive Discussion
EGU We analyzed the ECMWF horizontal wind fields used to nudge the model simulation as
well as the vertical transport in the model. Strong vertical winds over India, southern and eastern China and over the western Pacific allow rapid transport of pollution from these regions into the free troposphere. It can then be exported across the Pacific Ocean by westerly winds between∼30◦N and 60◦N. During the time period from 20 5
March to 10 April, air masses are transported to the north-east Pacific, while during the time period from 20 April to 25 May, the transport is confined to lower latitudes,∼30– 40◦N. This is consistent with the CO observed from MOPITT and ACE during these time periods (Figs. 3 and 4).
In this section, we first use the CO data from MOPITT and SCIAMACHY for a general 10
evaluation of the model over Asia and the Pacific. Comparison between these data and the model CO are then used to evaluate the Asian emissions. CO observations from MOPITT and ACE-FTS are then compared to the modeled CO to further analyze the export from Asia, and its transport across the Pacific. We then study the origin of the pollution plumes observed by using ACE-FTS measurements of other tropospheric 15
species (C2H2, C2H6, HCN).
4.1 Complementary view from MOPITT and SCIAMACHY
In order to get a better insight into the complementary information from the two nadir instruments, we use the model as an intermediate. The averaged comparison over March-April-May 2005 is shown in Fig. 4. For comparisons with MOPITT, the model 20
profiles are smoothed according to Eq. (1) in order to get comparable distributions. Since SCIAMACHY is sensitive to the full vertical column, the spatially and temporally collocated modeled and measured total columns are compared directly.
Compared to MOPITT, the modeled CO total column is lower by 8% on average over Asia and the Pacific (∼1% at latitudes lower than 20◦N,∼12% at mid-latitudes and up 25
ACPD
8, 1709–1755, 2008Analysis of CO outflow from Asia using satellite data
S. Turquety et al.
Title Page
Abstract Introduction
Conclusions References
Tables Figures
◭ ◮
◭ ◮
Back Close
Full Screen / Esc
Printer-friendly Version
Interactive Discussion
EGU al., 2007), comparisons of the model results to the MOZAIC aircraft data also showed
an underestimate of CO in the free troposphere of∼10–20%. Such an underestimate is a common problem in many global models, as revealed in the intercomparison un-dertaken by Shindell et al. (2006), who attribute this to a year round underestimate of emissions from Asia.
5
On the contrary, the model total CO tends to be systematically higher than SCIA-MACHY (by 24% on average), especially above eastern India and western Siberia. This underestimate compared to MOPITT and overestimate compared to SCIAMACHY is partly explained by a systematic bias between MOPITT and SCIAMACHY (SCIA-MACHY apparently low compared to MOPITT), as discussed in Sect. 3.4. It could 10
also indicate too large CO at low altitudes in the model since MOPITT lacks sensitivity in the boundary layer, and could highlight an underestimate of pollution lofting. The model CO remains lower than SCIAMACHY over the largest emission regions (eastern China or the Gange Valley in particular), which could be another indication of too low emissions over Asia. Further evaluation of the Asian emissions and transport with the 15
satellite observations is presented in the following sections.
4.2 Evaluation of Asian emissions
As already mentioned, SCIAMACHY and MOPITT CO retrievals are characterized by different vertical sensitivities, inherent to the different spectral regions used: SCIA-MACHY is sensitive to the full column, while MOPITT in mainly sensitive to the free 20
troposphere, with low sensitivity in the boundary layer. Clerbaux et al. (2008) show that enhancements associated with urban pollution can be detected by MOPITT un-der specific conditions. However, this sensitivity, and hence the contribution from the boundary layer to the MOPITT column, remains low compared to SCIAMACHY. The difference between SCIAMACHY and MOPITT total columns therefore provides infor-25
ACPD
8, 1709–1755, 2008Analysis of CO outflow from Asia using satellite data
S. Turquety et al.
Title Page
Abstract Introduction
Conclusions References
Tables Figures
◭ ◮
◭ ◮
Back Close
Full Screen / Esc
Printer-friendly Version
Interactive Discussion
EGU We use these complementary views of the vertical column to qualitatively evaluate
the surface emissions over Asia in the model. Therefore, we define a boundary layer residual equal to:
BLR=CTSCIAMACHY−(CTMOPITT−CTa) (2)
where CTSCIAMACHY is the total column retrieval from SCIAMACHY, CTMOPITT is the
5
total column retrieved from MOPITT, and CTa is the contribution from the a priori
to the MOPITT total column retrieval. The MOPITT and SCIAMACHY data mea-sured during the same day and collocated within the model horizontal resolution are used. This residual is also calculated using the model results, with and without ap-plying the MOPITT averaging kernel to the model profiles. The contribution from the 10
a priori information on the CO profilexa,MOPITT in the MOPITT total column retrieval,
CTa=T (I−AMOPITT)xa,MOPITT
withT the column operator, is removed in order to only keep the part of the column actually observed by MOPITT in the free troposphere. For fully self consistent observations, the residual then corresponds to the additional infor-mation on the true statexprovided by SCIAMACHY with respect to MOPITT:
15
BLR=TASCIAMACHYx−TAMOPITTx≈T((I−AMOPITT)x) (3)
This is true for the modelBLRbut, since both instruments rely on different observation techniques and retrieval procedures, some inconsistency may result in a bias in the observedBLR. Indeed over remote regions the observedBLRshows a tendency to be lower than the modelBLR. This bias is removed by assuming that the observedBLR 20
over low CO regions far from the sources (chosen to be above west-central Asia) is equal to the modelBLR. The observedBLRis then corrected by addition of a constant amount∆=6.4×10¹⁷ molecules/cm2. Note that this assumes that the model is correct above west-central Asia.
The measured and simulated BLR are shown in Fig. 6 for values exceeding the 25
ACPD
8, 1709–1755, 2008Analysis of CO outflow from Asia using satellite data
S. Turquety et al.
Title Page
Abstract Introduction
Conclusions References
Tables Figures
◭ ◮
◭ ◮
Back Close
Full Screen / Esc
Printer-friendly Version
Interactive Discussion
EGU regions are clearly identified in both the measured and the modeled residual. The
observed BLR allows a better resolved distribution of the emissions, with largeBLR enhancements above the largest cities (particularly clear over China). The modelBLR is lower by∼0.33 molecules/cm2 over Eastern Asia, which corresponds to ∼37% on average over this region (see Fig. 1 for region limits). This comparison suggests that 5
emissions are underestimated over this region, particularly over large urban areas. The modelBLR is also too low above Indonesia, Siberia and south-western Canada, probably due to an underestimate in biomass burning emissions. On the contrary, the modelBLRis too large over western Siberia. This could be due to too much transport from Europe at low altitude, as already discussed in Sect. 4.1.
10
Our model simulation is based on the EDGAR inventory, adjusted for CO using in-version results from P ´etron et al. (2004) based on 2001 MOPITT observations. Recent revision of the Asian emission inventories (Streets et al., 2006; Ohara et al., 2007) and inverse modeling work (Kopacz et al., 2008) (allowing higher spatial resolution than previous inversions, including P ´etron et al., 2004) also recommend an increase 15
of emissions in Eastern Asia, in eastern and central China in particular. Further work would be required in order to allow a quantitative re-evaluation of the emissions: a better understanding of the apparent bias between SCIAMACHY and MOPITT, as well as an inverse analysis accounting for the instrument-noise error of each measurement would be required, which is beyond the scope of this study.
20
4.3 Trans-Pacific transport of CO
The good spatial and temporal resolutions of the MOPITT data are particularly inter-esting for the analysis of the spatial patterns and temporal variability of the transport. MOPITT clearly highlights the importance of trans-Pacific transport of pollution in the free troposphere between∼20◦N and∼60◦N (Fig. 4). The model underestimates CO 25
ACPD
8, 1709–1755, 2008Analysis of CO outflow from Asia using satellite data
S. Turquety et al.
Title Page
Abstract Introduction
Conclusions References
Tables Figures
◭ ◮
◭ ◮
Back Close
Full Screen / Esc
Printer-friendly Version
Interactive Discussion
EGU the free troposphere in the model, which could be explained both by too low surface
emissions and by too low lofting into the free troposphere, as already discussed in Sects. 4.1 and 4.2.
The ability of the model to simulate the transport events was examined by looking at variations in the total averaged CO columns during the spring over five boxes, plotted in 5
Fig. 7. The agreement over Eastern Asia is very good, but the model underestimates CO over the Pacific Ocean and this underestimate tends to increase as the season progresses. This suggests an underestimate, not only of the export from Asia, but maybe also of the net chemical production of CO, which could be due to too large pho-tochemical destruction or too low NMHC concentrations in the model. However, the 10
main features are captured by the model and are mainly attributed to the contribution from Asian sources, which control the temporal variations of CO over the entire region. Figure 8 shows the contributions from emissions in the main source regions to the total CO in the model. The main exporting regions for March–April 2005 are eastern Asia between ∼30◦N and 60◦N (dominated by fossil fuel combustion), and India and In-15
donesia at lower latitudes. The large CO enhancement over the North-Western part of the region (western Siberia) in the MOPITT data is attributed to transport from Europe. These regional tracers indicate that the underestimated CO in the model could be as-sociated with too low export from Eastern Asia, but also from Europe, or to transport at too low altitude.
20
Comparisons between the model and the ACE-FTS CO allow the analysis of the vertical structure of the transport in the middle and upper troposphere. The compar-isons during the two observation time periods (Fig. 9) show good consistency in the latitudinal variations, i.e. lower CO in the tropics due to enhanced photochemical pro-duction of OH and larger values at high latitudes due to slower photochemistry. The 25
ACPD
8, 1709–1755, 2008Analysis of CO outflow from Asia using satellite data
S. Turquety et al.
Title Page
Abstract Introduction
Conclusions References
Tables Figures
◭ ◮
◭ ◮
Back Close
Full Screen / Esc
Printer-friendly Version
Interactive Discussion
EGU too high chemical destruction. Part of the underestimate could also be explained by
the relatively low vertical and horizontal resolution of the global model which does not allow the reproduction of sharp pollution plumes, as well as too strong diffusion. The strong overestimate at high latitudes in the upper troposphere and lower stratosphere (UTLS), which also appeared in the comparisons with MOZAIC (Sect. 2), reflects too 5
large exchange between the troposphere and the stratosphere in the model.
The vertical distribution of CO is shown on cross sections for latitudinal bands over Asia and the Pacific Ocean (Figs. 10 and 11) and illustrates the vertical structure of transport. The model tends to be too low in the middle troposphere, and too high in the upper troposphere (above∼300 hPa). However, the CO enhancements observed 10
by ACE-FTS are captured by the model. Note that the individual ACE-FTS profiles were compared to latitudinal averages in order to get a broader picture of the long range transport, and also to allow for transport errors in the model (plume may not be located in the right grid box). Pollution is lofted into the free troposphere over eastern and southern Asia. It is then transported eastward in the free troposphere. For the 15
first period (20 March–10 April), large CO enhancements are observed by ACE-FTS in the upper troposphere above the Pacific Ocean at latitudes 30–60◦N, with CO typi-cally up to∼200 ppbv around 400 hPa and at slightly higher altitude (∼300 hPa) moving eastward. In the region 15–30◦N, ACE-FTS enhancements are found at lower altitude (∼500 hPa), consistent with the model showing subsidence over the Ocean. Later in 20
April and May (Fig. 11), large CO values are observed in the 15–30◦N latitude band, with two enhancements: one over eastern Asia, associated with rapid vertical trans-port to the upper troposphere and one further east over the Ocean. The two extrans-port branches are clearly seen in the model in this latitude band, and also around 30–45◦N.
4.4 Indications for plume origins in the ACE-FTS data 25
av-ACPD
8, 1709–1755, 2008Analysis of CO outflow from Asia using satellite data
S. Turquety et al.
Title Page
Abstract Introduction
Conclusions References
Tables Figures
◭ ◮
◭ ◮
Back Close
Full Screen / Esc
Printer-friendly Version
Interactive Discussion
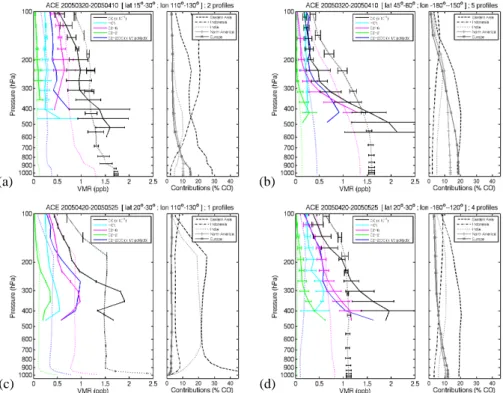
EGU eraged profiles measured above the Asian outflow are shown in Fig. 12, together with
the main contributions per regions to the total modeled CO.
C2H2, C2H6 and CO have common sources from combustion and are removed by
reaction with OH. However, the mean lifetime of C2H2(∼2 weeks) is much shorter than
that of CO and C2H6 (∼2 months). The relationship between C2H2 and CO can be 5
used to study the chemical ageing of air masses (e.g., Smyth et al., 1996; Xiao et al., 2007; Park et al., 2007). Air masses with C2H2/CO ratio greater than 3 ppt/ppb
are considered to correspond to young pollution plumes, containing recent emissions, while ratios lower than 1 ppt/ppb suggest aged (older than one week) and well mixed plumes (Russo et al., 1999). CO, C2H2 and C2H6 mixing ratios from ACE-FTS, and
10
the corresponding model profiles, are shown in Fig. 12 for four regions over Asia and the Pacific. Note that NMHC emissions were not increased in the simulation presented here, although several studies have pointed the need to more than double the emis-sions of NMHC from the EDGAR inventory in extratropical regions (Streets et al., 2003, Xiao et al., 2007).
15
The C2H2, C2H6 and CO profile shapes are well correlated in the observations and
in the model, reflecting common sources. Large C2H2/CO ratios are observed within the CO plumes, typically around 2 ppt/ppb above the ocean, but reaching more than 3 ppt/ppb for observations above the eastern Pacific in the mid-troposphere around 30◦N. This highlights the rapid export and transport across the Pacific Ocean. The 20
regional tracers of CO indicate that anthropogenic emissions from eastern Asia consti-tute the main contribution. Transport from Indonesia also has significant contribution in the upper troposphere at low latitudes, while transport from Europe and North America contribute significantly at higher latitudes in the low and middle troposphere. Transport from India is located in the middle troposphere and has a strong impact on the model 25
CO above Asia, especially at the end of the season, but also above the Pacific.
For C2H6and CO, the model is of the correct order of magnitude but underestimates
ACPD
8, 1709–1755, 2008Analysis of CO outflow from Asia using satellite data
S. Turquety et al.
Title Page
Abstract Introduction
Conclusions References
Tables Figures
◭ ◮
◭ ◮
Back Close
Full Screen / Esc
Printer-friendly Version
Interactive Discussion
EGU the transported plumes, resulting in C2H2/CO ratios too low by a factor of 2 compared to
ACE-FTS. This clearly suggests too large diffusion in the model, as discussed for CO in the previous section. This could also be partly due to underestimated NMHC emissions in the model, which would result in an underestimate of the chemical production of CO. The ACE-FTS HCN can be used as a tracer for the identification of biomass burning 5
signatures (Li et al., 2003). Large HCN mixing ratios were observed between 15◦N and 30◦N in the upper troposphere. Enhanced HCN extends to the north-eastern Pacific at lower altitudes in March-April 2005 (400 hPa) but with a small magnitude compared to the large CO enhancements in this region. The level of the HCN maxima does not always coincide with the CO enhancements (Fig. 11); it is generally observed at 10
higher altitudes (which is consistent with in situ observations, de Gouw et al., 2004). This indicates that biomass burning is not the most important contribution, especially at high latitudes. However, the correlation increases at lower latitudes, where the biomass burning outflow from southern Asia and Indonesia is expected. Larger HCN mixing ratios are observed during the second time period, extending across the Pacific. The 15
vertical distributions are consistent with the simulated biomass burning signatures of CO (Fig. 12). However, the lower HCN mixing ratios in March-April than in April–May suggest an increased influence of the fire activity during the season that is not well represented in the model (no such increase in the biomass burning CO mixing ratios). Figure 12d shows profiles measured at mid-latitudes above the eastern Pacific at the 20
end of April 2005, where CO was clearly underestimated in the model (Fig. 9). Large HCN values highlight a strong influence from a biomass burning plume that is not captured in the model, with no clear enhancement of the measured C2H2/CO ratios indicating relatively aged air. This could reflect a strongly underestimated source, but also too large diffusion of a biomass burning plume or underestimated lofting of the 25
ACPD
8, 1709–1755, 2008Analysis of CO outflow from Asia using satellite data
S. Turquety et al.
Title Page
Abstract Introduction
Conclusions References
Tables Figures
◭ ◮
◭ ◮
Back Close
Full Screen / Esc
Printer-friendly Version
Interactive Discussion
EGU
5 Conclusions
In this study, the export of CO from Asia was analyzed with the global chemistry and transport model LMDz-INCA based on the complementary pictures provided by the satellite measurements from MOPITT, SCIAMACHY and ACE-FTS. In addition to the full NMHC-CH4-O3chemistry, CO regional tracers were included in LMDz-INCA in
or-5
der to track the signature from the main source regions. The surface emissions from the EDGAR 3.2 inventory have been updated for Asia by scaling emissions above this region to the inverse modeling results by P ´etron et al. (2004) (which are based on MO-PITT CO for 2001). Evaluation of the model CO simulation against MOZAIC aircraft observations showed an underestimate of CO by∼10–20% through the troposphere, 10
especially below∼500 hPa and above∼300 hPa. Further analysis of the Asian outflow was undertaken based on the satellite observations.
MOPITT and SCIAMACHY both use the nadir viewing geometry and provide global CO distributions with good spatial coverage (typically global every 3 days). However, the nadir geometry implies vertically integrated information. Between 1 and 2 pieces of 15
independent information are available in the MOPITT retrievals, with maximum sensitiv-ity in the free troposphere. SCIAMACHY only allows the retrieval of total CO columns, averaged temporally and/or spatially in order to decrease the random instrument-noise error, but equally sensitive throughout the troposphere. The ACE-FTS solar occultation observations offer valuable information on the vertical structure of the transport in the 20
middle and upper troposphere, in spite of the limited horizontal coverage. An inter-comparison of the CO measurements provided by the three instruments over Asia and the Pacific Ocean highlights their complementary nature and shows the good consis-tency between the datasets, with an agreement better than 20% between MOPITT and ACE-FTS in the upper troposphere. Although SCIAMACHY observes larger CO above 25
ACPD
8, 1709–1755, 2008Analysis of CO outflow from Asia using satellite data
S. Turquety et al.
Title Page
Abstract Introduction
Conclusions References
Tables Figures
◭ ◮
◭ ◮
Back Close
Full Screen / Esc
Printer-friendly Version
Interactive Discussion
EGU agreement is good. This reveals a bias between the two datasets, which needs further
investigation.
Accounting for this bias, the different sensitivities of MOPITT and SCIAMACHY al-low the analysis of CO at al-low altitudes. Boundary layer residuals (BLR) were obtained by subtracting MOPITT columns (with the contribution from the a priori removed) from 5
the SCIAMACHY total CO. This BLR provides information on the CO source regions, with, in particular, large enhancements above the main urban areas. The compari-son with the corresponding model BLR highlights an underestimate in Asian emissions in the model, in particular above eastern and central China, even after adjustment of the emissions. Recent inventories (Streets et al., 2006) and inverse modeling work 10
(Kopacz et al., 2008) also show that these source regions are underestimated in cur-rent inventories, and highlight the rapidly increasing fuel consumption in China (Ohara et al., 2007). Uno et al. (2007) show that model using updated Asian emissions still underestimate sources with respect to the GOME NO2 observations, particularly over China. A more thorough analysis of the possible trends in the MOPITT CO observa-15
tions would be required to better understand the recent evolution of the emissions. Our analysis also suggests an underestimate in emissions over south-east Asia, as well as Siberia and Canada during 2005, probably associated with too low biomass burning emissions.
The transport of pollution from Asia above the Pacific is clearly observed by MO-20
PITT, with strong CO enhancements extending from∼20◦N to∼60◦N. This is consis-tent with the ACE-FTS observations, with values typically reaching 200 ppb around 400–300 hPa. Although the model underestimates the total CO by∼8% compared to MOPITT, the transport patterns and temporal variations are reasonably well captured. The vertical structures simulated by LMDz-INCA are consistent with the ACE-FTS ob-25
ACPD
8, 1709–1755, 2008Analysis of CO outflow from Asia using satellite data
S. Turquety et al.
Title Page
Abstract Introduction
Conclusions References
Tables Figures
◭ ◮
◭ ◮
Back Close
Full Screen / Esc
Printer-friendly Version
Interactive Discussion
EGU also explained by underestimated export from CO source regions.
In addition to a good vertical resolution, the solar occultation observation mode of the ACE-FTS allows for the detection of a wide variety of chemical species thanks to a high signal to noise ratio. Measurements of acetylene (C2H2), ethane (C2H6) and hydrogen cyanide (HCN) were used in order to further examine the origin of the observed plumes. 5
C2H2and C2H6are well correlated with the CO profiles, highlighting common sources
and rapid trans-Pacific transport in the upper troposphere. The comparisons between the modeled and observed C2H6show the same characteristics as CO (too high in the
UTLS, too low in the transport plumes), but C2H2is too low throughout the troposphere,
consistent with too low export and too large diffusion in the model. 10
HCN is commonly used as a biomass burning tracer. Comparisons between the HCN observations and the model biomass burning signature show good agreement in the transport patterns, with strong enhancements in the 15◦N–30◦N latitude band, where the model regional CO tracers show a large signature from southern Asia and Indonesia, but reveals a possible underestimate in fire activity at the end of the season, 15
and/or too large diffusion of the fire plume in the model. Observed HCN and CO profiles are not well correlated for measurements at higher latitudes, indicating that biomass burning is not the dominant source. This is in agreement with the predominance of the eastern Asian contribution to the CO over this region in the model, revealed by the regional CO tracers.
20
We have shown that combining information from MOPITT, SCIAMACHY and ACE-FTS provides a more complete view of the Asian outflow, from surface emissions to transport in the middle and upper troposphere over the Pacific. Assimilation of the observations in the model would be needed to allow more quantitative analyses ac-counting for the specific properties of each dataset, including, in particular, their un-25
certainties and vertical resolution. Further analysis of ACE-FTS measurements will be undertaken to analyze the chemical composition of the air masses during export and their impact ozone production over the Pacific and further downwind.
(Cen-ACPD
8, 1709–1755, 2008Analysis of CO outflow from Asia using satellite data
S. Turquety et al.
Title Page
Abstract Introduction
Conclusions References
Tables Figures
◭ ◮
◭ ◮
Back Close
Full Screen / Esc
Printer-friendly Version
Interactive Discussion
EGU tre National d’Etudes Spatiales). P. F. Coheur is research associate with the FRS-FNRS
(gium). The research in Belgium was funded by the FRS-FNRS (contract F.4511.08), the Bel-gian Science Policy and the European Space Agency (ESA-Prodex arrangement C90-219). Financial support by the “ Actions de Recherche Concert ´ees ” (Communaut ´e Franc¸aise de Belgique) is also acknowledged. The Atmospheric Chemistry Experiment (ACE), also known 5
as SCISAT, is a Canadian-led mission mainly supported by the Canadian Space Agency (CSA) and the Natural Sciences and Engineering Research Council of Canada. SCIAMACHY is a joint project of the German Space Agency DLR and the Dutch Space Agency NIVR with con-tribution of the Belgian Space Agency. The authors thank the Netherlands SCIAMACHY Data Center and ESA for providing data. The authors acknowledge for their strong support the 10
European Commission, Airbus, CNRS-France, FZJ-Germany and the airlines (Lufthansa, Air France, Austrian and former Sabena who carry free of charge the MOZAIC instrumentation since 1994). The authors thank G. R. van der Werf (Vrije Universiteit Amsterdam), G. J. Collatz (NASA Goddard Space Flight Center), L. Giglio (SSAI, Maryland), J. T. Randerson (California Institute of Technology) and P. S. Kasibhatla (Duke University) for providing GFED-v2 biomass 15
burning emissions data (http://www.geo.vu.nl/users/gwerf/GFED.htm). The authors also thank Claire Granier for helpful discussions on surface emissions.
References
Akimoto, H.: Global air quality and pollution, Science, 302, 1716–1719, 2003.
Allen, D., Pickering, K., and Fox-Rabinovitz, M.: Evaluation of pollutant outflow and CO sources 20
during TRACE-P using model-calculated, aircraft-based, and Measurements of Pollution in the Troposphere (MOPITT)-derived CO concentrations, J. Geophys. Res., 109, D15S03, doi:10.1029/2003JD004250, 2004.
Arellano, A. F., Kasibhatla, P. S., Giglio, L., van der Werf, G. R., and Randerson, J. T.: Top-down estimates of global CO sources using MOPITT measurements, Geophys. Res. Lett., 25
31, L01104, doi:10.1029/2003GL018609, 2004.
Bernath P. F., McElroy, C. T., Abrams, M. C., et al.: Atmospheric Chemistry Experiment (ACE): Mission overview, Geophys. Res. Lett., 32, L15S01, doi:10.1029/2005GL022386, 2005. Bertschi, I. T., Jaffe, D. A., Jaegl ´e, L., Price, H. U., and Dennison, J. B.: PHOBEA/ITCT 2002
ACPD
8, 1709–1755, 2008Analysis of CO outflow from Asia using satellite data
S. Turquety et al.
Title Page
Abstract Introduction
Conclusions References
Tables Figures
◭ ◮
◭ ◮
Back Close
Full Screen / Esc
Printer-friendly Version
Interactive Discussion
EGU and aerosols to the northeast Pacific: Impacts of Asian anthropogenic and Siberian boreal
fire emissions, J. Geophys. Res., 109, D23S12, doi:10.1029/2003JD004328, 2004.
Bey, I., Jacob, D. J., Logan, J. A., and Yantosca, R. M.: Asian chemical outflow to the Pacific in spring: Origins, pathways and budgets, J. Geophys. Res., 106, 23 097–23 113, 2001. Boone, C. D., Nassar, R., Walker, K. A., Rochon, Y., McLeod, S. D., Rinsland, C. P., and 5
Bernath, P. F.: Retrievals for the atmospheric chemistry experiment Fourier-transform spec-trometer, Appl. Optics, 44, 7218–7218, 2005.
Buchwitz, M., de Beek, R., Bramstedt, K., No ¨el, S., Bovensmann, H., and Burrows, J. P.: Global carbon monoxide as retrieved from SCIAMACHY by WFM-DOAS, Atmos. Chem. Phys., 4, 1945–1960, 2004,
10
http://www.atmos-chem-phys.net/4/1945/2004/.
Buchwitz, M., Khlystova, I., Bovensmann, H., and Burrows, J. P.: Three years of global car-bon monoxide from SCIAMACHY: comparison with MOPITT and first results related to the detection of enhanced CO over cities, Atmos. Chem. Phys., 7, 2399–2411, 2007.
Clerbaux, C., Coheur, P.-F., Hurtmans, D., Barret, B., Carleer, M., Colin, R., Seme-15
niuk, K., McConnell, J. C., Boone, C., and Bernath, P.: Carbon monoxide distribution from the ACE-FTS solar occultation measurements, Geophys. Res. Lett., 32, L16S01, doi:10.1029/2005GL022394, 2005.
Clerbaux, C., Hadji-Lazaro, J., Turquety, S., George, M., Coheur, P.-F., Hurtmans, D., Wespes, C., Herbin, H., Blumstein, D., Tournier, B., and Phulpin, T.: The IASI/MetOp mission: first 20
observations and highlight of its potential contribution to the GMES Earth observation com-ponent, Space Research Today (COSPAR Inf. Bul.), 168, 19–24, 2007a.
Clerbaux, C., George, M., Turquety S., et al.: CO measurements from the ACE-FTS satel-lite instrument: data analysis and validation using ground-based, airborne and spaceborne observations, Atmos. Chem. Phys. Discuss., 7, 15 277–15 340, 2007b.
25
Clerbaux, C., Edwards, D. P., Deeter, M., Emmons, L., Lamarque, J.-F., Tie, X. X., Massie, S. T., and Gille, J.: Carbon monoxide pollution from cities and urban areas observed by the Terra/MOPITT mission, Geophys. Res. Lett., 35, in press, doi:10.1029/2007GL032300, 2008.
Coheur, P.-F., Herbin, H., Clerbaux, C., Hurtmans, D., Wespes, C., Carleer, M., Turquety, S., 30
ACPD
8, 1709–1755, 2008Analysis of CO outflow from Asia using satellite data
S. Turquety et al.
Title Page
Abstract Introduction
Conclusions References
Tables Figures
◭ ◮
◭ ◮
Back Close
Full Screen / Esc
Printer-friendly Version
Interactive Discussion
EGU 5446, 2007.
Deeter, M. N., Emmons, L. K., Francis, G. L., Edwards, D. P., Gille, J. C., Warner, J. X., Khattatov, B., Ziskin, D., Lamarque, J.-F., Ho, S.-P., Yudin, V., Atti ´e, J.-L., Packman, D., Chen, J., Mao, D., and Drummond, J. R.:: Operational carbon monoxide retrieval algo-rithm and selected results for the MOPITT instrument, J. Geophys. Res., 108(D14), 4399, 5
doi:10.1029/2002JD003186, 2003.
Deeter, M. N., Emmons, L. K., Edwards, D. P., Gille, J. C., and Drummond, J. R.: Vertical resolution and information content of CO profiles retrieved by MOPITT, Geophys. Res. Lett., 31, L15112, doi:10.1029/2004GL020235, 2004.
de Gouw, J. A., Cooper, O. R., Warneke, C., et al. : Chemical composition of air masses 10
transported from Asia to the U.S. West Coast during ITCT 2K2: Fossil fuel combustion versus biomass-burning signatures, J. Geophys. Res., 109, D23S20, doi:10.1029/2003JD004202, 2004.
de Laat, A. T. J., Gloudemans, A. M. S., Schrijver, H., van den Broek, M. M. P., Meirink, J. F., Aben, I., and Krol, M.: Quantitative analysis of SCIAMACHY carbon monoxide total column 15
measurements, Geophys. Res. Lett., 33, L07807, doi:10.1029/2005GL025530, 2006. de Laat, A. T. J., Gloudemans, A. M. S., Aben, I., Krol, M., Meirink, J. F., van der Werf, G.
R., and Schrijver, H.: Scanning Imaging Absorption Spectrometer for Atmospheric Chartog-raphy carbon monoxide total columns: Statistical evaluation and comparison with chemistry transport model results, J. Geophys. Res., 112, D12310, doi:10.1029/2006JD008256, 2007. 20
Dufour, G., Szopa, S., Hauglustaine, D.A., Boone, C. D., Rinsland, C. P., and Bernath, P. F.: The influence of biogenic emissions on upper-tropospheric methanol as revealed from space, Atmos. Chem. Phys. Discuss. , 7, 9183–9202, 2007.
Edwards, D. P., Emmons, L. K., Hauglustaine, D. A., et al. : Observations of carbon monoxide and aerosols from the Terra satellite: Northern Hemisphere variability, J. Geophys. Res., 25
109, D24202, doi:10.1029/2004JD004727, 2004.
Emmons, L. K., Pfister, G. G., Edwards, D. P., Gille, J. C., Sachse, G., Blake, D., Wofsy, S., Gerbig, C., Matross, D., and N ´ed ´elec, P.: Measurements of Pollution in the Troposphere (MOPITT) validation exercises during summer 2004 field campaigns over North America, J. Geophys. Res., 112, D12S02, doi:10.1029/2006JD007833, 2007.
30
ACPD
8, 1709–1755, 2008Analysis of CO outflow from Asia using satellite data
S. Turquety et al.
Title Page
Abstract Introduction
Conclusions References
Tables Figures
◭ ◮
◭ ◮
Back Close
Full Screen / Esc
Printer-friendly Version
Interactive Discussion
EGU http://www.atmos-chem-phys.net/6/2273/2006/.
Folkins, I., Bernath, P., Boone, C., Donner, L.J., Eldering, A., Lesins, G., Martin, R.V., Sinnhu-ber, B.-M., and Walker, K.: Testing convective parameterizations with tropical measurements of HNO3, CO, H2O, and O3: Implications for the water vapor budget, J. Geophys. Res., 111, D23304, doi:10.1029/2006JD007325, 2006.
5
Frankenberg, C., Platt, U., and Wagner, T.: Retrieval of CO from SCIAMACHY onboard EN-VISAT: detection of strongly polluted areas and seasonal patterns in global CO abundances, Atmos. Chem. Phys., 5, 1639–1644, 2005,
http://www.atmos-chem-phys.net/5/1639/2005/.
Funke, B., L ´opez-Puertas, M., Bermejo-Pantale ´on, D., von Clarmann, T., Stiller, G. P., H ¨opfner 10
M., Grabowski, U., and Kaufmann, M.: Analysis of nonlocal thermodynamic equilibrium CO 4.7 µm fundamental, isotopic, and hot band emissions measured by theMichelson Inter-ferometer for Passive Atmospheric Sounding on Envisat, J. Geophys. Res., 112, D11305, doi:10.1029/2006JD007933, 2007.
Gloudemans, A. M. S., Schrijver, H., Kleipool, Q., van den Broek, M. M. P., Straume, A. G., 15
Lichtenberg, G., van Hees, R. M., Aben, I., and Meirink, J. F.: The impact of SCIAMACHY near-infrared instrument calibration on CH4 and CO total columns, Atmos. Chem. Phys., 5, 2369–2383, 2005,
http://www.atmos-chem-phys.net/5/2369/2005/.
Gloudemans, A. M. S., Krol, M. C. , Meirink, J. F., de Laat, A. T. J., van der Werf, G. R., 20
Schrijver, H., van den Broek, M. M. P., and Aben, I.: Evidence for long-range transport of carbon monoxide in the Southern Hemisphere from SCIAMACHY observations, Geophys. Res. Lett., 33, L16807, doi:10.1029/2006GL026804, 2006.
Hauglustaine, D. A., Hourdin, F., Walters, S., Jourdain, L., Filiberti, M.-A., Larmarque, J.-F., and Holland, E. A.: Interactive chemistry in the Laboratoire de M ´et ´eorologie Dynamique 25
general circulation model : description and background tropospheric chemistry evaluation, J. Geophys. Res., 109, D04314, doi:10.1029/3JD003957, 2004.
Heald, C.L., Jacob, D. J., Fiore, A. M., et al.: Asian outflow and transpacific transport of carbon monoxide and ozone pollution: An integrated satellite, aircraft and model perspective, J. Geophys. Res., 108(D24), 4804, doi:10.1029/2003JD003507, 2003.
30
monox-ACPD
8, 1709–1755, 2008Analysis of CO outflow from Asia using satellite data
S. Turquety et al.
Title Page
Abstract Introduction
Conclusions References
Tables Figures
◭ ◮
◭ ◮
Back Close
Full Screen / Esc
Printer-friendly Version
Interactive Discussion
EGU ide, J. Geophys. Res., 109, D23306, doi:10.1029/2004JD005185, 2004.
Heald, C. L., Jacob, D. J., Park, R. J., Alexander, B., Fairlie, T. D., Yantosca, R. M., and Chu, D. A.: Transpacific transport of Asian anthropogenic aerosols and its impact on surface air quality in the United States, J. Geophys. Res., 111, D14310, doi:10.1029/2005JD006847, 2006.
5
Hudman, R. C., Jacob, D. J., Cooper, O. R., et al.: Ozone production in transpacific Asian pollu-tion plumes and implicapollu-tions for ozone air quality in California, J. Geophys. Res., 109(D23), D23S10, doi:10.1029/2004JD004974, 2004.
Jacob, D. J., Crawford, J. H., Kleb, M. M., Connors, V. S., Bendura, R. J., Raper, J. L., Sachse, G. W., Gille, J. C., Emmons, L., and Heald, C. L.: Transport and Chemical Evolution over the 10
Pacific (TRACE-P) aircraft mission: Design, execution, and first results, J. Geophys. Res., 108(D20), 9000, doi:10.1029/2002JD003276, 2003.
Jaffe, D.A., Anderson, T., Covert, D., Kotchenruther, R., Trost, B., Danielson, J., Simpson, W., Berntsen, T., Karlsdottir, S., Blake, D., Harris, J., Carmichael, G., and Uno, I.: Transport of Asian Air Pollution to North America, Geophys. Res. Lett., 26, 711–714, 1999.
15
Jaffe, D. A., Bertschi, I., Jaegl ´e, L., Novelli, P., Reid, J. S., Tanimoto, H., Vingarzan, R., and Westphal, D.: Long-range transport of Siberian biomass burning emissions and im-pact on surface ozone in western North America, Geophys. Res. Lett., 31, L16106, doi:10.1029/2004GL020093, 2004.
Jiang, J. H., Livesey, N. J., Su, H., Neary, L., McConnell, J. C., and Richards, N. A. D.: Connect-20
ing surface emissions, convective uplifting, and long-range transport of carbon monoxide in the upper troposphere: New observations from the Aura Microwave Limb Sounder, Geophys. Res. Lett., 34, L18812, doi:10.1029/2007GL030638, 2007.
Kar, J., Bremer, H., Drummond, J. R., et al.: Evidence of vertical transport of carbon monoxide from Measurements of Pollution in the Troposphere (MOPITT), Geophys. Res. Lett., 31, 25
L23105, doi:10.1029/2004GL021128, 2004.
Kopacz, M., Jacob, D. J., Henze, D. K., Heald, C. L., Streets, D. G., and Zhang, Q.: Compar-ison of adjoint and analytical Bayesian inversion methods for constraining Asian sources of carbon monoxide using satellite (MOPITT) measurements of CO columns, J. Geophys. Res., accepted, doi:10.1029/2007JD009264, 2008.
30