Rogério Lacerda dos Santos1, Antônio Carlos de Oliveira Ruellas2
Dentofacial characteristics of patients with Angle Class I and
Class II malocclusions
Objective: The present study assessed some cephalometric measurements of the soft tissue profile in order to observe the behavior of facial convexity in patients with Class I, Class II division 1, and Class II division 2 malocclusions.
Methods: One hundred and thirty pre-treatment teleradiographs of Caucasian patients aged 10-16 years (mean age of 12.6 years) were selected for study and divided into 3 groups. The cephalometric measurements used in the present study were the following: H.SN, Cx, NLA, MLA, UL-SUL-S, LL-S, IMPA, and 1-SN. Analysis of variance and Tukey’s test were applied for measurements H.SN, Cx, IMPA, 1-SN, MLA, and NLA, whereas Kruskal-Wallis and Dunn’s tests were applied for UL-S and LL-S.
Results: The results showed statistically significant differences for the measurements H.SN, Cx, UL-S, and IMPA between Groups I, II-1 and II-2 (p < 0.05). Measurements LL-S and MLA showed statistically significant difference between Groups I and II-1 only (p < 0.05). On the other hand, no statistically significant differences were found for measurement NLA among the 3 groups (p < 0.05).
Conclusion: Regarding facial characteristics expressed by measurements H.SN, Cx, and UL-S, one could conclude that Class II division 1 and Class II division 2 malocclusions, both differed from Class I malocclusion. In addition, Class II division 1 malocclusion was found to have facial characteristics expressed by MLA, which differentiate it from the Class II division 2 and Class 1 malocclusions. Class I, Class II division 1 and Class II division 2 malocclu-sions showed no difference in facial characteristics expressed by the measurement NLA, and measurement LL-S was directly related to eversion of the lower lip.
Keywords: Malocclusion. Cephalometry. Angle’s classification.
How to cite this article: Santos RL, Ruellas ACO. Dentofacial characteristics of patients with Angle Class I and Class II malocclusions. Dental Press J Orthod. 2012 Mar-Apr;17(2):46e.1-7.
Submitted: July 29, 2008 - Revised and accepted: November 24, 2011
» The authors report no commercial, proprietary, or financial interest in the products or companies described in this article.
Contact address: Rogério Lacerda dos Santos
Av. dos Universitários, s/n, Rodovia Patos/Teixeira, Km1, Santa Cecília - 58700-970 Patos, PB –Brazil - E-mail: [email protected] / [email protected]
1 Specialist in Orthodontics, Federal University of Alfenas - UNIFAL. MSc and PhD
in Orthodontics, Federal University of Rio de Janeiro - UFRJ. Adjunct Professor of Orthodontics, Federal University of Campina Grande - UFCG.
2 MSc and PhD in Orthodontics, Federal University of Rio de Janeiro - UFRJ.
INTRODUCTION
The concept of beauty is philosophical, as the attri-bute refers to a supra-material dimension and is man-ifested by means of mediate realities that are percep-tible to sight and sensitive to reason and emotion. The notion of “harmonious profile” differs from person to person and from one race or ethnic group to another. The harmonious profile may be considered a variant that depends on ethnic or racial factors and temporal
factors of the individuals7 and it may not be analyzed
exclusively by mean values or numbers.
The importance of identifying the facial types of each individual arises from the influence it has on the
profile of the individual and dental arches.10 The
rela-tionship of the incisors with their respective bony bas-es and the facial growth pattern also have a significant influence on soft tissue profile assessment according
to Riedel.25 Examiners tend to prefer a more retrusive
lip position for a reduced convexity and improve facial
esthetics in both men and women.17
Several structures shape the complex called fa-cial profile that undergoes changes throughout one’s lifetime. Studies have found that during youth there is more extensive growth in the area of nose and lips whereas there is minimal growth in the menton area. Upper lip full length is established by the age of 7, but an increase in depth and length of the nose is observed in adult’s facial profile for both genders. In men, the upper and lower lip thickness diminishes, whereas in women the profile becomes more convex because there are greater growth changes in the nose than in the
men-ton.20 Nevertheless, in terms of absolute and total area,
the lips and menton were found to be larger in men;the male menton and female nose were significantly larg-er. The overall result was that the male profile was
straighter and the female profile more convex.28
Over the last one hundred years, especially in the past decade, the concept of facial beauty has under-gone changes in esthetic agreement and the contem-porary profile is shown to have more prominent lips in contrast with profiles of the early twentieth century with thin and less voluminous lips. One of the reasons could be that fuller lips tend to show a more youthful appearance. There are increasing endeavors to com-pare, relate and define standards and reliable mea-sures for assessing facial esthetics with the purpose of defining reliability in the evaluation of these profiles.
The aim of the present study was to compare some measurements related to facial convexity among pa-tients with Class I, Class II division 1 and Class II di-vision 2 malocclusions, also comparing them with the standard measurements.
MATERIAL AND METHODS
This study was first sent to the Research Ethics Committee of the School of Pharmacy and Dentistry of Alfenas and received approval. For this study, 130 pre-treatment cephalometric radiographs obtained
by the Broadbent6 technique were selected. They were
of Caucasian patients, aged between 10 and 16, mean age of 12.6 years old, from the Orthodontics special-ization program clinic at the School of Pharmacy and Dentistry of Alfenas.
The participants in the sample were randomly se-lected with regard to gender, and none of them had been submitted to orthodontic treatment of any kind. The exclusion criteria were presence of crossbite, open bite or indication for ortho-surgical treatments. The sample was divided into three groups. Group I was composed of 50 individuals with Class I malocclusion, being 26 boys and 24 girls. Group II-1 was composed of 50 individuals with Class II division 1 malocclusion, being 25 boys and 25 girls, and the third group, Group II-2, was composed of 30 individuals with Class II di-vision 2 malocclusion, with 14 boys and 16 girls. The malocclusions were classified by the examination of
dental casts (molar relationship according to Angle)1
and angular cephalometric measurements (ANB, 1.SN). All Angle Class I malocclusions were skeletal Class I (ANB between 0º and 4°) and all Class II mal-occlusions (division 1 and 2) were skeletal Class II (ANB greater or equal to 5°).
The method chosen was the comparison of ceph-alometric measurements. All the radiographs were obtained following the standardization norms of the
first cephalometric workshop.26 All tracings were
per-formed with the objective of selecting the anatomi-cal structures of interest. The measurements were performed by a single orthodontist, and were verified twice at different occasions.
The angular measurements used were as follows:
NLA
LMA IMPA
-SN 1
HSN
Cx
and another line from the subnasale point to the soft pogonion point (Pog’). Ideally it should
be –11±4° according to Downs9 (Fig 2).
• Angle (H.SN), formed by the intersection of SN
line with H-line. For Holdaway and Merrifield14
the value of this angle should be 73º (Fig 2).
• Nasolabial angle (NLA), formed by the inter-section of the line that passes through the colu-mella (Cm) and subnasal (Sn) points and the line that passes through the labrale superior (Ls) and subnasale (Sn) points. According to
Sheide-man,27 the nasolabial angle must beat 110° with a
clinical deviation from 90° to 110° (Fig 1).
• Mentolabial angle (MLA), formed by the in-tersection of the line that passes through the the lower lip vermillion point (LV) up to point B’ and a line from point B’ to the soft pogonion point (Pog’) which, according to Nguyen and
Turley,22 must be to 128.5° with a clinical
devia-tion of ± 11° (Fig 1).
• Angle(1-SN),formed by the intersection of the long axis of the maxillary incisor and the SN line. The ideal value considered for this angle is
103°according to Steiner and Riedel29 (Fig 1).
• Angle (IMPA), formed by the intersection of the long axis of the mandibular incisor and mdibular plane. The normative value for this
an-gle must be 90±5° according to Tweed30 (Fig 1).
The linear measurements used were as follows:
• UL-S: Distance from the most anterior point of
the upper lip convexity to the S-line of Steiner.
According to Steiner29 the ideal distance would
be 0 mm (Fig 2).
• LL-S: Distance from the most anterior point of
the lower lip convexity to S-line of Steiner.
Ac-cording to Steiner29 the ideal distance would
also be 0 mm (Fig 2).
STATISTICAL ANALYSIS Method error
In order to assess the method error and increase its reliability, 30 cephalometric radiographs were ran-domly selected from the 3 groups studied. The radio-graphs were traced again by a single operator after a 1 month interval from the initial tracing, according to
Midtgard, Bjork and Linder-Aronson.19
The error was calculated in accordance with the
formula proposed by Dahlberg8 and defended by
Houston,15 and the paired t-test (for the variables
with normal distribution) and Wilcoxon paired test (for the variables UL-S and LL-S) were performed comparing the two tracings at a level of significance of 5%. The deviation values were below the accept-able limits to the method error assessment which is 1.5 degrees for the angular measurements and 1.0 mm for the linear measurements, in accordance with
Houston’s recommendations.15
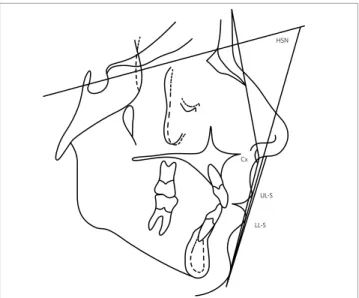
Figure 1 - Representation of the angular measurements of dental positioning and lip posture.
Figure 2 - Representation of the angular measurements of facial convexity and linear measurements of lip positioning.
UL-S
140
I II-1 II-2
1 - SN
120
100
80
60
40
20
0 B
A
C
120
I II-1 II-2
IMPA
100
80
60
40
20
0
B A A
Data analysis
Initially, an exploratory analysis of the data was performed using the Proc Lab of the SAS* statistical software (SAS Institute Inc., Cary, NC, USA, Release 8.2, 2001). The analysis of variance and the Tukey test were used for the data that met the presuppositions of parametric analysis (Cx, IMPA, 1-SN, MLA and NLA). For the variable H.SN, the logarithmic transforma-tion was used followed by the Analysis of Variance and the Tukey test. Since the other variables (LL-S and UL-S) did not meet the presuppositions of para-metric analysis, Kruskal-Wallis and Dunn tests were used. For some variables the median was used instead of the mean because some measurements were shown to be discrepant and were not indicated for obtaining the mean. However, this did not harm the objectives of this study, as the test applied to one variable was the
same for the three types of malocclusions and these were compared to each other, to find the similarity among them. In all the analyses, a level of significance of 5% was considered.
RESULTS AND DISCUSSION
The measurement 1-SN showed (Fig 3) statisti-cally significant difference between the three groups
(p<0.05) corroborating the findings of Riedel25. This
measurement was revealed to be capable of differen-tiating these malocclusions. However, when consid-ering the SD, expressive values were observed for all malocclusions (6.02 Class I; 6.39 Class II-1; 5.18 Class II-2), which suggests variations in the inclination of the cranial base and axial inclination of the maxillary incisor. This incisor could undergo variations
result-ing from factors inherent to anterior-posterior13,21
Table 1 - Dentofacial angular measurements.
N=50 (Groups I and II- 1) and N=30 (Group II-2), Mean (Standard deviation). *Equal letters: No statistically significant difference (p<0.05), observed for the same measurement.
Angular Measurements
Groups 1-SN IMPA MLA NLA CX H.SN
I 105.34(6.02)b 90.22(5.39)b 120.3(13.26)a 108.55(9.92)a 166.58(4.47)a 67.58(5.73)a
II-1 110.19(6.39)a 98.15(7.35)a 110.56(16.80)b 105.18(12.21a 161.19(4.83)b 59.65(4.51)b
II-2 96.62(5.18)c 97.82(8.45)a 115.18(15.44)ab 109.73(9.46)a 158.95(4.08)b 57.58(4.39)b
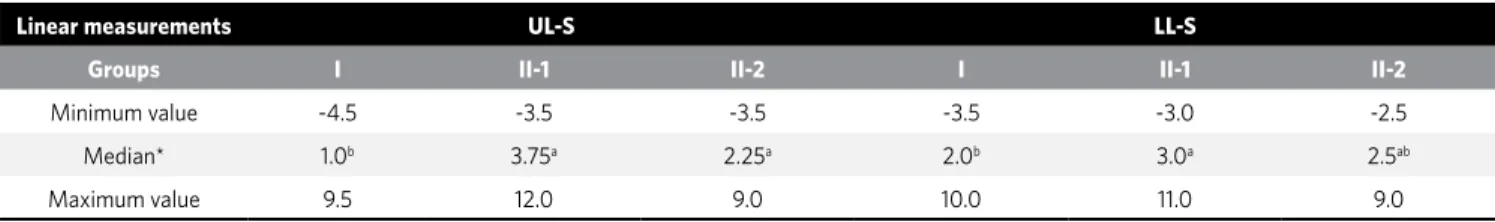
Table 2 - Linear measurements of lip positioning.
N=50 (Groups I and II-1) and N=30 (Group II-2), *equal letters: No statistically significant difference (p<0.05), observed for the same measurement.
Linear measurements UL-S LL-S
Groups I II-1 II-2 I II-1 II-2
Minimum value -4.5 -3.5 -3.5 -3.5 -3.0 -2.5
Median* 1.0b 3.75a 2.25a 2.0b 3.0a 2.5ab
Maximum value 9.5 12.0 9.0 10.0 11.0 9.0
Figure 3 - Means for 1-SN angular measurement. Figure 4 - Means for IMPA angular measurement.
Groups
Degr
ees
Groups
Degr
MLA
CX
UL-S
NLA
H.SN
LL-S 140
140 160
I II-1 II-2 I II-1 II-2
120
120
100
100
80
80
60 60
40 40
20 20
0 0
B
A AB A A A
140 160 180
I II-1 II-2 I II-1 II-2
120
100
80
80
70
60
50
40
60 30
40 20
20 10
0 0
B
B A
A B
B
I II-1 II-2 I II-1 II-2
4
3,5
3
3
2,5
2,5
2
2
1,5
1,5
1
1
0,5 0,5
0 0
B
B A
A
A
AB
skeletal growth, perioral muscles, tongue and position
of the antagonist teeth.24
The measurement IMPA showed (Fig 4) a statis-tically significant difference between Groups Class I and Class II-1, and between Groups Class I and Class II-2(p<0,05). The expressive SD (5.39 Class I; 7.35 Class II-1; 8.45 Class II-2), particularly in Class II malocclusions, showed that the axial behavior of man-dibular incisors on their bony base (IMPA) was highly
variable, similarly to findings of Tweed30 for Group
Class I and higher than the value found by Tweed for Class II malocclusions. Furthermore, the IMPA also depends on other factors such as the perioral muscles, tongue, overjet, overbite, presence of habits, growth and each individual’s own characteristics. It is worth
emphasizing the similarity found for the measure-ments of the Groups Class II-1 and Class II-2, which showed the same proclination of the mandibular
inci-sors for compensation of Class II,16,18 irrespective of
the type of malocclusion.
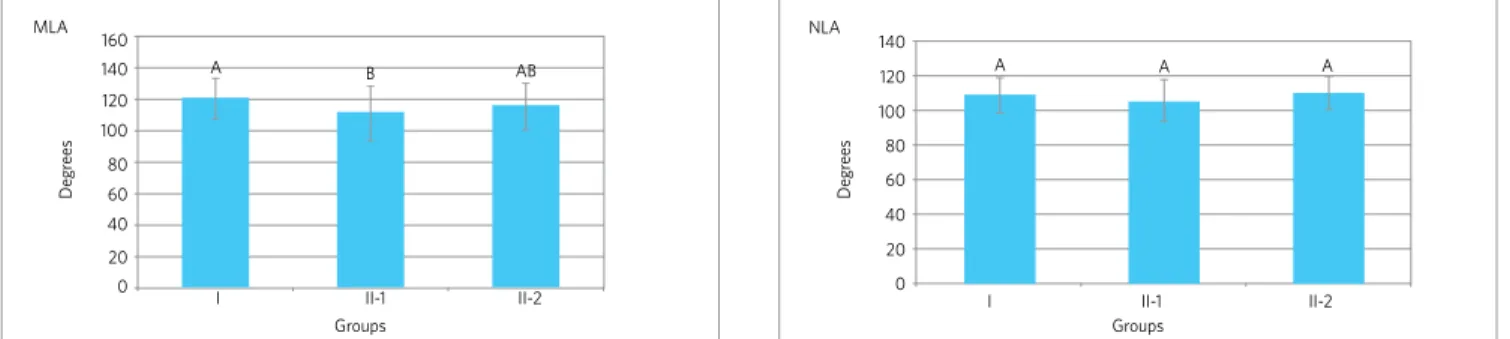
The MLA angle showed (Fig 5) a statistically sig-nificant difference only between Groups Class I and Class II-1 (p<0.05), similar to the findings of Nguyen
and Turley22 for Group Class I but lower for Class II
malocclusion and expressive SD for all groups (13.26 Class I; 16.80 Class II-1; 15.44 Class II-2), which is a reflection of the variations in lip position. A more sig-nificant degree of eversion of the lower lip was found for Group Class II-1 due to greater protrusion and pro-clination (1-SN) of the maxillary incisor in this group.
Figure 5 - Means for MLA angular measurement. Figure 6 - Means for NLA angular measurements.
Groups Groups
Degr
ees
Degr
ees
Figure 7 - Means for CX angular measurement. Figure 8 - Means for H.SN angular measurement.
Groups Groups
Degr
ees
Degr
ees
mm
mm
Figure 9 - Medians for UL-S linear measurements. Figure 10 - Medians for LL-S linear magnitude.
In spite of the more anterior positioning of the max-illary incisor in Group Class II-2, this group showed no significant eversion and presented similar values to those of Group Class I as a result of compensation between the existing retroclination of the maxillary incisors (1-SN) and the proclination of the
mandibu-lar incisors (IMPA).5
The NLA measurement showed (Fig 6) no statisti-cally significant difference for the 3 groups (p>0.05),
cor-roborating the findings of Scheidemam;27 Epker, Stella
and Fish.11 The high SD values (9.92 Class I; 12.21 Class
II-1; 9.46 Class II-2) showed that this angle can undergo significant variations, and still remain within the es-thetic values . It is worth pointing out that there seems to be a compensation of point Cm (Columella) and/or the
position of the upper lip in these malocclusions,27 resting
on the professional the responsibility of evaluating the harmony existent between the lip and nose and make a decision in each case, since the measurement of this an-gle was not capable of differentiating the three types of
malocclusion. This corroborates the findings of Reche,23
but is contrary to the findings of Fitzgerald, Nanda and
Currier,12 who reported that this angle is reliable.
The CX measurement showed a statistically sig-nificant difference between Groups Class I and Class II-1, and between Class I and Class II- 2 (p<0.05)
simi-larly to the findings of Arnett, Bergman,2 but differing
from those of Downs,9 the SD was not very significant.
The values found for Groups Class II-1 and Class II-2 suggest greater lip protrusion. The individuals with
Class II-1 showed a greater angle of convexity4 and the
opposite for the Group Class II-2, but without statisti-cally significant difference.
The H.SN measurement showed a statistically significant difference between Groups Class I and Class II-1 and between Groups Class I and Class II-2
(p<0.05) according to Holdaway,13 but with lower
val-ues and a less significant SD. The results corroborate the findings of the CX measurement. The higher val-ues shown by the Group Class II-1, in comparison with Group Class II-2, even though there is not a statisti-cally significant difference between these two groups, suggest a smaller inclination of the cranial base, as there seems to be a trend towards positive correlation
between Group Class II-1 and the presence of a spatial change of the mandible in the clockwise direction.
The linear measurement of UL-S showed a statis-tically significant difference between Groups Class I and Class II-1 and between Class I and Class II-2 (p<0.05). The values found for three groups were
higher than those recommended by Steiner,29 but are
in agreement with those found by Auger and Turley.3
The values show that the Groups with Class II maloc-clusion showed no statistically significant difference among them, however it suggests a direct relationship
with the nose size.13,14 showing an anterior-posterior
growth of the nose, inferior for Group Class II-1 when compared with Group Class II- 2.
The linear measurement of LL-S showed a statis-tically significant difference only between Groups Class I and Class II-1 (p<0.05). The values for the three groups were higher than those recommended
by Steiner,29 but are in agreement with those found by
Auger and Turley.3 These results show that the values
found for Group Class II-1 reflect the greater eversion of the lower lip found in this group due to the position of the maxillary incisor, since the values of the Li-NPog measurement are very similar for Groups Class II-1 and Class II-2, on the contrary from the angular values of MLA and IMPA, in spite of showing no statis-tically significant difference among the groups.
CONCLUSIONS
» The Class II-1, Class II-2 and Class I malocclu-sions showed different facial characteristics for the 1-SN measurement.
» The Class II-1 malocclusion showed facial char-acteristics that differentiate it from Class II-2 and Class I as regards the MLA measurement. » Class II-1, Class II-2 and Class I malocclusions
did not show different facial characteristics for the NLA measurement and showed a direct re-lationship with lower lip eversion for the LL-S measurement.
1. Angle EH. Classification of malocclusion. Dent Cosmos. 1899;41:255-64. 2. Arnett GW, Bergman RT. Facial keys to orthodontic diagnosis and treatment
planning - Part I. Am J Orthod Dentofacial Orthop. 1993;103(4):299-312. 3. Auger TA, Turley PK. The female soft tissue prolife as presented in fashion
magazines during the 1900s: a photographic analysis. Int J Adult Orthod Orthognath Surg. 1999;14(11):7-18.
4. Bishara SE, Cummins DM, Zaher AR. Treatment and post treatment charges in patients with class II, division 1 maloclusion after extraction and nonextraction treatment. Am J Orthod Dentofacial Orthop. 1997;111(1):18-27.
5. Brandão AMB, Vigorito JW, Capelozza Filho L. Avaliação das características do perfil tegumentar em pacientes com maloclusão classe II, divisão 1 por meio da análise facial numérica. Ortodontia. 2001;34(2):59-85.
6. Broadbent BH. A new x-ray technique and its application to orthodontia. Angle Orthod. 1931;1(2):45-66.
7. Burstone CJ. The integumental profile. Am J Orthod. 1958;44(1):1-25. 8. Dahlberg G. Statistical methods for medical and biological students. New York:
Interscience; 1940.
9. Downs WB. Análises do perfil dentofacial. Angle Orthod. 1956;26(12):191-212. 10. Enlow DH. Crescimento Facial. Rio de Janeiro: Artes Médicas; 1984.
11. Epker BN, Stella JP, Fish LC. Dentofacial deforrmities: integrated Orthodontic and surgical correction. 2a ed. St. Louis: Mosby; 1995.
12. Fitzgerald JP, Nanda R, Currier GF. Na evaluation of the nasolabial angle and the relative inclinations of the nose and upper lip. Am J Orthod Dentofacial Orthop. 1992;102(9):328-34.
13. Holdaway RA, Merrifield LL. A soft-tissue cephalometric analysis and its use in orthodontic treatment planning. Part I. Am J Orthod. 1983;84(1):1-28. 14. Holdaway RA, Merrifield LL. The profile line as an aid in critically evaluating facial
esthetic. Am J Orthod. 1966;52(11):804-22.
15. Houston WJB. The analysis of errors in orthodontic measurements. Am J Orthod Dentofacial Orthop. 1983;83(5):382-90.
16. Lindquist JT. The lower incisor: its influence on treatment and esthetics. Am J Orthod. 1958;44(2):112-40.
REFERENCES
17. Loi H, Nakata S, Nakasima A, Counts A. Effect of facial convexity on antero-posterior lip positions of the most favored Japanese facial profiles. Angle Orthod. 2005;75(3):326-32.
18. Merrifield LL. Differential diagnosis. Semin Orthod. 1996;2(4):241-53.
19. Midtgard J, Bjork G, Linder-Aronson S. Reproducibility of cephalometric landmarks and errors of measurements of cephalometric cranial distances. Angle Orthod. 1974;44(1):56-61.
20. Czarnecki ST, Nanda RS, Currier GF. Perceptions of a balanced facial profile. Am J Orthod Dentofacial Orthop. 1993;104(2):180-7.
21. Nanda RS, Ghosh J. Harmonia entre os tecidos moles da face e crescimento no tratamento ortodôntico. In: Sadowsky PL, Zachrisson BU, Nanda R, Vlachos CC, Vaden JL, editores. Atualidades em Ortodontia. Porto Alegre: Premier; 1997. p. 65-78.
22. Nguyen DDE, Turley PK. Changes in the caucasian male facial profile as depicted in fashion magazines during the twentieth century. Am J Orthod Dentofacial Orthop. 1998;114(2):208-17.
23. Reche R. Análise do perfil facial em fotografias padronizadas. Rev Dental Press Ortod Ortop Facial. 2002;7(8):37-45.
24. Ricketts RM. Esthetics, environment and the law of lip relation. Am J Orthod. 1968;54(4):272-89.
25 Riedel RA. The relation of maxillary structures to craniun in malocclusion and in normal occlusion. Angle Orthod. 1952;22(3):142-5.
26. Salzmann JA. First roentgenographic cephalometric workshop. Am J Orthod. 1958;44(12):899-900.
27. Scheideman GB. Cephalometric analysis of dentofacial normals. Am J Orthod. 1980;78(9):404-20.
28. Skinazi GLS, Lindauer SJ, Isaacson RJ. Chin, nose and lips. Normal ratios in young men and women. Am J Orthod Dentofacial Orthop. 1994;106(5):518-23. 29. Steiner CC. Cephalometric as a clinical tool. In: Kraus BS, Riedel RA, editors. Vistas
in Orthodontics. Philadelphia: Lea & Febiger; 1962. p. 131-61.