Implantable collamer lens and femtosecond laser for myopia: comparison using an
adaptive optics visual simulator
Lente implantável de collamer e laser de femtosegundo para miopia: comparação usando um
simulador visual de óptica adaptativa
Cari Pérez-ViVes1, César albarrán-Diego1, santiago garCía-lázaro1, teresa Ferrer-blasCo1, robert Montés-MiCó1
Submitted for publication: December 16, 2013 Accepted for publication: January 3, 2014
Study conducted at Optics Department, Faculty of Physics, University of Valencia, Spain.
1 Optics Department, Faculty of Physics, University of Valencia, Spain.
Funding: This research was supported in part by the VALi+D research scholarship to Cari Pérez-Vives (ACIF/2012/099; GeneralitatValenciana).
Disclosure of potential conflicts of interest: None of the authors have any potential conflicts of interest to disclose.
Corresponding author: Cari Pérez-Vives. Optics Department. University of Valencia C/ Dr. Moliner 50 - 46100 Valencia (Spain) - E-mail: [email protected]
INTRODUCTION
The femtosecond laser (FS) is the most interesting technical de velopment in laser refractive surgery during the last few years(1,2).
This technique was developed to create flaps for laser in situ kerato-mileusis (LASIK)(3,4). The FS is a focusable infrared (1053 nm) laser that
uses ultrafast pulses in the 100-femtosecond (100 x 10-15 second)
range. The laser delivers closely spaced spots that can be focused at a preset depth to photodisrupt tissue within the corneal stroma, while causing minimal inflammation and collateral tissue damage. In the recent meta-analysis by Zhang et al.(5) that compared femtosecond
LASIK (F-LASIK) with mechanical microkeratome LASIK for myopia, no
ABSTRACT
Purpose: To compare optical and visual quality of implantable collamer lens (ICL) implantation and femtosecond laser in situ keratomileusis (F-LASIK) for myopia. Methods: The CRX1 adaptive optics visual simulator (Imagine Eyes, Orsay, France) was used to simulate the wavefront aberration pattern after the two surgical procedures for -3-diopter (D) and -6-D myopia. Visual acuity at different contrasts and contrast sensitivities at 10, 20, and 25 cycles/degree (cpd) were measured for 3-mm and 5-mm pupils. The modulation transfer function (MTF) and point spread function (PSF) were calculated for 5-mm pupils.
Results: F-LASIK MTF was worse than ICL MTF, which was close to diffraction-limited MTF. ICL cases showed less spread out of PSF than F-LASIK cases. ICL cases showed better visual acuity values than F-LASIK cases for all pupils, contrasts, and myopic treatments (p<0.05). No statistically significant differences were found in contrast sensitivities between ICL and F-LASIK cases with -3-D myopia for both pupils for all evaluated spatial frequencies (p>0.05). For -6-D myopia, however, statistically significant differences in contrast sensitivities were found for both pupils for all evaluated spatial frequencies (p<0.05). Contrast sensitivities were better after ICL implantation than after F-LASIK.
Conclusions: ICL implantation and F-LASIK provide good optical and visual qua-lity, although the former provides better outcomes of MTF, PSF, visual acuity, and contrast sensitivity, especially for cases with large refractive errors and pupil sizes. These outcomes are related to the F-LASIK producing larger high-order aberrations.
Keywords: Myopia/surgery; Lasers, excimer/therapeutic use; Keratomileusis, laser in situ/methods; Lenses, intraocular; Contrast sensitivity; Visual acuity
RESUMO
Objetivo: Comparar a qualidade óptica e visual da lente implantável de collamer (ICL) e da ceratomileuse in situ com laser de femtosegundo (F-LASIK) na correção de miopia.
Métodos: O simulador visual de óptica adaptativa CRX1 (Imagine Eyes, Orsay, França) foi usado para simular o padrão de aberração de frentes de onda, depois de dois procedimentos cirúrgicos: implante de ICL e tratamento F-LASIK para -3 e -6 D. A acuidade visual em diferentes contrastes e sensibilidade ao contraste em 10, 20 e 25 ciclos/grau (cpd) foram medidos para pupilas de 3 e 5 mm. A função de transferência de modulação (MTF) e a função de espalhamento de ponto (PSF) foram calculados para a pupila de 5 mm.
Resultados: A MTF do F-LASIK foi pior do que a do ICL, que estava perto da MTF do limite de difração. A ICL apresentou menor espalhamento do PSF do que o F-LASIK. ICL apresentou melhores valores da acuidade visual do que F-LASIK para todas as pu-pilas, contrastes e tratamentos miópicos (p<0,05). Não foram encontradas diferenças estatisticamente significantes na sensibilidade ao contraste entre ICL e F-LASIK de -3 D, para ambas as pupilas e quaisquer frequências espaciais avaliadas (p>0,05). Por outro lado, para -6 D, diferenças estatisticamente significativas na sensibilidade ao contraste foram encontrados para ambas as pupilas e todas as frequências espaciais avaliadas (p<0,05). Sensibilidade ao contraste foi melhor após o implante da ICL que após o F-LASIK.
Conclusões: ICL e F-LASIK proporcionam uma boa qualidade óptica e visual, em-bora a ICL oferece melhores resultados de MTF, PSF, acuidade visual e sensibilidade ao contraste, especialmente para grandes erros de refração e tamanhos de pupila. Estes resultados estão relacionados ao procedimento F-LASIK que induz maiores aberrações de alta ordem.
Descritores: Miopia/cirurgia; Laser de excimer; Ceratomileuse assistida por excimer laser in situ/métodos; Lentes intraoculares; Sensibilidade de contraste; Acuidade visual
differences in efficacy, accuracy, or safety measures were observed between the two techniques, although F-LASIK was found to induce fewer aberrations. Other studies(6,7) comparing these techniques
report a better contrast sensitivity (CS) at high frequencies used in F-LASIK, subsequently resulting in a better optical quality.
The Visian Implantable Collamer lens (ICL, STAAR Surgical, Nidau, Switzerland) is a posterior chamber phakic intraocular lens approved for myopia correction by the United States Food and Drug Adminis-tration (US FDA). Previous studies, including the multicenter US FDA ICL(8,9) and others(10), have confirmed both the safety and effectiveness
with 3(9) and 5(10) years of follow-up. Other studies have also shown
the high optical and visual quality of these lenses(11,12). Outcomes of
these studies have demonstrated the viability of the Visian ICL as an alternative to current refractive laser surgical treatment options.
Previous reports(13-15) have compared ICL implantation with
me-chanical microkeratome LASIK and found better outcomes for safety, efficacy, predictability, and stability with ICL implantation, even in eyes with low myopia. Using an adaptive optics visual simulator, Pérez-Vives et al.(16) compared optical and visual quality after ICL im
-plan tation and LASIK and obtained better outcomes after the former. However, to our knowledge, there are no studies comparing the outcomes of ICL implantation and F-LASIK.
The goal of this study was to compare optical and visual quality after ICL implantation and F-LASIK for -3-diopter (D) and -6-D of myopia. We used an adaptive visual simulation to simulate ICL and F-LASIK’s aberration patterns. Visual acuity (VA) for different contrasts and CS for 3-mm and 5-mm pupils also were evaluated.
METHODS
S
UBJECTSTwenty individuals (20 eyes) aged 19-35 years who had experien-ce in psychophysical experiments participated in this study. Spherical refractive errors ranged between -2.50 and +1.50 D with astigmatism <0.50 D. The patients had clear intraocular media and no known ocu-lar pathology. Wavefront aberrations were measured with the natural pupil. The pupil diameter was usually >5 mm as the room light was off during the experiments.
The tenets of the Declaration of Helsinki were followed. Informed consent was obtained from each participant after verbal and written explanations of the nature and possible consequences of the study were provided. The study protocol received institutional review board approval.
I
NTRAOCULARLENSThe Visian ICL is a plate-haptic single-piece lens designed to be implanted in the posterior chamber with support on the ciliary sul-cus. It is made of Collamer, a flexible, hydrophilic, and biocompatible material. The optic diameter of these lenses is 6 mm and they come in five sizes with different overall diameters (11.0, 11.5, 12.0, 12.5, and 13.0 mm). The lens has a central convex-concave optic zone with a diameter of 4.5-5.5 mm, depending on the dioptric power. The design of ICLs has been modified many times. In this study, we used the ICM V4 model.
A
DAPTIVEOPTICSVISUALSIMULATORWe used the CRX1 adaptive optics system (Imagine Eyes, Orsay, France), which comprises two basic elements: a wavefront sensor and a correcting device. The system optically conjugates the exit pupil plane of the individual with the correcting device, the wavefront sensor, and an artificial pupil. The Shack-Hartmann wavefront sensor has a square array of 1024 lenslets. The wavefront aberration measu-rements are made at 850 nm. The deformable mirror is a correcting system composed of 52 independent magnetic actuators used to either partially or totally correct the aberrations up to the 5th order(17)
(18 Zernike coefficients) and to add different values of aberrations (up to 4th order). Control of the deformable mirror surface is
accom-plished by a commercially available program (HASO; Imagine Eyes), which reshapes the deformable mirror from its normally flat surface to the desired shape. The observer viewed visual tests generated on a microdisplay system through the adaptive optics system and an artificial pupil. The microdisplay system subtended a visual angle of 114 x 86 arcmin with a resolution of 800 x 600 pixels (pixel size=0.143 arcmin). The luminance conditions during the experiments were manually adjusted.
The adaptive optics system optically introduces predefined wavefront corrections using an internal closed-loop system that mo-difies the electromagnetic deformable mirror surface to the desired shape. Ideally, the adaptive optics simulator software continuously displays the residual wavefront value of the wavefront generated by the deformable mirror, compared with the wavefront defined by the examiner, to control the reliability of the system during measu-rements. The device’s software calculates the difference between the wavefront measured by the Shack-Hartmann sensor and the expected wavefront outcome; it then displays the residual wavefront correction as the RMS error at the level of the deformable mirror. The most accurate retinal images of the visual performance tests were provided by these dynamically adjusting wavefronts, which enabled the compensation of small eye decentration and aberration varia-tions due to the tear film or accommodation.
The adaptive optics system required precise alignment of the individual’s pupil with the optical axis set-up (with the wavefront sensor and the deformable mirror). The pupil’s size and position were monitored using a charge-coupled device camera. The control hand wheel of the CRX1 system enabled the pupil’s position to be main-tained with a quick, smooth, and fine adjustment.
E
XPERIMENTALPROCEDUREThe IRX3 Hartmann-Shack wavefront aberrometer (Imagine Eyes, Orsay, France), together with a custom-made wet cell, was used to de-termine the in vitro wavefront of ICL (ICL + wet cell). The aberrations of the wet cell alone were also measured and subtracted from ICL + wet cell aberrations following previously published methods(11,16,18-20).
Two ICL powers were analyzed: -3 D and -6 D. All measurements were repeated 10 times for each lens and computed for 3-mm and 5-mm pupil diameters.
Once we obtained the aberration pattern of ICLs, we measured each eye’s wavefronts using the CRX1 visual simulator. The natural pu-pil diameter was checked for each eye (≥5 mm). The pupu-pil’s size was controlled using the simulator artificial pupil. Then, CRX1 was pro-grammed to compensate for the eye’s wavefront error up to the 5th
order and the refractive error by the Basal system. In order to simulate vision in each individual that underwent ICL implantation surgery, the eye’s wavefront was measured, compensated for with the defor-mable mirror, and then the wavefront pattern of ICLs was induced by adding the wavefront pattern of the myopic eye. The same procedure was followed to simulate vision after F-LASIK, but the wavefront pattern of the laser surgery was induced. The wavefront aberration used for the patients where those obtained by Montés-Micó et al.(7) with
F-LASIK for low (-2.50 to -3.50 D) and medium (-5.50 to -6.50 D) myo-pia. Montés-Micó’s study compared F-LASIK with standard LASIK for myopia. They evaluated 100 eyes that underwent F-LASIK (mean age: 30.1 ± 5.71) and 100 eyes that underwent standard LASIK (mean age: 31.8 ± 4.22). Postoperative examinations were performed 1, 3, and 6 months after surgery; all patients completed a 6-month follow-up. Topographic data were obtained with a TMS-2N instrument (Tomey Corp., Nagoya, Japan). Corneal videokeratographic data were then digitally downloaded in ASCII files, which contained information about corneal elevation, curvature, power, and pupil position. The videokeratographic data were fitted with Zernike polynomials up to the 6th order to determine the aberration coefficients.
Figure 1 shows the Zernike coefficients of ICL implantation and the Zernike coefficients obtained with F-LASIK (aberrations after surgery - aberrations before surgery) for both pupils.
O
PTICALQUALITYEVALUATIONTo evaluate the optical quality of both procedures, we analyzed the modulation transfer function (MTF)(21) and the point spread function
We computed these metrics using a custom-made MATLAB program (Mathworks, Nantick, MA) from the wavefront data obtained with the IRX3 Hartmann-Shack sensor(22).
V
ISUALQUALITYMEASUREMENTHigh-contrast (100%), medium-contrast (50%), and low-contrast (10%) VA was measured using Freiburg Visual Acuity Test (FrACT) software(23) with a white background and luminance of 51 cd/m2.
The acuity threshold was determined using the best parameter estimation by sequential testing (PEST) method(24) based on 30
pre-sentations. It was an eight-alternative, forced-choice method. The individual’s task was to identify the Landolt-C gap position using a keypad. The VA value was determined from the average of three measurements. We followed the same methodology used by Rocha et al.(25,26) and Pérez-Vives et al.(11,16) in their studies using CRX1.
The CS was measured for three spatial frequencies: 10, 20, and 25 cycles/degree (cpd). Oriented sinusoidal gratings (0°, 45°, 90°, and 135°) were randomly generated and displayed on the microdisplay using a 4-alternative, forced-choice method. A modified best PEST method based on 30 presentations was used to determine the contrast thresholds. Each individual was asked to indicate the gra-ting orientation by pressing the appropriate button on a numerical keypad. Three CS measurements were performed at each spatial frequency and the average was recorded.
D
ATAANALYSISStudent’s t-test for unpaired data was used to compare different surgical procedures regarding VA and CS. Results are presented as the mean ± SD and the statistical significance was set at p values of <0.05.
RESULTS
O
PTICALQUALITYFigure 1 shows the Zernike coefficients expressed as the root mean square (RMS) for -3-D and -6-D ICL implantation and F-LASIK at 3-m and 5-mm pupil diameters. The ICL implantation induced fewer aberrations than LASIK, especially when it increased the refractive error and pupil diameter. We found statistically significant differences in spherical aberration between the two procedures for -3-D and -6-D for both pupil diameters (p<0.05).
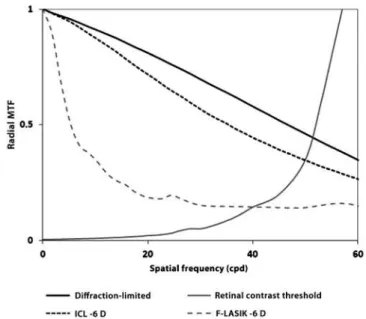
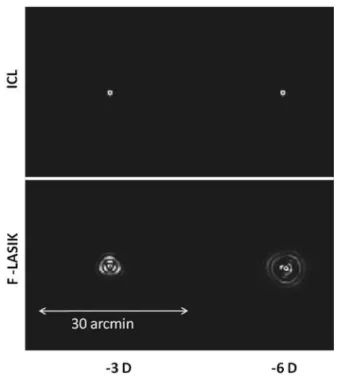
Figure 2 shows the normalized MTF for ICL implantation and F-LASIK for -6 D with a 5-mm pupil. ICL-MTF was near the diffraction- limited MTF, but F-LASIK-MTF was worse and deviated away from both curves. Note that differences between MTFs come from the higher-order aberrations (HOAs) effect that decreases the eye’s opti-cal quality. Figure 2 also sho ws the retinal contrast threshold curve at a retinal illuminance of 500 td. Figure 3 shows the images of PSF for ICL implantation and F-LASIK for -3-D and -6-D with a 5-mm pupil. When compared with ICL implantation, we observed a broad range of PSFs corresponding to F-LASIK for both -3-D and -6-D.
V
ISUALQUALITYFigures 4 and 5 show VA for the -3-D and -6-D ICL implantation and F-LASIK at 3-mm and 5-mm pupil diameters, respectively. For both pupil diameters, we found statistically significant differences between the procedures at -3 D and -6 D and all contrast evaluated (p<0.05), thus showing better VA values for ICL implantation.
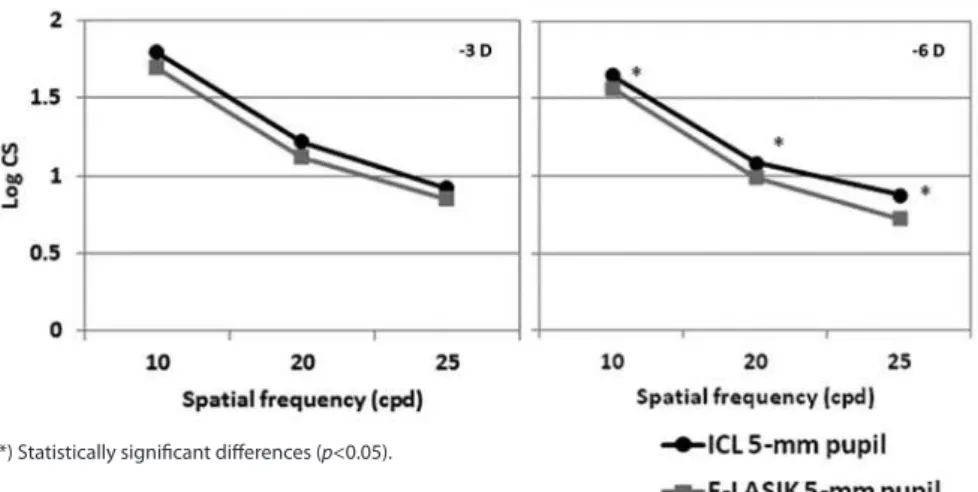
Figures 6 and 7 show the mean log10 CS values for the -3 D and -6 D ICL implantation and F-LASIK for 3-mm and 5-mm-diameter pupils, respectively. For both pupil diameters, no statistically significant differences were found between procedures at -3 D for any spatial frequency (p>0.05). In contrast, we found statistical significant diffe-rences between both procedures at -6 D for both pupil diameters and all spatial frequencies (p<0.05). ICL implantation showed better outcomes than F-LASIK.
DISCUSSION
O
PTICALQUALITYWe found statistically significant differences in spherical aberra-tion between the procedures (Figure 1). This difference was due to increases in LASIK HOAs, especially spherical aberration, during laser ablation in the central cornea(27). In contrast, ICL implantation does
not require surgical tissue ablation and leaves the central cornea untouched; therefore, it produces significantly lower HOAs than
Figure 1. Zernike coeicients expressed in root mean square (RMS) of ICL implantation (black bars) and RMS provoked by femtosecond laser in situ keratomileusis (F-LASIK; gray bars) for 3-mm (top images) and 5-mm pupils (bottom images).
LASIK and offers a better retinal image quality(28). However, an ICL
im plantation may induce HOAs after its implantation by the innate optical properties of the lens (i.e., spherical aberration increases with ICL power) or by the incision type performed during the surgical pro-cedure(29). Despite that F-LASIK induces less HOAs than mechanical
microkeratome LASIK(5), these values are higher than those found in
patients who underwent ICL implantation for myopia(28).
MTF shows how the optical system transmitted spatial frequen-cies. The loss of high frequencies indicates a loss of information regarding the details of an object, thus decreasing the image quality and VA. For -6-D, F-LASIK-MTF was worse than ICL-MTF, which was close to the diffraction-limited MTF, and therefore provides a better optical quality (Figure 2). These results agree with the calculated RMS values of the Zernike coefficients and PSF images (Figure 3). The PSF
images after F-LASIK were worse than those after ICL implantation for both -3 D and -6 D. Note in the F-LASIK PSF images that the increase in spherical aberration is nicely illustrated.
Sarver et al.(28) compared the image quality following LASIK and
ICL implantation performed to correct high myopia. They found higher HOAs after LASIK than after ICL implantation. They represented the two-dimensional PSFs and observed the PSFs corresponding to the LASIK aberration values were more spread out than the ICL aberration values. These findings are in agreement with our findings in which we found more HOAs after F-LASIK than after ICL implantation (note the spread of the PSFs shown in Figure 3). Uozato et al.(30) obtained MTFs
for different myopic ICL powers using a model eye at various pupil diameters. The outcomes reported by these authors for the -5-D ICL model with a 5-mm pupil were quite similar with those obtained in
Figure 3. Point spread function (PSF) for a 5-mm pupil for -3 D and -6 D with ICL implanta-tion (top images) and femtosecond laser in situ keratomileusis (F-LASIK) (bottom images).
Figure 4. Visual acuity (VA) logMAR and fraction Snellen at high (100%), medium (50%), and low (10%) contrast, with ICL implantation (black bars) and femtosecond laser in situ keratomileusis (F-LASIK) (gray bars) for-3 D and -6 D and a 3-mm pupil. Errors bars represent the standard deviation (SD).
Figure 5. Visual acuity (VA) logMAR and fraction Snellen at high (100%), medium (50%), and low (10%) contrast, with ICL implantation (black bars) and femtosecond laser in situ keratomileusis (F-LASIK) (gray bars) for -3 D and -6 D and a 5-mm pupil. Errors bars represent the standard deviation (SD).
Figure 6. Mean log contrast sensitivities (CS) at three spatial frequencies: 10, 20, and 25 cycles/degree (cpd) for -3 D and -6 D and a 3-mm pupil with ICL implantation (black points) and femtosecond laser in situ keratomileusis (F-LASIK) (gray squares). Error bars have been omitted for clarity.
Figure 7. Mean log contrast sensitivities (CS) at three spatial frequencies: 10, 20, and 25 cycles/degree (cpd) for -3 D and -6 D with ICL implantation (black points) and femtosecond laser in situ keratomileusis (F-LASIK) (gray squares) with a 5-mm pupil. Error bars have been omitted for clarity.
(*) Statistically signiicant diferences (p<0.05).
our study. Pérez-Vives et al.(16) recently compared optical and visual
quality after ICL implantation and LASIK using an adaptive optics simulator. They found better MTF and PSF images after ICL implanta-tion than after LASIK. They concluded that these outcomes were due to LASIK producing larger HOAs.
V
ISUALQUALITYWith a 3-mm pupil, VA values were sufficient for both procedures, achieving values above 20/20 at high and medium contrasts for -3 D and -6 D (Figure 4). At low contrast, VA decreased for both treatments. We found statistically significant differences between ICL implanta-tion and F-LASIK for -3 D and -6 D at all contrasts evaluated (p<0.05). For ICL implantation with a 5-mm pupil, VA values for -3 D and -6 D were above 20/20 at high and medium contrasts and above 20/40 for low contrast (Figure 5). These values decreased for F-LASIK, which had VA values for both powers below 20/20 at high and medium contrasts and below 20/40 for low contrast. We found statistically significant differences between both procedures for -3 D and -6 D and all contrasts evaluated (p<0.05). In all cases, VA values were better after ICL implantation than after F-LASIK.
Several studies compared mechanical microkeratome LASIK and ICL treatments(13-16). These studies were in agreement that the eyes
that underwent ICL implantation had the best spectacle correction visual acuity (BSCVA) and uncorrected visual acuity (UCVA) compa-red with eyes that underwent LASIK. Sanders et al.(13) compared the
outcomes after LASIK and ICL treatments in eyes between -8 and -12 D of myopia. One year after surgery, 90% ICL patients showed 20/20 or better BSCVA, in contrast 82% LASIK patients showed these VA values. With regard to UCVA, ICL patients also showed a large percentage of eyes with 20/20 or better UCVA (36% LASIK and 52% ICL). More recently, Sanders obtained similar outcomes(15) by
compa-ring ICL implantation and LASIK for myopia of -3.00 to -7.88 D. After 6 months, Sanders found better results in the ICL group: 85% patients in the LASIK group and 95% in the ICL group obtained a BSCVA ≥20/20. Pérez-Vives et al.(16) compared optical and visual quality after ICL
implantation and LASIK for -3 D and -6 D using an adaptive optics visual simulation. Regarding VA values, they found better outcomes after ICL implantation: 100% eyes had 20/20 or better VA for both ICL powers. In contrast, with LASIK, they found 91.6% and 83.3% eyes with 20/20 or better VA values for -3 D and -6 D, respectively. Despite that we compared ICL implantation with F-LASIK, our findings agree with those reported by those studies, as we found better optical and visual quality outcomes with ICL implantation than those found with F-LASIK. With ICL implantation, VA was 20/20 or better in 100% eyes for -3 D and 93.3% eyes for -6 D. In contrast, with F-LASIK, VA was 20/20 or better in 91.6% eyes for -3 D and 86.6% eyes for -6 D.
Regarding CS outcomes, CS values were good after ICL implanta-tion and F-LASIK (Figures 6 and 7). For -3 D, we found no statistically significant differences between surgeries at any spatial frequency and for both 3-mm and 5-mm pupils (p>0.05). In contrast, for -6 D, the effect of the aberrations was apparent by finding statistically signifi-cant differences for both pupils and all spatial frequencies evaluated (p<0.05). In all cases, CS values were better with ICL implantation than with F-LASIK. Pérez-Vives et al.(16) also evaluated CS values in
their comparison study between ICL implantation and LASIK; their outcomes are in agreement with those obtained in the present study.
Although F-LASIK induces fewer aberrations than microkeratome LASIK(5), the differences in VA and CS between the techniques are
minimal when we compare our results with other studies that used microkeratome instead of the femtosecond laser(13-16). However, some
studies(7) reported statistically significant differences in CS between
the techniques at high frequencies.
The visual optics simulator allows us to compare the impact of different surgical techniques on visual quality in the same patient before surgery. In this study, we did not considered factors regarding the surgeon, lens decentrations, or postoperative changes(31), which
may affect the visual outcomes of ICL.
In summary, ICL implantation and F- LASIK provide good optical and visual quality, although ICL provides better outcomes than F-LASIK for MTF, PSF, VA, and CS, especially for higher refractive errors and pupil sizes. These outcomes are due to F-LASIK producing larger HOAs than ICL implantation.
REFERENCES
1. Vogel A, Günther T, Asiyo-Vogel M, Birngruber R. Factors determining the refractive effects of intrastromal photorefractive keratectomy with the picoseconds laser. J Cataract Refract Surg. 1997;23(9):1301-10.
2. Kurtz RM, Horvath C, Liu HH, Krueger RR, Juhasz T. Lamellar refractive surgery with scanned intrastromal picosecond and femtosecond laser pulses in animal eyes. J Refract Surg. 1998;14(5):541-8.
3. Juhasz T, Loesel FH, Kurtz RM, Horvath C, Bille JF, Mourou G. Corneal refractive surgery with femtosecond lasers. IEEE J Selected Topics Quantum Electron. 1999;5(4):902-10. 4. Ratkay-Taub I, Juhasz T, Horvath C, Suarez C, Kiss K, Ferincz I, Kurtz R. Ultra-short pulse (femtosecond) laser surgery: initial use in LASIK flap creation. Ophthalmol Clin North Am. 2001;14(2):347-55.
5. Zhang ZH, Jin HY, Suo Y, Patel SV, Montés-Micó R, Manche EE, Xu X. Femtosecond laser versus mechanical microkeratome laser in situ keratomileusis for myopia: Me-taanalysis of randomized controlled trials. J Cataract Refract Surg. 2011;37(12):2151-9. 6. Montés-Micó R, Rodríguez-Galiero A, Alió JL. Contrast sensitivity after LASIK flap cre-ation with femtosecond laser and mechanical microkeratome. J Refract Surg. 2007; 23(2):188-92.
7. Montés-Micó R, Rodríguez-Galiero A, Alió JL. Femtosecond laser versus mechanical ke ratome LASIK for myopia. Ophthalmology. 2007;114(1):62-8.
8. Sanders DR, Vukich JA, Doney K, Gaston M; Implantable Contact Lens in Treatment of Myopia Study Group. U.S. Food and Drug Administration clinical trial of the implanta-ble contact lens for moderate to high myopia. Ophthalmology. 2003;110(2):255-66. 9. Sanders DR, Doney K, Poco M; ICL in Treatment of Myopia Study Group. United States
Food and Drug Administration clinical trial of the Implantable Collamer Lens (ICL) for moderate to high myopia; three-year follow up. Ophthalmology. 2004;111(9):1683-92. 10. Alfonso JF, Baamonde B, Fernández-Vega L, Fernandes P, González-Méijome JM,
Montés-Micó R. Posterior chamber collagen copolymer phakic intraocular lenses to correct myopia: Five-year follow-up. J Cataract Refract Surg. 2011;37(5):873-80. 11. Pérez-Vives C, Ferrer-Blasco T, Domínguez-Vicent A, García-Lázaro S, Montés-Micó R.
Optical and visual quality of the visian implantable collamer lens using an adaptive-optics visual simulator. Am J Ophthalmol. 2013;155(3):499-507.
12. Pérez-Vives C, Domínguez-Vicent A, Ferrer-Blasco T, Pons AM, Montés-Micó R. Optical quality of the visian implantable collamer lens for different refractive powers. Graefes Arch Clin Exp Ophthalmol. 2013;251(5):1423-9.
13. Sanders DR, Vukich JA. Comparison of implantable contact lens and laser assisted in situ keratomileusis for moderate to high myopia. Cornea. 2003;22(4):324-31. 14. Sanders DR, Vukich JA. Comparison of implantable collamer lens (ICL) and laser-assisted
in situ keratomileusis (LASIK) for low myopia. Cornea. 2006;25(10):1139-46. 15. Sanders DR. Matched population comparison of the Visian implantable collamer lens and
standard LASIK for myopia of -3.00 to -7.88 diopters. J Refract Surg. 2007;23(6): 537-53. 16. Pérez-Vives C, Dominguez-Vicent A, García-Lázaro S, Ferrer-Blasco T, Montés-Micó R.
Optical and visual quality comparison of implantable Collamer lens and laser in situ keratomileusis for myopia using an adaptive optics visual simulator. Eur J Ophthal-mol. 2012, Jul 30; DOI:10.5301/ejo.5000188.
17. Fernandez EJ, Vabre L, Hermann B, Unterhuber A, Povazay B, Drexler W. Adaptive optics with a magnetic deformable mirror: applications in the human eye. Optics Express. 2006;14(20):8900-17.
18. Madrid-Costa D, Ruiz-Alcocer J, Pérez-Vives C, Ferrer-Blasco T, López-Gil N, Montés-Micó R. Visual simulation through different intraocular lenses using adaptive optics: effect of tilt and decentration. J Cataract Refract Surg. 2012;38(6):947-58.
19. Madrid-Costa D, Pérez-Vives C, Ruiz-Alcocer J, Albarrán-Diego C, Montés-Micó R. Visual simulation through different intraocular lenses in patients with previous myopic cor neal ablation using adaptive optics: impact of tilt and decentration. J Cataract Refract Surg. 2012;38(5):774-86.
20. Ruiz-Alcocer J, Pérez-Vives C, Madrid-Costa D, López-Gil N, Montés-Micó R. Effect of simulated IOL tilt and decentration on spherical aberration after hyperopic LASIK for different intraocular lenses. J Refract Surg. 2012;28(5):327-34.
21. Meeteren AV. Calculations on the optical modulation transfer function of the human eye for white light. Opt Acta. 1974;21:395-412.
22. Marsack JD, Thibos LN, Applegate RA. Metrics of optical quality derived from wave aberrations predict visual performance. Journal of Vision. 2004;4(4):322-8. 23. Bach M. The “Freiburg Visual Acuity Test”- automatic measurement of visual acuity.
Optom Vis Sci. 1996;73(1):49-53.
24. Lieberman HR, Pentland AP. Microcomputer-based estimation of psychophysical threshol-ds: the best PEST. Behavior Research Methods & Instrumentation. 1982;14(1):21-5. 25. Rocha KM, Vabre L, Harms F, Chateau N, Krueger RR. Effects of Zernike wavefront
aber-rations on visual acuity measured using electromagnetic adaptive optics technology. J Refract Surg. 2007;23(9):953-9.
27. Gatinel D, Adam PA, Chaabouni S, et al. Comparison of corneal and total ocular aber-ra tions before and after myopic LASIK. J Refaber-ract Surg. 2010;26(5):333-40.
28. Sarver EJ, Sanders DR, Vukich JA. Image quality in myopic eyes corrected with laser in situ keratomileusis and phakic intraocular lens. J Refract Surg. 2003;19(4):397-404. 29. Kim SW, Yang H, Yoon G, et al. Higher-order aberration changes after implantable
collamer lens implantation for myopia. Am J Ophthalmol. 2011;151(4):653-62.
30. Uozato H, Shimizu K, Kawamorita T, Ohmoto F. Modulation transfer function of intrao-cular collamer lens with a central artificial hole. Graefes Arch Clin Exp Ophthalmol. 2011; 249(7):1081-5.
31. Fernandes P, González-Méijome JM, Madrid-Costa D, Ferrer-Blasco T, Jorge J, Montés-Micó R. Implantable collamer posterior chamber intraocular lenses: a review of potential complications. J Refract Surg. 2011;27(10):765-76.