Assessment of the degree of contamination
of rat germ cell preparations using
specific cDNA probes
Centre for Reproductive Biology, Obstetric and Gynaecology Department, University of Edinburgh, Edinburgh EH3 9EW, UK
R.F. Savaris
Abstract
Recent reports showing a decrease in sperm count in men have brought new concerns about male infertility. Animal models have been widely used to provide some relevant information about the human male gamete, and extrapolations are made to men and to the clinical context. The present study assesses one of the methods used for separation of germ cells of the adult rat testis, namely centrifugal elutriation followed by density gradients (Percoll®). This method was chosen since it presents the best results for cell purity in separating germ cells from the rat testis. A comparison between continuous and discontinuous Percoll® gradients was performed in order to identify the best type of gradient to separate the cells. Maximal cell purity was obtained for spermatocytes (81 ± 8.2%, mean ± SEM) and spermatids (84 ± 2.6%) using centrifugal elutriation followed by continuous Percoll® gradients. A significant difference in purity was observed between elongating spermatids harvested from continuous Percoll® gradients and from discontinuous gradients. Molecular analysis was used to assess cell contamination by employing specific probes, namely transition protein 2 (TP2), mitochondrial cytochrome C oxi-dase II (COX II), and sulfated glycoprotein 1 (SGP1). Molecular analysis of the samples demonstrated that morphological criteria are efficient in characterizing the main composition of the cell suspen-sion, but are not reliable for identifying minimal contamination from other cells. Reliable cell purity data should be established using molecular analysis.
Correspondence R.F. Savaris Rua Reis Louzada, 33 90630-130 Porto Alegre, RS Brasil
E-mail: [email protected]
Research supported by CNPq (No. 201210/93-2).
Received May 14, 1996 Accepted January 13, 1997
Key words
•Rat testis
•Germ cell separation
•Percoll®
•Molecular analysis
•Transition protein 2 (TP2)
•Mitochondrial cytochrome C oxidase II (COX II)
•Sulfated glycoprotein 1(SGP1)
Introduction
Many hypotheses for the various pro-cesses leading to conception in vivo are ex-trapolated from studies on other eutherian mammals. The methods used in animal mod-els have to be under constant revision and development due to limitations that should not be overlooked. The highest purity of germ cells described in the literature was obtained by Meistrich et al. (1) who used a
combination of mechanical and trypsin meth-ods, centrifugal elutriation, and further sepa-ration on continuous Percoll® gradients. As a
result, 96% of early spermatids, 98% of pachytene spermatocytes, and 98% of cytoplasts were obtained.
fol-lowed by centrifugal elutriation and a further step of Percoll® purification). Transitional
protein 2 (TP2), mitochondrial cytochrome C oxidase II (COX II), and sulfated glyco-protein 1 (SGP1) are cDNA (complemen-tary DNA) probes which recognize mRNA encoding specific proteins expressed in dif-ferent germ cells. TP2 is only present in elongating spermatids (steps 7-13) (2). SGP1 is a specific marker for rat Sertoli cells (3). COX II is present in mitochondria of all germ cells and Sertoli cells, but its highest expression occurs in pachytene spermato-cytes (4). These cDNA probes were em-ployed to determine the purity of samples stained with Periodic Acid Schiff and hema-toxylin (PAS + H), and viewed under the light microscope. Labeling of extracted mRNA with a 32P cDNA probe was detected
using a PhosphorImager and the data were analyzed using computer software, thus re-ducing subjective bias.
The molecular approach for assessing contamination of germ cell preparations is novel and should be more rigorous than morphological identification which has been used routinely in the literature.
Material and Methods
Material for enzymatic digestion for elutriation and Percoll® separation
The material for enzymatic digestion of the testis was prepared as previously de-scribed (5).
Preparation of the cell suspension
Eight adult male Wistar rats weighing 350-550 g and aged 90-180 days were used for each experiment. The rats were killed by CO2 asphyxiation and cervical dislocation.
The abdomen was washed with 70% ethanol and the testes were dissected out, decapsu-lated, chopped up into 2-mm3 pieces, and
divided into two equal parts. Each part was
placed in a different 50-ml Falcon tube (Becton Dickinson & Co., Lincoln Park, NJ) containing 15 ml of enzyme solution A, and the tubes were incubated for 30 min at 37oC
in a shaking water bath at 100 strokes per min. Following the first enzymatic digestion, 15 ml of dissection medium was added. The tubes were inverted 20 times with rotational motion and centrifuged for 1 min at 150 g in an Omnispin R centrifuge (Sorvall Instru-ments, DuPont Company Biotechnology Systems, Chandler Wilmington, DE). The supernatant containing interstitial cells was removed and discarded. Enzyme solution B was added to the pelleted tubules (7.5 ml of enzyme solution B), and the pellet was re-suspended and incubated for an additional 30 min at 37oC in a shaking water bath at 100
strokes per min. Following the second enzy-matic digestion, a further 10 ml of dissection medium was added to the suspensions. The tubule suspensions were filtered through a double 60-µm nylon gauze mesh, and pelleted at 150 g for 10 min at room temperature (22oC) in an Omnispin R. The supernatant
was discarded, and the pellet was resus-pended in 1 ml of dissection medium and aspirated with a 20-ml syringe.
Separation by centrifugal elutriation
A suspension of approximately 2 x 10⁹
cells was loaded onto a JE-6B elutriator rotor (Beckman Instruments Inc., Palo Alto, CA). The conditions used to optimize both purity and yield of cells according to the diameter of the tubes used in the present study are as outlined below:
Fraction Rotor speed Flow rate Pump Cell size
(rpm) (ml/min) setting (µm)
Load 3000 20 1.2 <6.5
1 2500 25 2.0 <10
2 2000 25 2.0 <14
3 2000 40 3.2 <16
4 0 70 6.0 >16
were pelleted in elutriation medium at 150 g
for 10 min in an Omnispin R.
Percoll® gradients were performed in both
a continuous and discontinuous manner. The continuous gradients were performed in a Gradient Former (model 395, BIO-RAD Laboratories, Inc., Milan, Italy). The first chamber was filled only with dissection me-dium at a density of 1.007 g/ml. The other chamber was filled with diluted Percoll®
(Pharmacia, Uppsala, Sweden, No. 225334, density of 1.134 g/ml). A density of 1.084 g/ ml was obtained with 25 ml of Percoll®, 1 ml
1 mM HEPES (Gibco BRL-Life Technolo-gies Ltd., Paisley, Scotland), and 15 ml of dissection medium. A 40-ml continuous lin-ear gradient was poured into a 50-ml Falcon tube. For the discontinuous gradients, the different densities were obtained by diluting Percoll® with dissection medium and 1 mM
HEPES (25:1). The gradients formed had four steps for the load fraction (1.084, 1.043, 1.031, 1.019 g/ml) and three for the other fractions from the elutriation (1.084, 1.043, 1.019 g/ml). These gradients were designed to separate the spermatids and pachytene spermatocytes based on the buoyant density of these cells as described in the literature (1).
The pelleted cell fractions from the cen-trifugal elutriator were gently layered above the gradients using a plastic Pasteur pipette. The cells were centrifuged at 1470 g for 30 min at room temperature in an Omnispin R. The bands formed in the continuous gra-dients were collected as follows. The second and third bands from the top of the gradient were collected from the load gradients and in the other fractions the band formed in the middle of the gradient was aspirated. In the discontinuous gradients, the band at a den-sity of 1.043 g/ml was collected. These frac-tions were removed using a Pasteur pipette. The top part of the gradient was removed until the desired band was reached. An un-used Pasteur pipette was un-used to aspirate the band. Special care was taken to avoid
con-tamination from different fractions in the continuous gradients. The purified fractions were washed from Percoll® by diluting them
with four volumes of 1 x PBS (Sigma Chem-ical Co., Poole, Dorset, UK) (1:4) in a 14-ml Falcon tube and pelleted at 150 g for 5 min. Only 1 ml, containing the pelleted cells, was left in the bottom of the tube.
Slide preparation and staining
The slides were pretreated with 3-aminopropyltriethoxy silane (Sigma) in ac-etone (Sigma) (2% w/v) in order to make the cells adhere to them. A drop of 1-4 µl (ap-proximately 50,000 cells counted in a hemocytometer) from each fraction was laid upon the slide, spread and allowed to air dry for 2 to 4 min. The slides were incubated in Bouin’s fluid for 10 min and the cells stained with PAS + H according to established meth-ods (6,7).
Cell identification
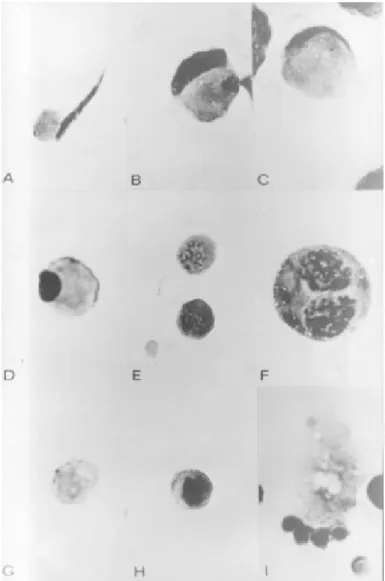
The cells were identified according to their morphology based on cell size and nuclear appearance and by the presence of the acrosome. The classical description of Meistrich et al. (8) adapted by Platz and Grimes Jr. (9), and the photomicrography of histological sections from rat testis described by Hess (10) were used as a reference for cell identification. Figure 1 shows photomicro-graphs of some of the germ cells. The criteria used for cell identification in smears was as follows:
Spermatogonia (Figure 1H).The nucleus of these cells was variable in size and con-tained deeply scon-tained chromatin. The nucleus was surrounded by a thin rim of cytoplasm.
was deeply stained with woolly masses of chromatin. The nucleus of pachytene sper-matocytes(Figure 1E) was large and con-tained separate clumps or thick strands of chromatin corresponding to the chromo-somes. The cytoplasm was more abundant than in previous stages and increased pro-portionally in subsequent stages. The sec-ondary spermatocyteswere identified by the presence of dusty and fine chromatin inside the nucleus. The cytoplasm was also abun-dant. Divisions of primary to secondary sper-matocytes were often seen.
Spermatids (Figure 1A-D). These cells were identified by their nuclear shape and cytoplasmic/nuclear ratio higher than 1. The classical division of the steps from 1 to 19 given by Meistrich et al. (8) was not used here. Instead, the classification adopted was early and late spermatids. Early spermatids (Figure 1D) were characterized by abundant cytoplasm with a small and deeply stained nucleus. In preparations of good quality, the Golgi zone and the acrosomic system could be seen. The early spermatids were equiva-lent to steps 1 to 8 of spermiogenesis. Late spermatids (Figure 1A-C) were determined by the discrete amounts of cytoplasm and by the dark stained and elongated nucleus. The amount of cytoplasm attached to the nucleus was a small conical droplet of about 30% or less of the area of the full complement at the base of the nucleus. The late spermatids were equivalent to steps 9 to 19 of spermio-genesis.
Sertoli cells (Figure 1I). These cells were characterized by the presence of an irregular and elongated cytoplasm and the large nucleus contained a fine pale-staining chro-matin and were often seen attached to other cells or in clumps.
Cytoplasmic fragments and residual bod-ies (Figure 1G). Pale-stained cytoplasmic fragments without any nucleus were seen and identified as residual bodies. Large frag-ments with late spermatid nuclei were iden-tified as Sertoli cell cytoplasm.
The slides were coded randomly and ex-amined by an experienced cytologist for cell identification. Four fields at 400X magnifi-cation were counted. Following this proce-dure, cell counts were performed by an op-erator who did not know the results obtained by the previous cytologist. The results were then compared to check the ability for cell recognition.
RNA extraction
Total RNA was extracted from pools of
cells prepared by the techniques described above, using RNAzol® B (CINNA/
BIOTECX Laboratories Inc., Houston, TX). The methodology followed was a slight modi-fication of the manufacturer instructions. Briefly, the maximum volume of RNAzol®
B added to the sample was 5 ml. The cells were lysed by vortexing. RNA was sepa-rated by electrophoresis according to stan-dard methods (11) on gels containing 2.7% (w/v) SeaKem GTG agarose (FMC BioProducts, Rockland, ME), 0.66 M form-aldehyde (Sigma), 9.8% (w/v) 10 x running buffer (final concentration containing 200 mM MOPS, 10 mM EDTA and 50 mM sodium acetate, pH 7.0). RNA separated on a denaturing gel was transferred by capillary blotting onto Hybond N membranes (Amersham, Buckinghamshire, UK) using 20 x saline-sodium citrate [20 x SSC (3 M NaCl, 0.3 M Na citrate, pH 7.0)] and fixed with ultraviolet light.
Northern blot analysis
Double-stranded DNA for labeling was usually prepared by amplification of the cloned cDNA insert from a plasmid vector using polymerase chain reaction (PCR) (12) according to methods described elsewhere (13). Three probes were used: TP2, SGP1 and COX II. The double-stranded DNA probes were radiolabeled with 30 µCi of radioisotope [α32P]dCTP (Amersham) by the
random primer method (14) using a Random Primed DNA labeling kit (Boehringer, Mannheim, Germany) according to manu-facturer instructions.
Membranes were prehybridized at 65oC
for 3 h in buffer solution containing 0.05% (w/v) bovine serum albumin Fraction V (Sigma), 0.05% (w/v) polyvinylpyrrolidone (PVP) (Sigma), 0.05% (w/v) Ficoll®
(Pharmacia), 0.1% (w/v) sodium dodecyl-sulfate (SDS) (Sigma), 0.1% sodium pyro-phosphate (Sigma), and 5 x SSC (from a 20 x SSC stock solution). The radiolabeled probe
was added to the hybridization mixture at a final concentration of 1 x 10⁶ cpm/ml buffer.
Hybridization was allowed to continue for 18 h. In the next stage, the membranes were washed with 1 x SSC at 65oC for 2 x 30 min
and exposed to a PhosphorImager (Molecu-lar Dynamics, Sunny Vale, CA) in order to measure the signal. The membranes were also placed in autoradiography cassettes with DuPont® enhancing screens and exposed to
X-OMAT AR-5 Film or X-OMAT LS X-ray film (Kodak Co., Cambridge, UK) at -70oC
for 1 h to 12 h.
Membrane hybridization for labeled oligonucleotides
Antisense oligonucleotides for 18S ribo-somal RNA (14) were used to check for the balanced transfer of RNA by Northern blot. Oligonucleotides (17-24 mers) were synthe-sized according to methods described else-where (13). Following hybridization and de-tection of the signals from the labeled double-stranded DNA, the membranes were washed with solution containing 40 mM sodium phos-phate, pH 7.2, 1 mM EDTA and 1% (w/v) SDS at 65oC for 2 x 30 min. The membranes
were checked in the PhosphorImager to con-firm the removal of the radiolabeled probe and then prehybridized with SSC plus Denhardt’s solution for oligonucleotide probes at 65oC for 4 h. The oligonucleotide
probe (18S) was labeled with [γ32P]ATP
(Amersham) using 5’ end labeling with poly-nucleotide kinase (PNK, Amersham). DNA was incubated with 30 µCi [γ32P]ATP in a
reaction mixture containing 50 ng DNA, 1 x kinase buffer (10 x buffer contains 0.5 M Tris-HCl, 0.1 M MgCl2, 50 mM DTT, 1 mM
spermidine and 1 mM EDTA) and 8 U T4 PNK. The reaction was allowed to continue for 30 min at 37oC in a dry block heater. The
radiolabeled probe was mixed with the prehybridized membrane and incubated for 18 h at 65oC in a rotational oven (Hybaid).
at 65oC for 1 h, and exposed again to the
PhosphorImager for analysis of the quantity of sample and to X-ray film according to the technique described above. The specific sig-nal from the three probes was divided by the signal from the 18S. The result was consid-ered to be the adjusted signal and plotted according to the sample.
Statistical analysis
The existence of a difference between continuous and discontinuous Percoll®
gra-dients was tested. Data are reported as mean ± SEM. All experiments were performed in triplicate and the t-test was used for statisti-cal analysis. P<0.05 was considered to be significant.
Results
Cytological analysis
Eight rats were killed and their testes were divided into two groups to be used in continuous or discontinuous gradients. Cell dispersion was performed simultaneously for each treatment. The samples were subjected to centrifugal elutriation following cell dis-persion and five fractions were collected. From these, fraction 2 was discarded and further purification was performed using Percoll® gradients. The continuous gradient
was composed of a linear density of 1.007 to 1.084 g/ml, while the discontinuous one con-sisted of three or four steps of densities ranging from 1.084 g/ml to 1.043 g/ml, 1.031 g/ml and 1.019 g/ml.
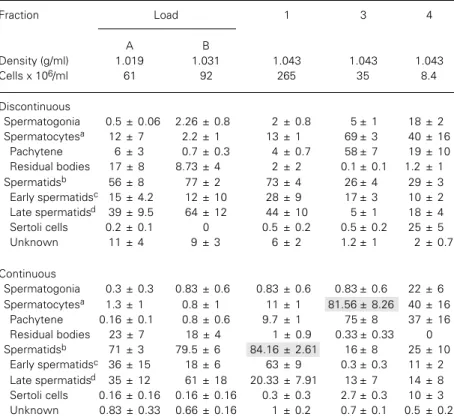
The mean values for each aggregate frac-tion of germ cells (i.e., spermatogonia, sper-matocytes, spermatids and Sertoli cells) in the specific Percoll® fractions are reported
in Table 1. The data in Table 1 show that the highest purity was obtained for spermatids (from step 1~19) (84 ± 2.6%) from fraction 1 of continuous Percoll® gradient, and for
sper-matocytes (81 ± 8.2%) from fraction 3 of continuous Percoll® gradient. A significant
difference was found when early spermatids were harvested from continuous Percoll®
gradients from the cell fraction originating from fraction 1 of centrifugal elutriation. No other significant difference between the meth-ods of continuous and discontinuous Percoll®
gradients was observed. Thecontamination of Sertoli cells was zero or less than 1% in many fractions, except for fraction 4 where 25 ± 5% was obtained.
The highest purity of germ cells (96% for spermatocytes and 89% for spermatids) was obtained from the first experiment using con-tinuous Percoll® gradients.
Molecular analysis of the samples
The results in Tables 2 and 3 show that in
Table 1 -Comparison of discontinuous and continuous gradients for the separation of rat testis cells.
Data are reported as mean ± SEM (N = 3). Shaded data indicate the most homogeneous cell populations. aIncludes all the stages of spermatocytes; bincludes all spermatids from step 1
to 19; cspermatids from step 1 to 8; dspermatids from step 9 to 19.
Fraction Load 1 3 4
A B
Density (g/ml) 1.019 1.031 1.043 1.043 1.043
Cells x 106/ml 61 92 265 35 8.4
Discontinuous
Spermatogonia 0.5 ± 0.06 2.26 ± 0.8 2 ± 0.8 5 ± 1 18 ± 2
Spermatocytesa 12 ± 7 2.2 ± 1 13 ± 1 69 ± 3 40 ± 16
Pachytene 6 ± 3 0.7 ± 0.3 4 ± 0.7 58 ± 7 19 ± 10
Residual bodies 17 ± 8 8.73 ± 4 2 ± 2 0.1 ± 0.1 1.2 ± 1
Spermatidsb 56 ± 8 77 ± 2 73 ± 4 26 ± 4 29 ± 3
Early spermatidsc 15 ± 4.2 12 ± 10 28 ± 9 17 ± 3 10 ± 2
Late spermatidsd 39 ± 9.5 64 ± 12 44 ± 10 5 ± 1 18 ± 4
Sertoli cells 0.2 ± 0.1 0 0.5 ± 0.2 0.5 ± 0.2 25 ± 5
Unknown 11 ± 4 9 ± 3 6 ± 2 1.2 ± 1 2 ± 0.7
Continuous
Spermatogonia 0.3 ± 0.3 0.83 ± 0.6 0.83 ± 0.6 0.83 ± 0.6 22 ± 6
Spermatocytesa 1.3 ± 1 0.8 ± 1 11 ± 1 81.56 ± 8.26 40 ± 16
Pachytene 0.16 ± 0.1 0.8 ± 0.6 9.7 ± 1 75 ± 8 37 ± 16
Residual bodies 23 ± 7 18 ± 4 1 ± 0.9 0.33 ± 0.33 0
Spermatidsb 71 ± 3 79.5 ± 6 84.16 ± 2.61 16 ± 8 25 ± 10
Early spermatidsc 36 ± 15 18 ± 6 63 ± 9 0.3 ± 0.3 11 ± 2
Late spermatidsd 35 ± 12 61 ± 18 20.33 ± 7.91 13 ± 7 14 ± 8
Sertoli cells 0.16 ± 0.16 0.16 ± 0.16 0.3 ± 0.3 2.7 ± 0.3 10 ± 3
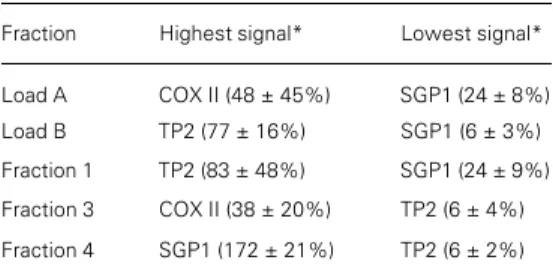
the continuous Percoll® gradient the TP2
probe (present in elongating spermatids) pre-sented highest expression in the fraction load from centrifugal elutriation collected from a density of 1.043 g/ml (load B).
COX II (present in pachytene spermato-cytes) was expressed mainly in fraction 3 from centrifugal elutriation and collected from 1.043 g/ml density in both continuous and discontinuous Percoll® gradients. SGP1
(present in Sertoli cells) showed enhanced expression in fraction 4. Here again, no sta-tistical difference was found between the continuous and discontinuous Percoll®
gra-dients.
Correlation between the cytological and molecular data
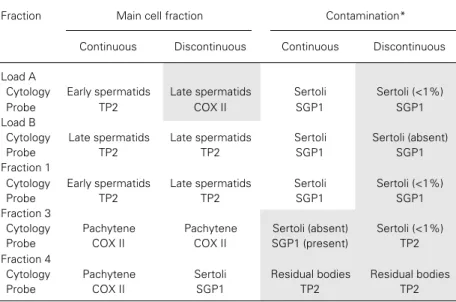
Table 4 shows the combination of cyto-logical and molecular results of each frac-tion obtained from continuous and discon-tinuous Percoll®. The main germ cell
com-position, its contamination according to the cytology, and the highest and lowest signals from the specific probes for the same frac-tions are presented in this table. Each probe corresponds to a specific type of cell as mentioned above. Briefly, TP2 is present in late (or elongating) spermatids, COX II mainly in pachytene spermatocytes, and SGP1 in Sertoli cells. Several features are apparent from this table. A correlation of the characterization of the enriched germ cell composition of each fraction using cytologi-cal analysis and the probes, except for frac-tion load A from discontinuous Percoll®,
was observed. Discrepancies between the cytological and molecular findings occurred when determining the nature of the contami-nating cells in the fractions. In the load A, 1 and 3 fractions of the discontinuous Percoll®,
the almost complete absence of Sertoli cells on the slides was not confirmed by the pres-ence of the signal of the SGP1 probe, a specific marker for Sertoli cells. These find-ings are even more striking when the results
for load B of discontinuous Percoll®
gradi-ents and fraction 3 of the continuous Percoll®
gradient are analyzed. Cytological analysis of these fractions revealed no Sertoli cells, although the signal of the SGP1 probe was present in all of them.
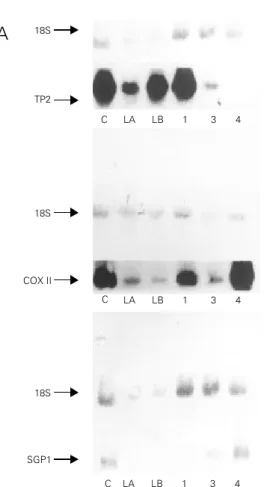
Considering the individual values of frac-tion 3 of the first continuous Percoll®
gradi-ent, for which 96% purity of spermatocytes was obtained and no Sertoli cells were visu-alized, a clear signal of the SGP1 probe (8.09 cpm of the adjusted signal) was demon-strated by molecular analysis as shown in Figure 2.
The poor reproducibility of the experi-ments is reflected by the high values of the
Table 2 - Specific probe analysis of fractions of rat testis obtained by continuous Percoll® gradients.
Data are reported as mean ± SEM (N = 3). *Percentage of the control of the adjusted signal (specific signal/ 18S). Percentages are related to the control, which was considered to be 100%. See text for details. TP2, Tran-sition protein 2; COX II, mitochondrial cytochrome C oxidase II; SGP1, sulfated glycoprotein 1.
Fraction Highest signal* Lowest signal*
Load A TP2 (35 ± 22%) SGP1 (4.9 ± 3%)
Load B TP2 (116 ± 82%) SGP1 (6 ± 3%)
Fraction 1 TP2 (83 ± 48%) SGP1 (17.9 ± 8%)
Fraction 3 COX II (257 ± 171%) TP2 (7 ± 4%)
Fraction 4 COX II (183 ± 58%) TP2 (19 ± 11%)
Table 3 - Levels of specific probes labeled with
radio-isotope ([α32P]dCTP) obtained by discontinuous
Percoll® gradients.
Data are reported as mean ± SEM (N = 3). *Percentage of the control of the adjusted signal (specific signal/ 18S). Percentages are related to the control, which was considered to be 100%. See text for details. Probe abbreviations are identified in the legend to Table 2.
Fraction Highest signal* Lowest signal*
Load A COX II (48 ± 45%) SGP1 (24 ± 8%)
Load B TP2 (77 ± 16%) SGP1 (6 ± 3%)
Fraction 1 TP2 (83 ± 48%) SGP1 (24 ± 9%)
Fraction 3 COX II (38 ± 20%) TP2 (6 ± 4%)
standard errors, mainly observed in the mo-lecular analysis (Tables 2 and 3). Although wide variance was observed, data for the same main germ cell population were con-sistent.
Discussion
Recent reports showing a decrease in sperm count in men (15,16) brought new concerns about male infertility and its phys-iology. To understand the physiology of cells and their relationship, cell purity is a para-mount issue. No definitive conclusion can be reached about a contaminated system. Methods have been developed to increase the purity of cells in order to draw reliable conclusions about a biochemical aspect of a particular cell population.
Rats have been used as an animal model for studying testicular cell biology by many investigators (17-23). Among the methods described in the literature for the separation of rat germ cells, the combination of cen-trifugal elutriation and isopycnic density
(Percoll®) has produced the highest degree
of purity of spermatogenic cells from the adult rat testis (1). This method has been used by other investigators to study molecu-lar aspects of rat germ cells (2,5) and there-fore conclusions have been made about mo-lecular and biochemical aspects of the cells, assuming that the purity of the cells was as high as described in the original study.
The present study was carried out using the standard techniques employed in this department, which are based on the work of Meistrich et al. (1). The decision to use triplicates was based on previous studies in the literature in which the methods were repeated 2 to 8 times (1,18). Considering these references, triplicates seemed to be a reasonable number of replications. The ex-pectation of cell purity for spermatocytes and spermatids from the rat germ cell sus-pension was 98% using Meistrich’s method. In the first experiment, using a continuous Percoll® gradient, a result of 96% purity of
spermatocytes suggested that the method was reliable and reproducible. However, after performing the experiments in triplicate, the reproducibility was found not to be as high as expected. The second experiment using continuous Percoll® gradients obtained only
67.2% spermatocytes, a poorly enriched population. A possible reason for this dis-crepancy may be related to animal age. The animals used were adult rats aged 90 to 180 days. The 90-day old rats were used in the first experiment and older animals were used in the subsequent ones. The best results were obtained for the younger rats. Such variabil-ity for adult rats has not been reported in the literature. In fact, Meenakumari and Duraiswami (24) have worked with animals aged 8 to 30 days. Their results for separat-ing cells from rat testis with Ficoll® started to
decrease from 14-day old animals. They found an increased and steady degree of contamination in germ cell fractions (22~26%) in animals 18 days old or older. However, in the original study of Meistrich et al. (1),
Table 4 -Comparison between the results of cytological and molecular analyses of the germ cell types in each fraction of continuous and discontinuous Percoll® gradients.
Shaded areas represent inconsistency between the cytological and molecular findings. *Considered as the lowest percentage of a cell population in the cytology examination and the lowest signal from hybridization.
Fraction Main cell fraction Contamination*
Continuous Discontinuous Continuous Discontinuous
Load A
Cytology Early spermatids Late spermatids Sertoli Sertoli (<1%)
Probe TP2 COX II SGP1 SGP1
Load B
Cytology Late spermatids Late spermatids Sertoli Sertoli (absent)
Probe TP2 TP2 SGP1 SGP1
Fraction 1
Cytology Early spermatids Late spermatids Sertoli Sertoli (<1%)
Probe TP2 TP2 SGP1 SGP1
Fraction 3
Cytology Pachytene Pachytene Sertoli (absent) Sertoli (<1%)
Probe COX II COX II SGP1 (present) TP2
Fraction 4
Cytology Pachytene Sertoli Residual bodies Residual bodies
animals much older than 30 days were used. Based on these studies, the variance in adult rat age should not have been a compromis-ing variable, but this was the case in the present study. To confirm these data, an-other study comparing the degree of purity according to adult rat age should be per-formed. Furthermore, work in the literature with duplicates (18) should be viewed with caution.
In addition, some considerations about centrifugal elutriation are pertinent. It is rec-ommended that rotor speed be kept constant and flow rate variable, because the rotor speed tends to overshoot the set speed. Fur-thermore, the strobe control must then be readjusted to view the chamber at each new lower speed (25). The highest purity was obtained from fraction 3 of the centrifugal elutriator, when the rotor speed was set at 2000 rpm for fraction 2 and during the
col-lection of fraction 3. The flow rate was the only variable. This statement supports the data of Onoda et al. (26), who achieved better results by changing the settings of the centrifugal elutriation reaching more than 90% purity of pachytene spermatocytes and round spermatids, while Meistrich et al. (1) achieved only 75% and 80%, respectively.
Another possibility accounting for the difference between methods may be the har-vesting of cells from the Percoll® gradients.
The continuous gradients do not always form a sharp band, except when an almost pure population obtained from the centrifugal elutriation is achieved. This malformed band can be 1 cm high and cell collection can be problematic. However, this is a limitation of the method itself. Meistrich et al. (1) tried to overcome this problem by collecting the cells by puncturing the side of the centrifuge tubes using a greased 25 gauge needle and
aspirat-Figure 2 - Northern blot analysis of TP2, COX II and SGP1 mRNA expression in germ cell-enriched fractions. RNA samples were obtained from isolated cell frac-tions from centrifugal elutriation followed by continuous (A) and discontinuous (B) Percoll®
gradi-ents. Enriched cells suspension of spermatids (lanes LA, LB and 1), pachytene spermatocytes (lane 3) and Sertoli cells (lane 4). RNA extracted from the whole testis was used as control (C). Lane 3 of the continuous Percoll® gradient shows a SGP1
signal, demonstrating contami-nation. The image for COX II from discontinuous gradients was generated from the Phos-phorImager computer.
18S
18S
COX II
18S
SGP1
C LA LB 1 3 4
A
TP2
C LA LB 1 3 4
C LA LB 1 3 4
18S
TP2
18S
COX II
18S
SGP1
C LA LB 1 3 4
B
C LA LB 1 3 4
ing a predetermined volume. The discon-tinuous Percoll® overcomes this problem
since a sharp band is formed between the gradients. Thus, a balance between risk and benefit exists in this part of the method. On the one hand, the discontinuous gradients give a sharp band for collecting the cells, but the density is fixed, and on the other, con-tinuous gradients can give the small differ-ences in densities, but no sharp band. Small changes in cell density due to enzyme diges-tion, temperature, age of the animal or even preparation of the medium can change the final density of the gradients and cells and consequently modify the purity of the frac-tions. The working window for cell density is very narrow (1.044~1.051 g/ml), and there-fore rigorous conditions should be applied.
The continuous Percoll® gradients are
advantageous for overcoming the problems which are a result of small variations in the medium or cell density. However, sharp bands are not always obtained. According to the results obtained in this study, the use of continuous gradients seems to be recom-mended.
Sertoli cells were not observed in frac-tion 3 of continuous and discontinuous Percoll® gradients, although later molecular
analysis suggested their presence. One pos-sibility is that the cells were lost from the slides during the fixation and staining pro-cess. This loss may be responsible for an inaccurate analysis of the cell suspension from a non-representative sample. For this reason, the slides were treated with 3-aminopropyltriethoxy silane in acetone, re-ducing this possibility. Furthermore, as al-ready demonstrated mathematically in the literature (8), the loss factors are independ-ent of the actual frequencies of cell types in the sample, but are a function of the smear-ing technique. Comparison between the cell count of the smears and of the cell suspen-sion was within 20% of unity (8).
Considering cell identification, phase con-trast microscopy does not seem to be an
accurate method to identify cells when com-pared with staining methods. It is possible to identify some cells based on the cell size and nucleus. Nevertheless, some differences be-tween spermatocytes and spermatids are dif-ficult to distinguish, since the cell size is approximately the same and the nuclear con-tents are not clearly visible. In addition, pub-lications showing photomicroscopy of the purified cell suspension (20,26) using a phase contrast microscope should be viewed with caution because the nucleus cannot be seen properly and cell size is the only possible parameter for identifying the cell. Thus, cy-tological analysis of stained smears was con-sidered the method of choice for cytological cell identification since the parameters are clearer, a permanent record is obtained, and morphological cell standards are available.
Molecular analysis of the samples did not reveal uniform standard errors probably due to differences in the intensity of labeling between experiments caused by differences in the specific activity of the probes. There-fore, the results should be seen as a qualita-tive and not as a quantitaqualita-tive value. Molecu-lar analysis identifies whether the fraction was contaminated by another cell type and this is the reason why molecular analysis was used in the present study. However, molecular analysis is a very expensive method to be used for identifying the main cell com-position and should be avoided for this pur-pose. Furthermore, in the present molecular analysis only three specific probes were used, one of which (COX II) is not cell-specific, since it is more frequent in pachytene sper-matocytes but is also present in the other cells. Therefore, this probe should not be used for assessing contamination.
defining sample contamination as a single method. The use of specific probes demon-strated that fractions in which cytological analysis revealed the absence of certain cell types actually had these cells. SGP1 should be used as a gold standard to check the presence of Sertoli cell contamination in germ cell preparation. Therefore, the use of more specific techniques to define contami-nation, such as immunocytochemistry, or molecular analysis is recommended, as they reduce the bias in identifying and misinter-preting similar cells.
A multi-step method for cell separation may present good results, but may also en-hance the cen-hances of technical mistakes due to the number of steps involved. Results from previous experiments should not be taken for granted.
It is therefore possible to achieve a higher degree of purity of cell populations using the
techniques described in the present study, provided that animal age, elutriation settings and Percoll® densities are taken into
consid-eration. In order to identify sample contami-nation, the use of molecular analysis proved to be more rigorous than cytological analy-sis. In the absence of new efficient and low-cost techniques, the combination of the pres-ent methods seems to be a currpres-ent trend for pure cell preparation. Double centrifugal elutriation and double Percoll®
centrifuga-tion are variacentrifuga-tions that could be used to enhance the purity of the cells.
Acknowledgments
I would like to acknowledge Prof. John Aitken and Dr. P.T.K. Saunders for super-vising this work and for providing the mate-rial for the experiments carried out in their laboratories.
References
1. Meistrich ML, Longtin J, Brock WA,
Grimes Jr SR & Mace ML (1981). Purifica-tion of rat spermatogenic cells and prelimi-nary biochemical analysis of these cells. Biology of Reproduction, 25: 1065-1077. 2. Saunders PTK, Millar MR, Maguire SM &
Sharpe RM (1992). Stage-specific expres-sion of rat transition protein 2 mRNA and possible localization to the chromatoid body of step 7 spermatids by in situ hy-bridization using a nonradioactive ribo-probe. Molecular Reproduction and De-velopment, 33: 385-391.
3. Collard MW, Sylvester SR, Tsuruta JK & Griswold MD (1988). Biosynthesis and molecular cloning of sulphated glycopro-tein 1 secreted by rat Sertoli cells: se-quence similarity with the 70-kilodalton precursor to sulfatide/GM1 activator. Bio-chemistry, 27: 4557-4564.
4. Saunders PTK, Millar MR, West AP & Sharpe RM (1993). Mitochondrial cyto-chrome C oxidase II messenger ribo-nucleic acid is expressed in pachytene spermatocytes at high levels and in a stage-dependent manner during sper-matogenesis in the rat. Biology of Repro-duction, 48: 57-67.
5. West AP, Sharpe RM & Saunders PTK (1994). Differential regulation of cyclic a-denosine 3,5-monophosphatase (cAMP) response element-binding protein and cAMP response element modulator mes-senger ribonucleic acid transcripts by fol-licle-stimulating hormone and androgen in the adult rat testis. Biology of Repro-duction, 50: 869-881.
6. Hopwood D (1982). Fixation and fixatives. In: Bancroft JD & Stevens A (Editors), Theory and Practice of Histological Tech-niques. 2nd edn. Churchill Livingstone, New York.
7. Stevens A (1988). The haematoxylins. In: Bancroft JD & Stevens A (Editors), Theory and Practice of Histological Techniques. 2nd edn. Churchill Livingstone, New York. 8. Meistrich ML, Bruce WR & Clermont Y (1973). Cellular composition of fractions of mouse testis cells following velocity sedimentation separation. Experimental Cell Research, 79: 213-227.
9. Platz RD & Grimes Jr SR (1975). Changes in nuclear proteins of rat testis cells sepa-rated by velocity sedimentation. Journal of Biological Chemistry, 250: 5791-5800.
10. Hess RA (1990). Quantitative and qualita-tive characteristics of the stages and tran-sitions in the cycle of the rat seminiferous epithelium: Light microscopic observa-tions of perfusion-fixed and plastic-em-bedded testes. Biology of Reproduction, 43: 525-542.
11. Sambrook J, Fritsch EF & Maniatis T (1989). Molecular Cloning - A Laboratory
Manual. 2nd edn. Cold Spring Harbor
Laboratory Press, New York.
12. Saiki RK, Gelfand DH & Stoffel S (1988). Primer-directed enzymatic amplification of DNA with a thermostable DNA poly-merase. Science, 239: 487-491. 13. Maguire SH (1994). Germ cell modulation
of Sertoli cell function. Doctoral thesis, University of Edinburgh.
15. Sharpe RM & Skakkebaek NE (1993). Are oestrogens involved in falling sperm counts and disorders of the male repro-ductive tract? Lancet, 341: 1392-1395. 16. Carlsen E, Giwercman A, Keiding N &
Skakkebaek NE (1992). Evidence for de-creasing quality of semen during past 50 years. British Medical Journal, 305: 609-612.
17. Themmen APN, Blok LJ, Post M, Baarends WM, Hoogerbrugge JW, Vassart G & Grootegoed JA (1991). Follitropin receptor down-regulation in-volves a cAMP-dependent post-transcrip-tional decrease of receptor mRNA expres-sion. Molecular and Cellular Endocrinol-ogy, 78: R7-R13.
18. Grootegoed JA, Grollé-Hey AH, Rommerts FFG & van der Molen HJ (1977). Ribonucleic acid synthesis in vitro in primary spermatocytes isolated from rat testis. Biochemical Journal, 168: 23-31.
19. Grootegoed JA, Jansen R & van der Molen HJ (1986). Effect of glucose on ATP dephosphorylation in rat spermatids. Journal of Reproduction and Fertility, 77: 99-107.
20. Pelengaris SA & Moore HDM (1992). The separation of rat spermatids by a panning technique. 7th European Workshop on Molecular and Cellular Endocrinology of the Testis. London, 46.
21. Grootegoed JA, Krüger-Sewnarain BC, Jutte NHPM, Rommerts FFG & van der Molen HJ (1982). Fucosylation of glyco-proteins in rat spermatocytes and sper-matids. Gamete Research, 5: 303-315. 22. Browning JY, DAgata R & Grotjan Jr HE
(1981). Isolation of purified rat Leydig cells using continuous Percoll gradients. Endo-crinology, 109: 667-669.
23. Conn PM, Tsuruhara T, Dufau M & Catt KJ (1977). Isolation of highly purified Leydig cells by density gradient centrifu-gation. Endocrinology, 101: 639-643. 24. Meenakumari & Duraiswami S (1986). A
method for isolation of intact Sertoli cell-germ cell associations from rat seminifer-ous tubules and their further partition into Sertoli cell and germ cell fractions. Jour-nal of Biosciences, 10: 413-422. 25. Conkie D (1986). Separation of viable cells
by centrifugal elutriation. In: Freshney RI (Editor), Animal Cell Culture - A Practical Approach. IRL Press, Oxford.