821
Genetic diversity of the species
Leporinus elongatus
(Teleostei:
Characiformes) in the Canoas Complex - Paranapanema River
Juliano Vilas Boas Ramos
1, Leda Maria Koelblinger Sodré
1, Mário Luís Orsi
2and Fernanda Simões de Almeida
1Dams constructed along waterways interrupt the dispersion and migration of aquatic organisms, affecting mainly the abundance of migratory fish species. Translocation mechanisms have been constructed at dams aiming to minimize their impact on fish species migration behavior. There is little information available about the effect of the construction of dams on the genetic structure of the Neotropical migratory fish fauna. Therefore, RAPD molecular markers and microsatellites were utilized to evaluate the diversity and genetic structure of the migratory species Leporinus elongatus (piapara) in the Canoas Complex - Paranapanema River - Brazil. Ten groups were sampled in the fish ladders of the hydroelectric dam Canoas I and Canoas II during the reproductive period in three consecutive years. Both markers showed a high level of genetic diversity within these groups. The microsatellite markers demonstrated a loss of heterozygosity and a considerable level of inbreeding in the species. The genetic differentiation found among the groups with both markers utilized is within a range from low to moderate. The data obtained with the parameter of genetic diversity among the groups led to the conclusion that the groups of L. elongatus of the Canoas Complex are structured as a single population composed of sub-populations with low genetic diversity among them. The data on genetic diversity and population structure of L. elongatus are of great importance for the development of the species management and conservation programs in the Canoas Complex, which can also be utilized in aquaculture programs.
As barragens construídas ao longo de sistemas hídricos interrompem a dispersão e a migração dos organismos aquáticos, afetando principalmente a abundância das espécies de peixes migradores. Mecanismos para transposição foram construídos em barragens visando minimizar esses impactos. Poucas são as informações disponíveis sobre o efeito da construção de barragens na estrutura genética populacional da fauna neotropical de peixes migradores. Nesse contexto, marcadores moleculares RAPD e microssatélites foram utilizados para avaliar a diversidade e a estrutura genética da espécie migradora Leporinus elongatus (piapara) no Complexo Canoas - rio Paranapanema - Brasil. Dez grupos foram amostrados nas escadas para transposição de peixes das UHEs Canoas I e Canoas II durante o período reprodutivo em três anos consecutivos. Ambos os marcadores evidenciaram uma alta diversidade genética para esses grupos. Os marcadores microssatélites mostraram uma perda de heterozigosidade e uma considerável taxa de endocruzamento para a espécie. A diferenciação genética encontrada entre os grupos, com ambos os marcadores utilizados, pode ser considerada de moderada a baixa. Os dados obtidos com os parâmetros de diversidade genética entre os grupos permitiram concluir que os grupos de L. elongatus do Complexo Canoas estão estruturados como uma única população composta por sub-populações com baixa diversidade genética entre elas. Os dados obtidos sobre a diversidade genética e estrutura populacional de L. elongatus são de grande importância para o desenvolvimento de programas de manejo e conservação da espécie no Complexo Canoas, podendo também ser utilizados em programas de aqüicultura.
Key words: Dams, Fish ladder, Genetic structure, Microsatellite, RAPD.
1Universidade Estadual de Londrina, Centro de Ciências Biológicas, Departamento de Biologia Geral. Rodovia Celso Garcia Cid, PR 445,
Km 380, Campus Universitário, Caixa Postal, 6001, 86051-990 Londrina, Paraná, Brazil. [email protected] (JVBR); [email protected] (LMK); [email protected] (FSA)
2Universidade Estadual de Londrina, Centro de Ciências Biológicas, Departamento de Biologia Animal e Vegetal. Rodovia Celso Garcia Cid,
PR 445, Km 380, Campus Universitário, Caixa Postal, 6001, 86051-990 Londrina, Paraná, Brazil. [email protected]
Introduction
The majority of large rivers in the world are fragmented by dams, which alter the migration patterns of fish populations and convert free-flowing rivers into reservoirs (Jager et al., 2001; Nilsson et al., 2005). The interruption of
The Paranapanema River, an important affluent of the Parana River Basin, has undergone strong human intervention in the last 50 years with the construction of 11 hydroelecric dams forming a system of reservoirs in cascade. The Canoas Complex, located upstream from the Capivara Reservoir (HEP Escola Engenharia Mackenzie), in the middle Paranapanema River, was built in 1999. It comprises two hydroelectric dams with their respective reservoirs, Canoas I and Canoas II (Fig. 1), which were the only HEPs to have fish ladders built, which started operating in November, 2000 (Duke Energy, 2003; Britto & Sirol, 2005).
The construction of mechanisms for crossing barriers in Brazilian rivers, such as fish ladders, is a mitigation measure determined by the Brazilian Federal Legislation aiming to minimize the impact of damming on the maintenance of the ichthyofauna and natural stocks. Although there is no doubt about the ability of migratory species to ascend the ladders and reach the reservoirs upstream, there are indications that the effectiveness of these mechanisms in the preservation or conservation of stocks is questionable in a scenario of dams in series (Agostinho et al., 2002; Agostinho & Gomes, 2005; Pelicice & Agostinho, 2008; Volpato et al., 2009; Makrakis et al., 2011). The reproductive strategy of Leporinus elongatus consists in ascending the larger rivers up to the locations with the physical and chemical conditions fit for spawning, passively descending these rivers, feeding close to the river mouth where they find nearby adjacent rivers and spend part of the year, from February to August, and then initiating new migrations starting in September and reproducing between the months of December and January (Godoy, 1975; Vazzoler, 1996). Due to their large size and because they undertake annual reproductive migrations in these basins, the individuals of this species are exploited by both commercial and subsistence fishing (Garavello & Britski, 2003). However, despite the great economic importance of this species, there has been a decrease in the number of individuals caught in the last years along the Parana River basin, probably due to alterations of its habitat (Martins et al., 2003).
As L. elongatus is at the same time a threatened fishing resource and a promising species to be cultivated in aquaculture, the careful selection of suitable natural stocks based on genetic criteria can offer great potential for the success of programs that target the recuperation and maintenance of the species, and offers support to aquaculture activities aiming at increasing the production of fishes (Martins et al., 2003). However, to date, there are no reported studies characterizing the genetic stocks of natural populations of L. elongatus from the Canoas Complex in the Paranapanema River. Considering the above, the molecular markers RAPD (random amplified polymorphic DNA) and microsatellites (SSR – simple sequence repeats) were utilized to investigate the genetic structure within and among ten groups of specimens of Leporinus elongatus sampled in the fish ladders from the Canoas Complex during different reproductive periods. The data obtained in this study is expected to contribute to the elaboration of management projects aimed at the conservation of the migratory species L. elongatus collected in the fish ladder
in this region of the Paranapanema River, since understanding the existing genetic diversity, as well as its distribution within populations of a particular species would be a very important initial step towards the elaboration conservation projects with greater chances of achieving the desired objectives.
Material and Methods
Sampling and DNA extraction
The ten groups of Leporinus elongatus were collected in the fish passage ladders of the HEPs Canoas I (22º 56’S 50º 31’W) (six groups) and Canoas II (22º 56’S 50º 15’W) (four groups), in the middle Paranapanema River (Fig. 1) in the period from March, 2003 to December, 2005, always respecting the spawning run period, which commences at the beginning of September of one year and ends in March of following year. The specimens were grouped according to the location and their respective date of collection (Table 1).
Muscle or the adipose fin tissue was obtained from each specimen, identified and stored at -20ºC for further DNA extraction. Most of the specimens collected were released in the same location, and some were labeled and preserved in the Museu de Zoologia, Universidade Estadual de Londrina, Brazil (voucher specimens: MZUEL 61; MZUEL 62; MZUEL 196)
DNA was extracted following the procedure described by Almeida et al. (2001). DNA concentration was determined on a DyNA Quant 200 fluorimeter (Hoeffer), and diluted to a standard DNA concentration of 5 ng/mL.
RAPD and Microsatellites markers DNA amplification
For RAPD screening, 40 decamer oligonucleotides (Operon Technologies Ltd.) were used as random primers, 10 of which were selected (OPX 4, 9 e 15; OPW 3, 5, 7, 9 e 19; OPAM 11; OPAC 10), producing a good number of amplified bands and patterns of reproducible fragments.
RAPD amplification reactions were performed in a total volume of 15 µL containing: 7.5 ng of template DNA, 0.33 µM of primer, 0.25 µM dNTP (Amersham Biosciences), 3.33 mM MgCl2, 1 U of Taq DNA Polimerase (EMBRAPA, Brazil) using the reaction buffer supplied. Control reactions containing all components except genomic DNA were run. Also, to avoid distortion of the results due to reproducibility problems (Williams et al., 1990) only reproducible patterns were included in the data analysis. According to Cooper (2000), banding patterns produced by the RAPD-PCR method are reproducible when reaction conditions are strictly controlled.
DNA amplifications were carried out on a thermal cycler (MJ Research PTC -100). The amplification protocol for RAPD consisted of 4 min at 92ºC followed by 40 cycles of 40 s a 92ºC, 1.5 min at 40ºC, and 2 min at 72ºC. The last round of amplification was followed by an additional extension at 72ºC for 5 min.
amplification conditions (concentration of the components of PCR reactions; time and temperature of the different steps in the amplification cycle), as well as the adjustments of electrophoretic analysis methodology, we selected five of these primers pairs for the Lmac 04, 06, 07, 08 and 09 loci.
Amplification reactions for microsatellite were performed in a total volume of 20 µL containing: 7.5 ng of template DNA, 0.25 µM of primer F and R (Invitrogen), 0.20 µM dNTP (Amersham Biosciences), 1.9 mM MgCl2, 1 U of Taq DNA Polimerase (EMBRAPA, Brazil) using the reaction buffer supplied. The amplification protocol consisted of 3min at 95ºC followed by30 cycles of 15s at 92ºC, 15s at Ta = 61ºC, 56ºC, 58ºC, 55ºC and 56ºC for Lmac 04, 06, 07, 08 e 09, respectively, 15 s at 72ºC, and an additional extension of 5min at 72ºC.
Electrophoresis analysis
Samples of amplification of RAPD products were assayed by electrophoresis on 1.4% agarose gels with a TBE buffer (0.89 M Tris, 0.89 M boric acid, 0.02 M EDTA, pH 8.3) diluted
1:20 (v:v), run at 3 volts/cm and stained with ethidium bromide. Agarose gel images were documented under UV light using the Kodak Electrophoresis Documentation and Analysis System (EDAS) 290. The standard Ladder 100pb (Invitrogen) was used as molecular weight marker. The RAPD marker profiles were determined by direct comparison of the amplified electrophoretic profiles of the DNA from each individual, and each band was analyzed as a binary variable (band presence or absence).
After the DNA amplification, the PCR products of microsatellite loci were fractionated on 8% polyacrylamide gels, 10 mL of each sample were loaded onto a gel and the 10pb standard Ladder Invitrogen was used as the molecular weight marker. Electrophoresis was performed in a vertical chamber and the buffer utilized was TBE buffer diluted 1:10 (v:v). Gels were run at approximately 9 volts/cm and then stained with a silver-staining protocol and digitized for further analysis.
Statistical analysis
The genetic diversity in the present study was evaluated in two categories: intra and interpopulational. The distribution of the diversity was investigated by the determination of genetic structure.
The RAPD electrophoretic profiles were transformed into binary variables (amplification or no amplification of the fragment), considering each fragment amplified as one locus. These loci were treated as a system of two alleles, with PCR (polymerase chain reaction) amplification of only one of the alleles per locus. It was also assumed that alleles of different loci did not co-migrate on a gel (Lynch & Milligan, 1994).
The data generated for both markers were inserted into ARLEQUIN 3.11 software (Excoffier et al., 2005) and various parameters were estimated to evaluate intra- and interpopulational genetic diversity.
Fig. 1. Partial view of the Parapanema River and its principal affluents (Tibagi and das Cinzas Rivers). Featured are the two collection sites: HEP Canoas I and Canoas II.
Table 1. Number of specimens analyzed in each sampling
group of Leporinus elongatus from the fish passage ladders of HEPs Canoas I and Canoas II. Start: collected from January to March; End: collected from October to December.
Location collected
Groups Canoas I Canoas II
Markers Markers
microsatellites RAPD microsatellites RAPD
Start 2003 12 12 --- ---
End 2003 16 16 30 32
Start 2004 20 20 --- ---
End 2004 30 23 30 32
Start 2005 30 23 30 23
End 2005 30 23 30 23
The following parameters were estimated with the data of the RAPD markers: (1) indices of molecular intrapopulational diversity (Nei, 1987; Tajima, 1993): proportion of polymorphic sites (PS) (number of polymorphic sites/ total number of sites), mean gene diversity between pairs of haplotypes (π) and mean gene diversity over all loci (πn); (2) AMOVA (analysis of molecular variance) and Wright’s fixation index (F) (Wright, 1951) (Excoffier et al., 1992); and (3) pair to pair FST.
The following parameters were determined for the microsatellite markers: (1) indices of diversity pattern (Nei, 1987): mean number of alleles per locus (Na), mean heterozygosity observed (Ho), and mean expected heterozygosity (He); (2) index of molecular diversity (Nei, 1987; Tajima, 1993): mean gene diversity over all loci (πn); (3) test for Hardy-Weinberg (HW) equilibrium for each locus (Guo & Thompson, 1992); (4) AMOVA and Wright’s fixation index (1951) (Excoffier et al., 1992); and (5) pair to pair FST.
Bayesian analysis was used to infer the number of populations from the genetic data provided to determine the genetic structure of the groups sampled, using the software STRUCTURE version 2.2 (Evanno et al., 2005).
Wright (1978) suggested that the FST values can be interpreted qualitatively in terms of genetic differentiation as: values from 0 to 0.05 indicating low genetic differentiation; from 0.05 to 0.15, moderate; from 0.15 to 0.25 high; and above 0.25, very high genetic differentiation. This was adopted as a reference in the interpretation of the F-statistic values obtained in the present study.
Results
RAPD markers
The ten primers utilized to obtain the RAPD markers produced 8 to 22 fragments, providing a total of 138 loci for the genetic analyses.
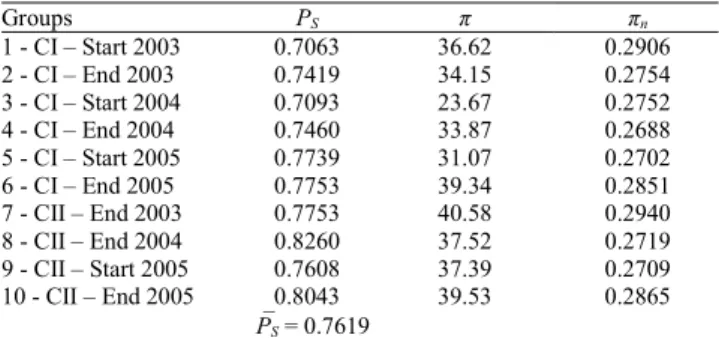
The analysis of intrapopulational genetic diversity of the groups of L. elongatus (Table 2) showed that: the proportion of polymorphic sites (PS) varied 0.706 (CI - start of 2003) to 0.826 (CII - end of 2004); the mean number of differences between the pairs of haplotypes (π) varied from 23.67 (CI -start of 2004) to 40.58 (CII - end of 2003), and mean gene diversity over all loci (πn) varied from 0.269 (CI - end of 2004) to 0.291 (CI - start of 2003).
The results obtained by AMOVA (Table 3) for the interpopulational analysis of the distribution of genetic diversity (genetic structure) of L. elongatus for the comparison test between Canoas I and Canoas II showed a
FCT (among populations) = 0.021 (P = 0.009) for the comparison among
sampling locations and FSC (among subpopulations within populations)= 0.075 (P = 0) for the comparison among groups sampled (sub-populations), where these values were statistically significant indicating the existence of genetic differentiation.
The low genetic differentiation among populations (FCT), based on the adopted criteria, led us to treat the whole population as one (Canoas I with Canoas II). In this manner, the two sampling locations were considered as a single population of L. elongatus,
and the genetic analysis can be summarized in comparisons among the groups sampled. The AMOVA results (Table 3) on the genetic structure of L. elongatus for this second test showed a global FST of 0.086 (P = 0) and estimates of FST pair to pair (Table 4) with an amplitude of variation in its values from FST = 0.033(P = 0.021) between the groups “CI end 2003” and “CI -end 2004” to FST = 0.141 (P = 0) between “CI - start of 2004” and “CII - end of 2004.” These pair-to-pair FST estimates indicate a low to moderate genetic differentiation among the ten groups, based on the criteria adopted.
Microsatellite markers
In the analyses of microsatellite loci of the groups of L. elongatus eight flanking primer pairs constructed for microsatellite loci of Leporinus macrocephalus (Lmac) with taxes of transferability of 62.5% were screened.
The analysis of intrapopulational genetic diversity with microsatellite markers (Table 5) showed a mean a number of alleles from 11 (CI - start of 2003) to 17 (CII - end of 2005) and mean gene diversity over all loci (πn) from 0.76 (CI - start of 2004) to 0.88 (CI - start of 2003). The mean heterozygosity observed varied from0.61 (CI - end of 2005 and CII - end of
Table 2. Intrapopulational genetic diversity based on RAPD
markers for the groups of Leporinus elongatus from the fish passage ladders of HEPs Canoas I and Canoas II -Paranapanema River. PS: proportion of polymorphic sites;PS: mean proportion of polymorphic sites; π mean gene diversity between pairs of haplotypes; πn mean gene diversity over all loci. Start: collected from January to March; End: collected from October to December.
Groups PS π πn
1 - CI – Start 2003 0.7063 36.62 0.2906
2 - CI – End 2003 0.7419 34.15 0.2754
3 - CI – Start 2004 0.7093 23.67 0.2752
4 - CI – End 2004 0.7460 33.87 0.2688
5 - CI – Start 2005 0.7739 31.07 0.2702
6 - CI – End 2005 0.7753 39.34 0.2851
7 - CII – End 2003 0.7753 40.58 0.2940
8 - CII – End 2004 0.8260 37.52 0.2719
9 - CII – Start 2005 0.7608 37.39 0.2709
10 - CII – End 2005 0.8043 39.53 0.2865
⎯PS = 0.7619
Table 3. Fixation index obtained by AMOVA for markers, RAPD and microsatellites, for the groups of Leporinus elongatus from the fish passage ladders of HEPs Canoas I and Canoas II-Paranapanema River. * = Statistically significant value to 5%.
CI x CII
RAPD Microsatellites
FCT (among populations) 0.021 0.014
P-value 0.009* 0.004*
FSC (among sub-populations within populations) 0.075 0.020
P-value 0* 0*
Population of Canoas
FST 0.086 0.028
P-value 0* 0*
FIS --- 0.24
2004) to 0.73 (CII - end of 2003), where the values obtained for mean expected heterozygosity were higher than those observed. The estimates of the coefficient of inbreeding of each group (from FIS = 0.16 “CII - end of 2003” to FIS = 0.32 for “Canoas I - end of 2005”) reflect the lower values estimated for the mean heterozygosity observed.
The loci analyzed were not in Hardy-Weinberg equilibrium (Table 6), except for the loci Lmac 04 in the group “CI - end of 2003,” and Lmac 06 and Lmac 08 in the groups “CI - start of 2003” and “CI - end of 2003”.
The interpopulational analysis of the genetic structure of L. elongatus, obtained from AMOVA (Table 3), revealed results with statistically significant values in both comparison among sampling locations (FCT (among populations) = 0,014; P = 0,004) and the comparison among groups sampled (FSC (among sub-populations within
populations) = 0,020; P = 0). In addition, AMOVA revealed the
existence of a FST = 0.028 and FIS = 0.24 (P = 0). The results of the pair to pair FST analysis among the 10 groups showed genetic differentiation, moderate toward low (from FST = 0. 061 between “CI - end of 2004” and “CII - end of 2005” to FST =
0.002 between “CII - end of 2003” and “CII - end of 2005”) (Table 7), confirming the FST obtained in Table 3.
The results obtained by the program Structure agree with the other, revealing a value of K =1 for both markers, meaning that these groups are sampled parts of the same general population of L. elongatus. The value of K is more plausible with the highest probability of a given K (Ln (P) D) and lower standard deviation (Fig. 2).
Discussion
Studies of the genetic diversity of various species of fishes have been conducted with different classes of molecular markers. The different levels of variability among the classes of markers reflect equilibrium between mutation rates and genetic drift. The mutation rates for microsatellite markers are estimated to be between 10-3 and 10-4 per locus per generation,
while for RAPD markers these rates are intermediate compared to those for microsatellites and isoenzymes (10-6 to 10-9 per
locus per generation) (Lougheed et al., 2000). Preserving the particular characteristics of each marker, comparisons can be carried out between the genetic diversity found here for L. elongatus with that found in other studies on this species.
Intrapopulational analysis showed that the groups of L. elongatus sampled exhibit high indices of genetic variability. This was seen from the genetic parameters estimated with the utilization of RAPD as well as from those with microsatellites. DeWoody & Avise (2000) observed the mean levels of genetic variation given by Ho at microsatellite loci for freshwater fishes (0.54 ± 0.25). For L. elongatus, a potamodromous migratory species that lives in freshwater and makes reproductive migrations within this same environment, the estimated value is compatible with the authors’ estimates for freshwater fish species in general, and for those migratory fishes that are anadromonous. Utilizing RAPD markers, Chiari & Sodré (2001), determined a proportion of polymorphic loci of 67.4% for L. elongatus from the lower Tibagi River, a value of similar magnitude compared to that shown in the present work. Martins et al. (2003) utilizing mitochondrial markers, studied populations of this same species in different rivers of the Paraná basin and found high indices of genetic diversity.
Comparisons of the results obtained for the groups of Leporinus elongatus with studies of other migratory species also collected in the fish ladders from the Canoas Complex showed that this species possesses levels of genetic diversity comparable to those of Prochilodus lineatus, also carried out with RAPD and microsatellites (P = 74% and Ho = 0.66; Paula 2006), greater than those obtained with RAPD markers in studies with Leporinus friderici (P = 62.5%; Ashikaga, 2008) and with Salminus brasiliensis (P = 42 %; Lopes et al., 2007).
In accordance with Markert et al. (2004), the reduction in heterozygosity can be harmful due to the loss of allelic diversity. In the long term, the consequence of this event for the population would be the loss of their capacity to adapt to changes in environmental conditions. Therefore, the apparent
Table 4. FST pair to pair, based on RAPD markers, between groups of Leporinus elongatus from the fish passage ladders of HEPs Canoas I (1 - 6) and Canoas II (7 - 10) - Paranapanema River. * Statistically significant value to 5%.
1 2 3 4 5 6 7 8 9 10
1 0
2 0.040* 0
3 0.068* 0.050* 0
4 0.062* 0.033* 0.070* 0
5 0.115* 0.110* 0.100* 0.100* 0
6 0.062* 0.050* 0.076* 0.050* 0.070* 0 7 0.062* 0.075* 0.080* 0.090* 0.080* 0.060* 0 8 0.103* 0.102* 0.141* 0.083* 0.108* 0.080* 0.074* 0 9 0.107* 0.111* 0.133* 0.110* 0.104* 0.070* 0.050* 0.092* 0 10 0.117* 0.105* 0.137* 0.095* 0.100* 0.062* 0.100* 0.075* 0.090* 0
Table 5. Index of intrapopulational genetic diversity obtained based on microsatellite marker for the groups of Leporinus elongatus from the fish passage ladders of HEPs Canoas I and Canoas II- Paranapanema River. Na: mean number of alleles per locus; Ho: mean heterozygosity observed; He: mean heterozygosity expected; H: total heterozygosity; h: total mean heterozygosity expected; πn: mean gene diversity over all loci; FIS: Fixation index intrapopulational; * Statistically significant value to 5%. Start: collected from January to March; End: collected from October to December.
Groups Na ⎯Ho ⎯He πn FIS
CI – Start 2003 11 0.70 0.88 0.88 0.22*
CI – End 2003 11.2 0.68 0.88 0.84 0.21*
CI – Start 2004 13.8 0.63 0.90 0.76 0.24*
CI – End 2004 15.8 0.67 0.88 0.79 0.20*
CI – Start 2005 16 0.66 0.91 0.83 0.25*
CI – End 2005 16.8 0.61 0.90 0.86 0.32*
CII – End 2003 16 0.73 0.89 0.82 0.16*
CII – End 2004 16.4 0.61 0.87 0.79 0.26*
CII – Start 2005 15.8 0.63 0.87 0.79 0.26*
CII – End 2005 17 0.63 0.87 0.85 0.27*
scenario for the groups of L. elongatus of the Canoas Complex is that of the existence of high genetic diversity, which is positive for the species. However, the deficit of heterozygotes, the loss of allelic diversity (many alleles per locus, the majority at low frequency), and the degree of inbreeding found (FIS above 0.16 and all statistically significant) indicate that the maintenance of this degree of genetic variability and consequently of the species L. elongatus in the Canoas Complex is worrisome. Recent studies showed that the depression due to inbreeding can affect the demographic rates of a population and increase the probability of extinction. However, in many cases, the changes in demographic rates that control the decline in population come from habitat degradation or mortality caused by humans, being later worsened by genetic factors (Miller & Waits, 2003; Laroche & Durand 2004).
The data obtained by interpopulational analysis and those
of the genetic structure showed, with both markers, the existence of a low genetic differentiation between the sampling locations besides a low to moderate differentiation among the groups sampled, based on the scale proposed by Wright (1978). Despite being statistically significant, this low genetic differentiation found among the locations sampled evidence that the groups sampled in the ladders from the Canoas Complex originated from a single population of L. elongatus, which would be composed of sub-populations, a fact confirmed by the moderate to low degree of genetic differentiation found among the ten groups of L. elongatus sampled, and the delta K= 1 obtained by the program Structure with the two markers used. For approximately 23 years, there was a free stretch of approximately 80 km between the Capivara and Salto Grande HEP (Fig. 1), most of which was lotic, isolated from the rest of the Paranapanema River due to the absence of mechanisms of
Table 6. Test of genetic equilibrium (H.W.E.) for the five microsatellite loci for the groups of Leporinus elongatus from the fish passage ladders of HEPs Canoas I and Canoas II- Paranapanema River. * Statistically significant value to 5%.
CI - Start 2003 CI - End 2003 CI - Start 2004
Loci Ho He P- Value Ho He P- Value Ho He P- Value
Lmac 04 0.75 0.96 0.02986* 0.73 0.91 0.06579 0.70 0.92 0.01282*
Lmac 06 0.92 0.89 0.42368 0.62 0.84 0.11006 0.68 0.88 0.00030*
Lmac 07 0.67 0.88 0.03439* 0.69 0.87 0.00000* 0.65 0.89 0.00000*
Lmac 08 0.75 0.95 0.05903 0.80 0.92 0.17733 0.67 0.95 0.00162*
Lmac 09 0.42 0.76 0.01699 0.56 0.86 0.00125* 0.44 0.85 0.00000*
CI - End 2004 CI - Start 2005 CI - End 2005
Lmac 04 0.90 0.94 0.00200* 0.70 0.94 0.00026* 0.53 0.91 0.00000*
Lmac 06 0.86 0.91 0.01065* 0.57 0.91 0.00000* 0.63 0.85 0.00003*
Lmac 07 0.6 0.88 0.00000* 0.83 0.89 0.00055* 0.59 0.91 0.00000*
Lmac 08 0.79 0.96 0.00000* 0.65 0.95 0.00000* 0.79 0.97 0.00000*
Lmac 09 0.21 0.71 0.00000* 0.53 0.87 0.00000* 0.50 0.87 0.00000*
CII - End 2003 CII - End 2004
Loci Ho He P- Value Ho He P- Value
Lmac 04 0.77 0.93 0.00000* 0.67 0.92 0.00000*
Lmac 06 0.63 0.88 0.00003* 0.82 0.91 0.00011*
Lmac 07 0.72 0.84 0.00000* 0.72 0.74 0.00005*
Lmac 08 0.88 0.96 0.00009* 0.65 0.96 0.00000*
Lmac 09 0.63 0.85 0.00008* 0.18 0.81 0.00000*
CII - Start 2005 CII - End 2005
Lmac 04 0.63 0.93 0.00000* 0.63 0.95 0.00000*
Lmac 06 0.71 0.91 0.00000* 0.62 0.91 0.00000*
Lmac 07 0.64 0.79 0.00002* 0.70 0.77 0.00003*
Lmac 08 0.69 0.92 0.00002* 0.73 0.95 0.00000*
Lmac 09 0.47 0.82 0.00000* 0.48 0.79 0.00013*
Fig. 2. Mean values of Ln(P)D of Leporinus elongatus from the fish passage ladders of HEPs Canoas I and Canoas II - Paranapanema
fish translocation. In 1998, two new dams (Canoas I and Canoas II) were built in this stretch, forming the Canoas Complex, thus notably reducing the extent of free flow between Capivara HEP and Salto Grande HEP (Duke Energy, 2003; Britto & Sirol, 2005). As a compensatory measure for blocking the migratory route of species of fishes, ladders were installed at both dams of the Canoas Complex, and put into operation in 2000 (Britto & Sirol, 2005). An issue that arose during the work was pertinent to the origin of the specimens captured within the Canoas Complex, which formed the ten groups analyzed. The information obtained from the literature, together with the genetic findings of this study, make clear that the ten groups captured in the fish ladders of the Canoas Complex, are samplings of specimens originating from the Capivara Reservoir, that is, this reservoir harbor is the source of reproducer populations that migrate annually.
Britto & Sirol (2005) sampled the species of fish that were ascending the ladders from the Canoas Complex during four reproductive periods (2000 to 2004) soon after the start of operation of these mechanisms. In their studies, they found a decrease in the number of species and individuals captured and in biomass in the course of the period examined. For example, in the second summer after the start of operation (2001-2002), a lower number of migratory fishes ascending the ladders were observed, whereas fishery catches in the Capivara Reservoir decreased. In the following summers, the number and biomass of fish continued to decline in both ladders (Britto & Sirol, 2005). After the ladders were opened, stocks from the Capivara Reservoir are likely leaving the region and performing a one-way upstream movement (Lopes et al., 2007). A total of 42 fish species (7 migratory) were registered in the ladders, and more than 10,000 fish were sampled ascending each facility in the reproductive season of 2001 and 2002. There is no major tributary between the Canoas I and the Salto Grande Dam; thus, populations transferred by ladders may have difficulty recruiting their young. In addition, these stocks have intensely and illegally been fished below the Salto Grande Dam. Considering that important tributaries are in the area contained by the Capivara Dam (Tibagi, Congonhas, Capivara, Cinzas, and Laranjinha Rivers), populations of migratory species have historically persisted in this area, and as the stretch above the Canoas I Dam lacks such critical habitats, it is very likely that fishes are being passed onto lower-quality environments (Pelicice & Agostinho, 2008).
According to Agostinho et al. (2011), downstream migration of fish through the ladder at Lajeado dam (middle Tocantins river -Brazil) is very limited, and according to the referred authors, their work represent the first empirical evidence that a ladder is critically deficient for downstream passage of migratory and non-migratory fishes past a hydropower dam in South America. Britto & Sirol (2005) also demonstrated the absence of capture of icthyoplanckton items (eggs, larvae, and post-larvae) and of juvenile forms of typically migratory species in the reservoirs of Canoas I and Canoas II.
The environmental characteristics of the stretch of the Paranapanema River where the Canoas Complex is located and the ecological characteristics of L. elongatus, together with
the data obtained by Britto & Sirol (2005), make it clear that the annual recruitment of L. elongatus in this stretch is being harmed by the presence of the fish ladders, because individuals are transferred annually from one environment favorable to the maintenance of the species to another known to be inadequate for this function. Aggravating the situation is the fact that the population of the Capivara Reservoir, source of the reproducer, besides not increasing annually through reproduction by those that migrate via the ladders, also loses its reproducers, since they are unable to carry out a reverse migration due to the lentic characteristics of the reservoirs and dams of Canoas I and Canoas II. This situation causes the demographic reduction of the species with genetic consequences.
We believe that the data obtained in the present study for Leporinus elongatus, from the Canoas Complex, can be utilized in the elaboration of management and conservation projects for this species in this location of the Paranapanema River. Therefore, the possible management actions should take into consideration the current situation of the species in the Canoas Complex, and be increased with constant genetic monitoring of the natural population. Moreover, the species should be cultivated in aquaculture to guarantee the introduction of restocking individuals with the genetic characteristics identified in this population of L. elongatus. Also, the disassembling of ladders in which empirical evidence points to their negative effect on fish populations and overall biodiversity should be carried out promptly.
Acknowledgments
The authors thank Dr. Oscar Akio Shibatta and the collecting staff from Duke Energy International and Universidade Estadual de Londrina, including, for the identification of the specimens. This work was financially supported by Duke Energy International, ANEEL (Agência Nacional de Energia Elétrica) and Universidade Estudual Londrina. CAPES granted a scholarship to the first author.
Literature Cited
Agostinho, A. A. & L. C. Gomes. 2005. O manejo da pesca em reservatórios da bacia do alto rio Paraná: avaliação e perspecti-vas. Pp: 23-55. In: Nogueira, M. G., R. Henry & A. Jorcin (Eds.). Ecologia de Reservatórios: Impactos potenciais, ações de manejo e sistemas em cascata, 1st ed. RiMa Editora, São Carlos, 472p.
Agostinho, A. A., E. E. Marques, C. S. Agostinho, D.A. Almeida, R. J. Oliveira & J. R. B. Melo. 2007a. Fish ladder of Lajeado Dam: migrations on one-way routes? Neotropical Ichthyology, 5: 121-130.
Agostinho, A. A., L. C. Gomes, D. R. Fernandez & H. I Suzuki. 2002. Efficiency of fish ladders for Neotropical ichthyofauna. River Research and Applications, 18: 299-306.
Agostinho, C. S., A. A. Agostinho, F. Pelicice, D. A. Almeida & E. E. Marques. 2007b. Selectivity of fish ladders: a bottleneck in Neotropical fish movement. Neotropical Ichthyology, 5: 205-213.
downstream passage through a fish ladder in a large Amazonian river. Hydrobiology, 675: 1-12.
Almeida, F. S., M. H. P. Fungaro & L. M. K. Sodré. 2001. RAPD and isoenzyme analysis of genetic variability in three allied species of catfish (Siluriformes: Pimelodidae) from the Tibagi river, Brazil. Journal of Zoology, 253:113-120.
Ashikaga, F. Y. 2008. Análise da estrutura genética de Leporinus friderici (Pisces, Characiformes) nas escadas de transposição de peixes das UHEs do Complexo Canoas - rio Paranapanema. Dissertation, Universidade Estadual de Londrina.
Britto, S. G. & R. N. Sirol. 2005. Transposição de peixes como forma de manejo: as escadas do Complexo Canoas, médio rio Paranapanema, bacia do Alto rio Paraná. Pp.285-304 In: Nogueira, M. G., R. Henry & A. Jorcin. (Eds.). Ecologia de Reservatórios: Impactos Potenciais, Ações de Manejo e Sistemas em Cascata, Rima, 459p.
Chiari, L. & L. M. K. Sodré. 2001. Study of eight species of the Anostomidae family (Pisces, Characiformes) by RAPD analysis. Acta Scientiarum: Biol Sci,23:445-451
Cooper M. L. 2000. Random amplified polymorphic DNA analysis of southern brown bandicoot (Isoodon obesulus) populations in Western Australia reveals genetic differentiation related to environmental variables. Molecular Ecology, 9: 469-479. DeWoody, J. A. & J. C. Avise. 2000. Microsatellite variation in marine,
freshwater and anadromous fishes compared with other animals. Journal of Fish Biology, 56:461-473.
Duke Energy - Geração Paranapanema 2003. Peixes do rio Paranapanema. Horizonte Geográfico, São Paulo.
Evanno, G., S. Regnaut, J. Goudet. 2005. Detecting the number of clusters of individuals using the software Structure: a simulation study. Molecular Ecology, 14: 2611-2621.
Excoffier, L. G., A. Laval & S. Schneider. 2005. Arlequin ver. 3.0: An integrated software package for population genetics data analysis. Evolutionary Bioinformatics Online, 1:47-50.
Excoffier, L. G., P. E. Smouse & J. M. Quattro. 1992. Analysis of molecular variance inferred from metric distances among DNA haplotypes: Application to human mitochondrial DNA restriction data. Genetics, 131:479-491.
Garavello, J. C. & H. A. Britski. 2003. Family Anostomidae. In: Reis, R. E., S. O. Kullander & C. J. Ferraris (Eds.). Check list of the freshwater fishes of South and Central America. EDIPUCRS, Porto Alegre, 729p.
Godoy, M. P. 1975. Subordem Characoidei. In: Godoy, M. P. (Ed.). Peixes do Brasil:bacia do rio Mogi Guassu v. III, Franciscana, Piracicaba.
Guo, S. & E. Thompson. 1992. Performing the exact test of Hardy-Weinberg proportion for multiples alleles. Biometrics, 48: 361-372. Jager, H. I., J. A. Chandler, K. B. Lepla & W. V. Winkle. 2001. A theorical study of river fragmentation by dams and its effects on white sturgeon populations. Environmental Biology of Fishes, 60: 347-361. Laroche, J. & J. D. Durand. 2004. Genetic structure of fragmented
populations of a threatened endemic percid of the Rhône river:
Zingel asper. Heredity, 92: 329-334.
Lopes, C. M., F. S. Almeida, M. L. Orsi, S. G. C. Britto, R. N. Sirol & L. M. K. Sodré. 2007. Fish passage ladders from Canoas Complex - Paranapanema River: evaluation of genetic structure maintenance of Salminus brasiliensis (Teleostei: Characiformes). Neotropical Ichthyology, 5: 131-138.
Lougheed, S. C., H. L. Gibbs, K. A. Prior & P. J. Weatherhead. 2000. A comparison of RAPD versus microsatellite DNA markers in population studies of the Massasauga rattlesnake. J Heredity, 91: 458-463.
Lynch, M. & B. G. Milligan. 1994. Analysis of population structure with RAPD markers. Molecular Ecology, 3: 91-99.
Makrakis, S., L. E. Miranda, L. C. Gomes, M. C. Makrakis & H. M. F. Junior. 2011. Ascent of neotropical migratory fish in the Itaipu reservoir fish pass. River Research and Applications, 27: 511-519. Markert, J. A., P. R. Grant, B. R. Grant, L. F. Keller, J. L. Coombs & K. Petren. 2004. Neutral locus heterozygosity, inbreeding, and survival in Darwin’s ground finches (Geospiza fortis and G. scandens). Heredity, 92: 306-315.
Martins, C., A. P. Wasko, C. Oliveira & F. Foresti. 2003. Mitochondrial DNA variation in wild population of Leporinus elongatus from the Paraná River basin. Genetics and Molecular Biology,26: 33-38. Miller, C. R. & L. P. Waits. 2003. The history of effective population size
and genetic diversity in Yellowstone grizzly (Ursus arctos): implications for conservation. PNAS (Proceedings of the National Academy of Sciences of the United State of America), 100: 4334-4339.
Morelli, K. A., E. Revaldaves, C. Oliveira & F. Foresti. 2007. Isolation and characterization of eight microsatellite loci in Leporinus macrocephalus (Characiformes: Anostomidae) and cross-species amplification. Molecular Ecology Notes, 7: 32-34.
Nei, M. 1987. Molecular evolutionary genetics. Columbia University Press, New York.
Nilsson, C., C. A. Reidy, M. Dynesius & C. Revenga. 2005. Fragmentation and flow regulation of the World’s large rivers systems. Science, 308: 405-408.
Oliveira, E. J., J. G. Pádua, M. I. Zucchi, R. Vencovsky & M. L. C. Vieira. 2006. Origin, evolution and genome distribution of microsatellites. Genetic and Molecular Biology,29: 294-307. Paula, F. M. 2006. Diversidade genética de Prochilodus lineatus
(Pisces, Characiformes) das escadas de transposição de peixes das Usinas Hidroelétricas do Complexo Canoas - rio Paranapanema. Dissertation, Universidade Estadual de Londrina.
Pelicice, F. M. & A. A. Agostinho. 2008. Fish-passage facilities as ecological traps in large Neotropical rivers. Conservation Biology, 22: 180-188.
Piorski, N. M., A. Sanches, L. F. Carvalho-Costa, T. Hatanaka, M. B. Carrillo-Avila, P. D. Freitas & P. M. Galetti Jr. 2008. Contribution of conservation genetics in assessing neotropical freshwater fish biodiversity. Brazilian Journal of Biology, 68: 1039-1050. Tajima, F. 1993. Measurement of DNA polymorphism. Pp 37-59.
In: Takahata, N., A. G. Clark (Eds.). Mechanisms of molecular evolution. Introduction to molecular paleopopulation biology. Japan Scientific Press.
Vazzoler, A. E. A. M. 1996. Biologia da Reprodução de Peixes Teleósteos:Teoria e prática. EDUEM, Maringá.
Volpato, G. L., R. E. Barreto, A. L. Marcandes, P. S. A. Moreira & M. F. B. Ferreira. 2009. Fish ladders select fish traits on migration-still a growing problem for natural fish populations. Marine and Freshwater Behaviour and Physiology, 42: 307-313.
Williams, J. G. K., A. R. Kubelik, K. L. Livak & S. V. Tingey. 1990.
DNA polimorphisms amplified by arbitrary primers are useful as genetic markers. Nucleic Acid Research,18: 6531- 6535. Wright, S. 1951. The genetical structure of populations.Annals of
Human Genetics, 15: 323-354.
Wright, S. 1978. Evolution and the genetics of populations. Variability within and among natural populations, vol 4. The University of Chicago Press, Chicago, 9-103.