Large-scale analysis of NBS domain-encoding resistance gene analogs
in Triticeae
Dhia Bouktila
1,2, Yosra Khalfallah
1, Yosra Habachi-Houimli
1, Maha Mezghani-Khemakhem
1,
Mohamed Makni
1and Hanem Makni
1,31
Unité de Recherche Génomique des Insectes Ravageurs des Cultures d’Intérêt Agronomique,
Faculté des Sciences de Tunis, Université de Tunis El Manar, El Manar, Tunis, Tunisia.
2Institut Supérieur de Biotechnologie de Béja, Université de Jendouba, Béja, Tunisia.
3Institut Supérieur de l’Animation pour la Jeunesse et la Culture, Université de Tunis, Bir-El-Bey, Tunisia.
Abstract
Proteins containing nucleotide binding sites (NBS) encoded by plant resistance genes play an important role in the response of plants to a wide array of pathogens. In this paper, anin silico search was conducted in order to identify and characterize members of NBS-encoding gene family in the tribe of Triticeae. A final dataset of 199 sequences was obtained by four search methods. Motif analysis confirmed the general structural organization of the NBS do-main in cereals, characterized by the presence of the six commonly conserved motifs: P-loop, RNBS-A, Kinase-2, Kinase-3a, RNBS-C and GLPL. We revealed the existence of 11 distinct distribution patterns of these motifs along the NBS domain. Four additional conserved motifs were shown to be significantly present in all 199 sequences. Phylogenetic analyses, based on genetic distance and parsimony, revealed a significant overlap between Triticeae sequences and Coiled coil-Nucleotide binding site-Leucine rich repeat (CNL)-type functional genes from monocoty-ledons. Furthermore, several Triticeae sequences belonged to clades containing functional homologs from non Triticeae species, which has allowed for these sequences to be functionally assigned. The findings reported, in this study, will provide a strong groundwork for the isolation of candidateR-genes in Triticeae crops and the understand-ing of their evolution.
Keywords: NBS domain, data mining, phylogeny, plant resistance genes, Triticeae. Received: January 13, 2014; Accepted: June 4, 2014.
Introduction
Triticeae are among the most important crops in the world. According to the NCBI Taxonomy database, the tribe of Triticeae belongs to the Poaceae family of grasses and to the subfamily Pooideae that includes, in addition to Triticeae, two major tribes: Poeae and Avenae. The Triticeae tribe includes several economically important
species such as common wheat (Triticum aestivum L.),
durum wheat (T. turgidum L. ssp. durum), barley
(Hordeum vulgareL.) and rye (Secale cerealeL.), in
addi-tion to about 350 other species (Löve, 1984). Within this tribe, there is a significant diversity in terms of morphol-ogy, life cycle, behaviour, reproduction, karyotype, habitat and phenotypic plasticity. Because of the tribe’s global dis-tribution, the taxonomic status of some species is some-times controversial. The susceptibility of Triticeae crops to
multiple pathogens strongly affects their productivity and quality improvement.
To struggle against attacks of bacteria, fungi, viruses and nematodes, plants have evolved a wide range of de-fence mechanisms. While some of these resistance strate-gies rely on simple physical or chemical barriers, one major mechanism is characterized by a gene-for-gene interaction that requires a plant resistance gene (R-gene) that
recog-nizes a protein expressed by a specific pathogen avirulence gene (Avr-gene). This type of specific resistance is often
as-sociated with a localized hypersensitive response in plant cells at the infection site. Sequence composition analysis of
R-genes indicates that they share high similarity and
con-tain seven different conserved domains, like NBS (nucleo-tide-binding site), LRR (leucine rich repeat), TIR (Toll/Interleukin-1 receptor), CC (coiled-coil), LZ (leucine zipper), TM (transmembrane) and STK (serine-threonine
kinase). Based on domain organization, R-gene products
can be categorized into at least five major classes
(Sanse-verino et al., 2010): CNL one (CC-NBS-LRR); TNL
(TIR-NBS-LRR); RLP (Receptor-Like Proteins); RLK www.sbg.org.br
Send correspondance to Dhia Bouktila. Unité de Recherche Géno-mique des Insectes Ravageurs des Cultures d’Intérêt Agronomi-que, Faculté des Sciences de Tunis, Université de Tunis El Manar, 2092 El Manar, Tunis, Tunisia. E-mail: [email protected].
(Receptor-Like Kinases); and the KIN class grouping pro-teins containing only a kinase domain. In addition to these well-studied fiveR-classes, many other resistance proteins
(class Others-R) have been discovered, which do not fall
within the previous classes and whose functional mecha-nisms are also usually different (Romeret al., 2007). In this
class falls, for example, theHordeum vulgareMLO protein
(Sanseverino and Ercolano, 2012) that confers resistance
against the powdery mildew caused byBlumeria graminis
(Buschgeset al., 1997). The number of cloned and
func-tionally-identifiedR-genes has been marked by a constant
growth in recent years, reaching 112 genes according to Plant Resistance Gene database (PRGdb). As a conse-quence, the classification ofR-genes has been continuously
revised, based on the modular domains present inR
-pro-teins. Recently, Sanseverino and Ercolano (2012) analysed
R-domain associations; which allowed them to distinguish
22 subfamilies, includingR-proteins that are composed of a
single domain (e.g.NBS) and those that show from two to
five domains associations (e.g.NBS-KIN; NBS-LRR-KIN;
NBS-LRR-KIN-Other; TIR-NBS-LRR-KIN-Other).
The NBS-encodingR-genes, which encode proteins
containing at least a nucleotide binding site (NBS) domain,
represent the largestR-gene family among plant genomes
(Maroneet al., 2013). Based on domain associations as
analysed in Sanseverino and Ercolano (2012), this family encompasses variable subfamily associations, such as NBS, NBS-LRR, TIR-NBS-LRR, NBS-LRR-Other, etc. The NBS domain is involved in signalling and includes several highly conserved and strictly ordered motifs such as P-loop, kinase-2 and GLPL motifs (Tan and Wu, 2012). So far, large numbers of NBS-encoding genes have been pre-dicted in different species. These numbers are permanently increasing, as new genomic sequences are produced very rapidly and annotation/re-annotation efforts are continu-ously updated. In dicotyledons, 167 such sequences are predicted to be present inArabidopsis thaliana(Yuet al.,
2014), 333 inMedicago truncatula(Ameline-Torregrosaet
al., 2008), 435 inSolanum tuberosum(Lozanoet al., 2012),
459 inVitis vinifera(Yanget al., 2008), 157 inBrassica oleracea(Yuet al., 2014), 206 inBrassica rapa(Yuet al.,
2014) and 54 inCarica papaya (Porter et al., 2009). In
monocotyledons, especially in cereals, 460 genes are rec-ognized inOryza sativaL. (Linget al., 2013), 211 in Sor-ghum bicolor (Ling et al., 2013), 197 in Brachypodium distachyon(Linget al., 2013), 106 in maize (Linget al.,
2013) and 191 inH. vulgare(International Barley Genome
Sequencing Consortium, 2012). For common hexaploid wheat no precise report is available yet in the literature, given that the recently published genome (Brenchleyet al.,
2012) has not been annotated yet. Nonetheless, we have re-cently mined and predicted roughly 1700 potential NBS-encoding sequences in the wheat genome; among which at least a third are candidate NBS genes characterized by in-tact Open Reading Frames (ORFs) (D. Bouktila, Y.
Khalfallah, Y. Habachi, M. Mezghani-Khémakhem, M. Makni and H. Makni, unpublished data). In cereals, where absence of the TIR domain has been proved (Maroneet al.,
2013),R-proteins may adopt various domain architectures,
such as NBS, CC-NBS, NBS-LRR and CC-NBS-LRR. A systematic evaluation of NBS-encoding genes is required in order to better understand the host plants responses.
Today we are witnessing a spectacular increase in the number and content of databases that store, visualize, model, compare and make usable all types of biological in-formation at different levels of organizations, depending on the nature of the data. The generation of data from biologi-cal samples (biologibiologi-cal data mining) is defined as the com-putational process of discovering patterns and extracting biological knowledge from large amounts of data (Han and Kamber, 2006). The process could be automatic, or (more usually) semi-automatic, and the patterns discovered must be meaningful. Biological data can be generated at many different levels: genomic (DNA), transcriptomic (RNA), proteomic (proteins) or metabolomic (small compounds). In addition to the well-known databases of protein
se-quences (e.g.GenBank, RefSeq Proteins, SwissProt, PIR,
etc.), transcripts resources, especially those containing Ex-pressed Sequence Tags (ESTs) data, can be of great help when mining members of a protein family, including those evidenced from transcriptional data. The Expressed Se-quence Tag (EST)-based Gene Indices (GIs) of Dana-Farber Cancer Institute (DFCI) (formerly TIGR) are gener-ated after clustering, assembly and annotation of ESTs and cDNA genes from GenBank. The process of clustering is done when more than a single sequence, are representative of the same transcript. At this point, tentative clusters (TCs) are constructed, while clusters with a single transcript are called singletons. The generation of consensus sequences for each cluster greatly reduces the time required to dis-cover genes.
Taking into account recent genomic and bioinfor-matic advances and the exponential growth of publicly available sequence data, we aimed in the present study to characterize the phylogenetic diversity and domain struc-ture of NBS domain-encoding Resistance Gene Analogs (RGAs) in Triticeae. The first step towards this end was to explore multiple Triticeae genomic resources, in order to establish a comprehensive dataset of publicly available se-quences for the NBS domain-containing RGAs. Using this dataset, we analysed conserved motifs in the NBS domains. We further studied the relationship between Triticeae NBS sequences, by performing a number of phylogenetic analy-ses.
Materials and Methods
Database mining
sequence data were mined from protein annotations in GenBank and additional data gathered from EST databases. The DFCI gene indices (formerly TIGR gene indices) were used as source of EST data. For this study, analysis was re-stricted to the NBS domain since it shows the highest de-gree of motif conservation, which greatly facilitates data-base mining, and multiple sequence alignment.
Primary search using PSI-BLAST
After checking PRGdb, we selected the core NBS of theLr21protein conferring resistance ofT. aestivumto leaf
rust (Huang et al., 2009; PRGdb accession:
PRGDB00061468; GenBank accession: ACO53397), in order to construct the initial Position Specific Scoring ma-trix (PSSM). The selected sequence comprises 176 amino acids, extending from the GSGKTTFA motif starting in po-sition 349 aa, to the RSPIAA motif ending in popo-sition 524 aa. We opted for using only the region of the core NBS to search for similar sequences by PSI-BLAST, rather than employ the entire gene sequence, due to the substantial se-quence variation outside of the core NBS (especially in the LRR domain), which would decrease effectiveness of re-search by causing spurious hits. PSI-BLAST re-searches were carried out in the non-redundant protein sequence database “nr” at NCBI GenBank (National Center for Biotechnology Information). The taxon parameter was modified to search within the Triticeae tribe (taxid:147389). The PSI-BLAST threshold parameter was established at 10-7; so as only hits with E-values below this cutoff will be considered as sig-nificant. The default matrix BLOSUM-62 was used, as it is efficient at detecting weaker protein similarities, as is the case when searching for distant NBS homologues (Du Preez, 2005). Searching was repeated until the result set
converged for an E-value cutoff of 10-7. The resulting
dataset was aligned using the MUSCLE program; and sequences not containing an intact core NBS (P-loop up to GLPL), or those lacking one or more of the 4 major conserved motifs within the core NBS (P-loop, Kinase-2, Kinase-3a and GLPLA) were removed from the dataset.
Building an HMM profile for Triticeae NBS domain
A Hidden Markov Model (HMM) contains statistical parameters in the form of two matrices, one describing the possible transitions between a different number of hidden states, and the other describing the probabilities for each hidden state. The HMMs used for describing sequence fea-tures are reduced to a subset, known as HMM profile
(Eddy, 1998). With the recent emergence of large amounts of genomic and transcriptional data, HMMs are becoming a standard tool in detecting biologically relevant signals in sequence data, being superior to PSSMs for detecting dis-tant homology (Delorenzi and Speed, 2002).
Sequences retained after the primary search using PSI-BLAST were realigned by MUSCLE and their align-ment was used for the developalign-ment of an original HMM profile specific to the Triticeae tribe, reflecting their typical core NBS. The HMM profile was performed using the “hmmbuild” application of the HMMER 3.0 software. The
resulting HMM profile was given the name
“triticeae_nbs.hmm”. The LogoMat-M software
(Schuster-Böckleret al., 2004) was used for viewing the
HMM profile developed in graphical form (logo).
Secondary searches using HMM profile
The HMM profile “triticeae_nbs.hmm” was used for a more refined search in the GenBank-nr database, of any remote NBS-type counterparts, which the PSI-BLAST could not detect by the PSSM approach. At this stage, we used the HMMER 3.0 web server to search in GenBank-nr without the need to download the database. The calibration of the research was carried out with an E-value cutoff equal to 10.
An additional HMM-based scan was performed through the barley and wheat translations of the DFCI Gene Indices database, in order to combine in an almost exhaus-tive manner, all NBS-type sequences belonging to the tribe of Triticeae. In our case, the targeted bases of interest were
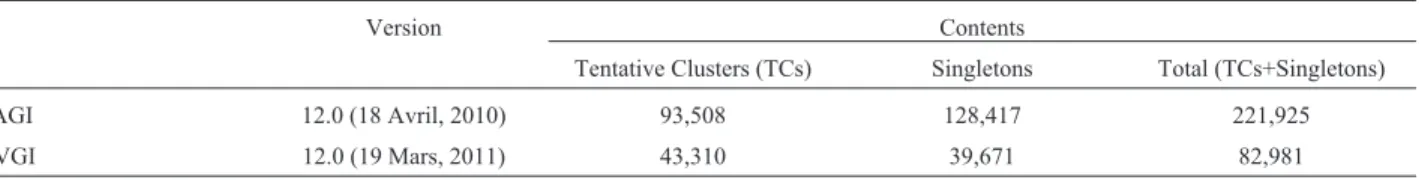
TAGI and HVGI, corresponding to T. aestivum and H.
vulgare, respectively. The latest versions TAGI 12.0 and
HVGI 12.0 were downloaded (Table 1). After down-loading, each database was separately translated in six reading frames using the software package of the European Molecular Biology Open Software Suite (EMBOSS, ver-sion 6.5.0.0), which has a variety of applications for han-dling data and biological sequences. We used the algorithm EMBOSS:SEQRET for performing a six reading frames translation of each database, then the algorithm EMBOSS:TRANSEQ for format conversion from *.pep into *.embl. Finally, the algorithm hmmsearch of HMMER 3.0 package was used to perform two searches in the trans-lated databases based on the already built HMM profile “triticeae_nbs.hmm”.
Table 1- Features of DFCI gene indices of wheat (TAGI 12.0) and barley (HVGI 12.0).
Version Contents
Data compilation and reduction
Four subsets were generated from different search techniques and databases. These subsets were PSI-BLAST/nr, HMM/nr, HMM/TAGI and HMM/HVGI. Ini-tially, each dataset was analysed separately, based on the criterion of integrity of the core NBS. Subsequently all datasets were merged and a second analysis was performed on the compilation, based on the criterion of non similarity. In fact, redundant sequences can be found even in non-redundant databases and even if they are stored in different accession numbers. They often arise from gene duplication events, ESTs derived from the same gene, post-transla-tional modifications, etc. (Cameronet al., 2007).
Identity between sequences was detected using the CD-HIT software of the CD-HIT Suite (Biological Se-quence Clustering and Comparison), which includes differ-ent programs depending on the nature of sequences (protein or nucleic acid). The clustering parameter was calibrated to 95%, which retains only the longest sequence from a cluster of sequences characterized by a degree of similarity equal to or greater than 95% at the protein level.
HMM-based alignment
Multiple alignments of the members of a multigene family are often problematic, since these sequences are both strongly conserved in core motifs of the domain, while hypervariable in regions stretching between conserved mo-tifs. For instance, in the case of the NBS-LRR gene family, a total rate of amino acid identity as low as 30% was
re-ported (Meyers et al., 1999). This complicates accurate
alignment of multiple sequences in regions stretching be-tween conserved motifs, which in turn negatively impacts motif alignment. Sequence alignment was thus performed using the HMM profile we had already built for database mining, in order to improve the alignment of conserved mo-tifs hidden in more variable regions. HMM-based align-ments are also faster and more accurate than pair-wise methods (Du Preez, 2005).
Therefore, HMM-based alignment was performed using the hmmalign algorithm, from HMMER version 3.0 package. In order to anchor the subsequent phylogenetic analysis, we included in the alignment a set of 44 core NBS
sequences belonging to referenceR-proteins (both CNLs
and TNLs). These reference proteins were extracted from the PRG database. Multiple sequence alignment was manu-ally edited for removing large indel regions using the BioEdit version 7.0.5.3 sequence alignment editor (Hall, 1999), since indel regions can create large biases in phylo-genetic results.
Motif extraction and analysis
Extraction of conserved motifs of a multigene family and visualization was performed by applying MEME (Mul-tiple Expectation Maximization for Motif Elicitation) from MEME Suite software package version 4.9.0 (Motif-based
sequence analysis tools, Bailey and Elkan, 1994). The MEME application is based on an expectation-maximi-zation algorithm which, from a set of unaligned sequences, allows extraction of conserved motifs and their visualiza-tion. As with BLAST search results, MEME hits have E-values assigned, which provides an estimation of the ex-pected number of random hits of similar significance (Meyerset al., 2003).
Assuming that the size of each eventual pattern ranges between 4 and 50 aa, a first search was set to detect a maximum of 6 motifs, while a second search was per-formed with the parameter “maximum number of pat-terns” = 10.
Phylogenetic inference
The immense size and diversity of the NBS-type gene family is a challenge to their evolutionary study that ap-pears to be very complex. For this reason, different phylo-genetic approaches should be used after a specific choice of software and settings. After undergoing manual editing with Bioedit version 7.0.5.3 (Hall, 1999), alignment of NBS sequences from Triticeae and those used for anchor-ing, was used to generate two trees.
The first tree was made based on a matrix of genetic distances, using the model of Dayhoff (Schwarz and Dayhoff, 1979). The variation rate across sites was adjusted by selecting the gamma distribution that aims to correct the variation of substitutions between different sites. Gamma value = 8 has been fixed, since the substitution pattern along positions in the NBS domain differs greatly. The tree was constructed from the distance matrix by the Neigh-bor-Joining method, with 1000 bootstrap replications and the generation of a consensus of 1000 trees provided. The second tree was obtained by the method of maximum parsi-mony, which allows reconstructing the phylogeny through a short path that minimizes the total number of evolutionary events involved in the phylogeny. For this we used 1000 bootstrap replications to generate a consensus tree. All phylogenetic analyses were performed using MEGA ver-sion 5.0 (Molecular Evolutionary Genetics Analysis, Tamuraet al., 2011).
Results
Database mining
PSI-BLAST/nr subset
Having developed the parameters of the research re-ported in the Materials and Methods section, the iterative PSI-BLAST procedure was launched using the core NBS ofT. aestivum Lr21 (ACO53397.1) (Huanget al., 2009), to
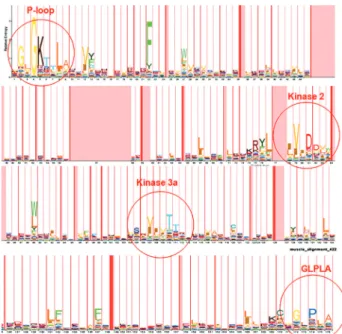
com-plete organization of core NBS were retained. These se-quences were aligned by MUSCLE. The alignment file was converted from its original msf format into Stockholm for-mat to serve as input for hmmbuild application. A 176-consensus position HMM profile was trained and called “triticeae_nbs.hmm”. This HMM profile was viewed with the LogoMat-M program, as shown in Figure 1.
HMM/nr subset
This research was carried out directly on the web, from the HMMER web server. A set of 16,044 sequences without taxonomic restriction was obtained. Sorting these sequences using the taxonomic browser available in the server site, reduced results to 3,456 sequences, belonging to Poaceae family, among which 601 sequences belonging to the Triticeae tribe. It is obvious that a number of these 601 sequences was overlapping with the result of PSI-BLAST. Thus, we performed a manual comparison between the two subsets, which allowed us to keep only 42
sequences from the new subset, of which only 10 se-quences were found to have a perfect organization for the four major core NBS motifs. Table 2 shows the output of each reduction step.
HMM/TAGI and HMM/HVGI subsets
The DFCI wheat gene indices (TAGI version 12.0) and those of barley (HVGI version 12.0) were downloaded and translated in six reading frames using the algorithm EMBOSS:TRANSEQ. The translations were then submit-ted to hmmsearch algorithm to perform a search based on the HMM profile we developed. 281 and 132 sequences were obtained from wheat and barley, respectively. These sequences were subjected to a filtration process (Table 3), leading to the retention of 34 sequences from each species, which met three criteria: non redundancy with the PSIBLAST/nr subset, non truncation (presence of the inter-val P-loop-GLPLA in whole), and non aberration (intact four major motifs of the NBS domain).
Compilation of subsets and reduction into a final dataset
The final step in the construction of the dataset was the integration of all sequences trapped during different re-search stages. These sequences were 500 (Figure 2). The dataset was reduced by filtering-out all sequences showing more than 95% identity. In most cases, such sequences would correspond to closely related paralogous or allelic sequences (Rostokset al., 2002; Madsenet al., 2003). An analysis of similarity was performed using the CD-HIT program, which resulted in a reduced dataset comprising 199 sequences, representative of the diversity of NBS do-main in Triticeae.
HMM-based alignment
A heterogeneous set of 243 sequences (199 core NBS from Triticeae, to which were added 44 core NBS from
ref-erence CNL and TNL R-proteins) was aligned using
hmmalign HMM-based local alignment tool. All indels (in-sertions-deletions) and unreliably aligned regions in multi-ple sequence alignments were removed prior to application of distance and parsimony.
Table 2- Search through the GenBank-nr protein database for Triticeae NBS sequences, using the HMMER web server based on “triticeae_nbs.hmm” profile.
Steps Description Number of sequences
Initial number Number of raw output sequences (Triticeae) 601 Discarded from dataset Redundant with PSIBLAST-derived dataset 559 Not spanning P-loop -GLPLA 27
Lacking one or more motifs (P-loop/Kinase2/Kinase3a/GLPLA)
5
Too long or too short (do not align) 0
Final number - 10
Phylogenetic analyses
General overview
In order to compare the non-redundant collection of 199 Triticeae NBS domains with reference TNLs (12) and CNLs (32), a phylogenetic analysis was performed by Neighbor-Joining (NJ) and Maximum Parsimony (MP). All branches generated by the two methods had a minimum statistical support of 50%.
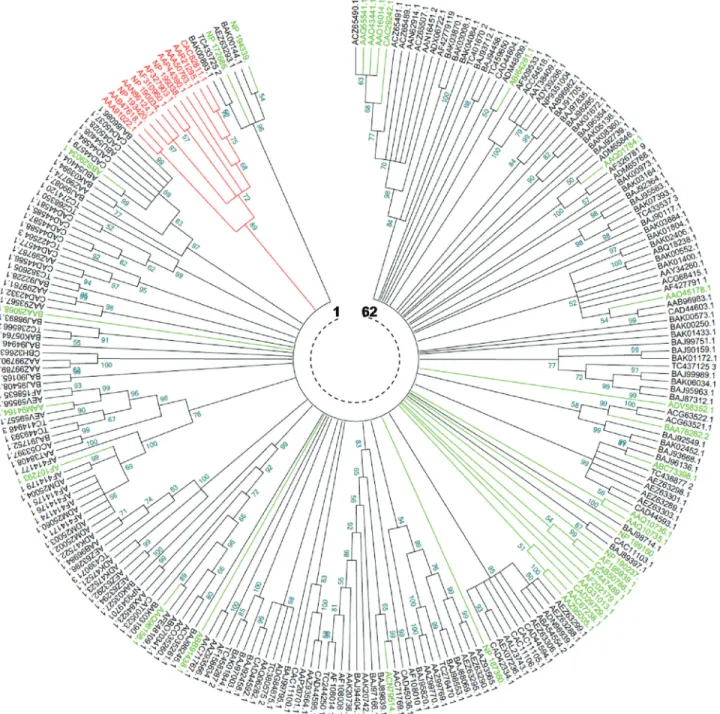
The tree generated by the NJ method (Figure 3) showed 62 clades. Twenty six clades, representing
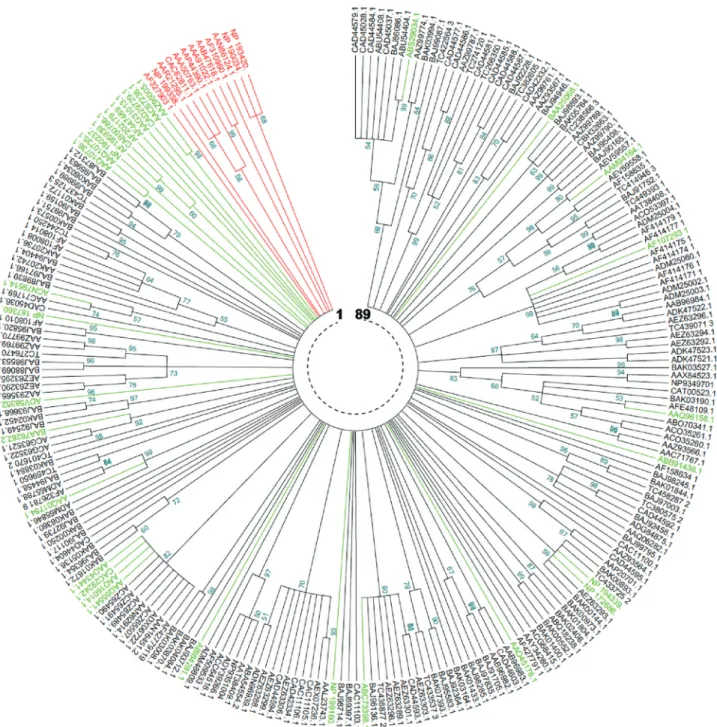
41.93%, were monophyletic. For the remaining clades (58.07%), the number of members per clade varied be-tween 2 and 20. The tree generated by the MP method (Figure 4) showed 89 clades, 46 (51.68%) of which were monophyletic, while the remaining (48.32%) had a num-ber of memnum-bers per clade varying between 2 and 11. In both NJ and MP phylogenies, reference TNLs were clearly distinguished from other core NBS CNLs. More-over, the comparison of the two phylogenies revealed a perfect identity involving some clades / superclades that were supported by both methods (Table 4).
Table 3- Search for NBS sequences through the translated DFCI gene indices ofTriticum aestivum(TAGI release 12) andHordeum vulgare(HVGI re-lease 12), based on “triticeae_nbs.hmm” HMM profile.
Steps Description Wheat sequences Barley sequences Initial number Number of raw output sequences (Triticeae) 281 132 Discarded from dataset Redundant with PSIBLAST-derived dataset 18 28
Under e-value threshold 10 97 27 Not spanning P-loop -GLPLA 55 6
Lacking one or more motifs (P-loop/Kinase2/Kinase3a/GLPLA)
77 37
Too long or too short (do not align) 0 0
Final number - 34 34
Clades containing functional homologues
Functional counterparts among reference proteins are likely to provide useful information on the functions of the Triticeae RGAs.
In the NJ tree, the 199 NBS Triticeae core NBS oc-curred in 50 clades. Among 16 reference CNLs from dicotyledone species, only two sequences fromA. thaliana
overlapped with Triticeae sequences. The remaining
se-quences either occurred in singletons or in clades including
sequences from Cucumis melo, Solanum lycopersicum,
Solanum tuberosum, Solanum bulbocastanum, Solanum demissum, Capsicum chacoenseandArabidopsis thaliana.
Unlike dicots, CNLs from monocots mostly occurred in Triticeae clades. Indeed, out of 16 CNL of monocots, 14 oc-curred in 10 of Triticeae clades. These monocots overlap-ping with Triticeae were all from cereal genomes (Aegilops
Figure 3- Neighbor-Joining phylogenetic comparison of Triticeae and non Triticeae NBS-encoding genes and RGAs. The numbers on the branches
tauschii, Hordeum vulgare, Oryza sativaJaponica Group, Oryza sativa Indica Group, Triticum aestivum and Zea mays).
In the MP tree, the 199 NBS Triticeae core NBS oc-curred in 68 clades. In a similar way to NJ tree, CNLs from dicots did not overlap with Triticeae; however, among 16 CNLs from monocots, 11 occurred in 9 Triticeae clades.
Nine reference CNLs occurred, with both phylogen-etic methods, in clades containing sequences from Triticeae, and thus could possibly provide an answer on their eventual functions. These CNLs were (i) two proteins fromA. thaliana:RPS2andRPS5, conferring resistance to
two different strains of Pseudomonas syringae; (ii) two
Oryza sativaproteins:Piz-tandPid3, conferring resistance
to two different strains of the fungusMagnaporthe grisea;
(iii) three proteins ofTriticum aestivum:Lr1andLr10both
conferring resistance to leaf rust andPm3, conferring
resis-tance to Powdery mildew; (iv) theAegilops tauschii Go35
protein, conferring resistance to the cyst nematode,
Heterodera avenae; and (v) theRp1protein, conferring rust
resistance in maize (Table 4).
Motif extraction and analysis
The unaligned dataset of 199 core NBS from Triticeae was analysed by MEME and results were ob-tained as motif summaries, with a mathematical description (E-value). Initially, setting the program for the detection of 6 patterns, has allowed the detection of the six major motifs of the NBS domain (P-loop, RNBS-A, Kinase-2, Kinase-3,
RNBS-C and GLPL), recognized by Meyerset al.(2003).
These patterns have been consistently detected in all se-quences (number of detections = 199), with E-values
rang-ing from 3.5 e-624 (for RNBS-C) to 7.7 e-1829 (for the
P-loop), indicating that the conservation of all six patterns is highly significant (Table 5). Interestingly, we have re-vealed the existence of variation in the distribution of pat-terns along each sequence. In fact, some sequences had one or more weakly significant motifs (E-value 10-4); and some
others had one or more motifs duplicated. Depending on the pattern of distribution of these six major patterns on each of the sequences studied, we identified 11 distinct profiles, which we designated I to XI (Figure 5).
In the second step, the program has been set for the possible detection of additional motifs, adjusting the num-ber of patterns to be detected to a maximum of 10. This new analysis yielded, in addition to the six standard patterns, four other motifs conserved in all 199 sequences with sig-nificant E-values (Table 5). The comparison of patterns of NBS sequences Triticeae, detected in the present study,
with those present in A. thaliana CNLs (Meyers et al.,
2003; Du Preez, 2005), has shown that the six major motifs share residues with their counterparts inArabidopsis,
un-like the four additional motifs that do not have equivalent in the latter species (Table 5).
Discussion
The agronomic importance of Triticeae makes their study at different biological scales a scientific and eco-nomic need. In particular, at the geeco-nomic level, there is a great interest to identify, characterize and classify Resis-tance Gene Analogs (RGAs), especially those that are part of the NBS domain-encoding gene family. The strategy we used in the present study consisted in querying various in-ternet resources in order to build a representative and non-redundant collection of core NBS (central part of a con-served NB-ARC domain) for the Triticeae tribe. This col-lection is characterized by an intact NBS domain and is formed from complete or fragmentary protein sequences available in the various databases. For this, we have imple-mented several mining techniques, filtration and structur-ing raw data. A final dataset was built and subjected to a series of analyses to study pattern organization and phylo-genetic structure. The primary dataset of 500 sequences was about five times larger than that reported in the Du Preez (2005) study (500vs.120). This important increment
in the number of sequences reflects the multiplication of se-Table 4- Clades and super-clades, showing identical content between Neighbor-Joining (NJ) and Maximum Parsimony (MP) phylogenies; and includ-ing functional homologues among non Triticeae species.
Clades / superclades with identical content Member(s) among reference CNLs
NJ MP
1 65 > gi|15236112|ref|NP_194339.1|disease resistance protein RPS2 [Arabidopsis thaliana] > gi 15221252 ref NP_172686.1 disease resistance protein RPS5 [Arabidopsis thaliana]
3 89 > gi|152060786|gb|ABS29034.1|Lr1 disease resistance protein [Triticum aestivum] 13 77+78 > gi|22252946|gb|AAM94164.1|go35 NBS-LRR [Aegilops tauschii]
> gi|5702196|gb|AAD47197.1 |F107293_1 rust resistance protein [Zea mays]
15 75 > gi|37624724|gb|AAQ96158.1|powdery mildew resistance protein Pm3b [Triticum aestivum] 24 19+20+21 > gi|225030802|gb|ACN79514.1|resistance protein Pid3 [Oryza sativaJaponica Group]
quencing efforts across the gDNA and cDNA. The obtained core NBS dataset was reduced to 199 representative se-quences by adopting a similarity threshold of 95%.
Analysis of protein patterns confirmed the general structural organization of the NBS domain in cereals, char-acterized by the presence of six conserved motifs identified by Meyerset al.(2003). We demonstrated the existence of
variability in the distribution patterns along each sequence. Four additional conserved motifs were shown to be
Figure 5- Identification of 11 patterns of organization for the six major motifs of the NBS domain (P-loop, RNBS-A, Kinase-2, Kinase-3 and RNBS-C
and GLPLA) in 199 Triticeae core NBS sequences, representing the diversity of core NBS in this tribe. Only motifs with an E-value of 0.0001 and that do not overlap other, more significant ones, are represented.
Table 5- Summary of motifs detected in an unaligned dataset of 199 sequences representative of the diversity of core NBS in Triticeae using MEME. Residues in theArabidopsismotifs that are identical to the Triticeae ones are indicated in red.
Motif Logo Annotation/position Significance (e-value and percentage of occurrences)
Homology (if any) toArabidopsis thalianaCNL motifs
1 P-loop 7.7e-1829 (100%) Triticeae: G[LV]GKTTLA[QR]x[VI]YNDx
A. thalianaCNL: VGIYGMGGVGKTTIARALF 2 Kinase 2 1.4e-1803 (100%) Triticeae:
L[QK][GD]KR[YF][LF][ILV]V[LI]DD[VI]WD
A. thalianaCNL: KRFLLVLDDW
3 Kinase 3a (RNBS-B) 5.6e-1431 (100%) Triticeae: xGSR[IV][IL]VTTRIxDVA
A. thalianaCNL: NGCKVLFTTRSEEVC
4 GLPLA 8.2e-1120 (100%) Triticeae: [KE]I[VAL]KK[CL][GK]G[LS]PL A. thalianaCNL: EVAKKCGGLPLALKVI
5 RNBS-A 8.5e-1072 (100%) Triticeae:
VCVSQN[FP]DVxK[LI]L[KR][DE]I[LI][ES]Q[LI]
A. thalianaCNL:
VKxGFDIVIWVVVSQEFTLKKIQQDILEK 6 RNBS-C 3.5e-624 (100%) Triticeae: DSWELFxKR[AIV]F
A. thalianaCNL: KVECLTPEEAWELFQRKV
7 Between P-loop and RNBS-A
3.6e-406 (100%) Triticeae: GHFDCRA[WF]
A. thalianaCNL:
-8 Between Kinase3a
and RNBS-C
1.2e-091 (100%) Triticeae: [YD]Q[LM]KPL
A. thalianaCNL
-9 Between RNBS-C
and GLPLA
1.6e+075 (100%) Triticeae: E[LF]EE[IV][GSA]
A. thalianaCNL:
-10 Between Kinase2 and Kinase3a
4.6e+082 (100%) Triticeae: W[ED]x[LI]Kx
-plex, and the level of complexity further increases with the number of sequences analysed. Different analyses were re-ported that were conducted on NBS domain-containing RGAs in several species of di- and monocots. Most of these analyses revealed a clustered organization. In non-cereals, Yang et al. (2013) reported a differential clustering of
TNLs and CNLs, as well as the presence of nine distinct
clusters, within 70 RGHs of cucumber. Jupeet al.(2012)
showed that 73% of NBS-LRR genes of Solanum
tuberosum are grouped into 63 clusters.
Ameline-Torre-grosa et al. (2008) reported that 80% of Medicago
truncatulaR-genes are clustered. It was also reported that
66% of 146R-genes fromA. thalianaare grouped into
clus-ters (Meyerset al., 2003). In cereals, it was shown that 76%
of RGAs inOryza sativaare located in clusters (Luoet al.,
2012), as well as 51% of those ofB. distachyon(Tan and
Wu, 2012). In the present study, 62 NJ clades and 89 MP ones were identified with a minimal statistical support of 50%. Despite this difference in numbers, a great similarity was observed between clades generated by both methods. We found that TNLs were clearly distinguished from CNLs from both Triticeae and non Triticeae. Within Triticeae clades, a high taxonomic heterogeneity was observed. This fact was expected since the orthology relationships be-tween sequences make their grouping consistent with their functions and not with their taxonomy. Phylogenetic analy-ses revealed a significant overlap between Triticeae se-quences and CNL-type functional genes from monocotyle-dons; against a low overlap between Triticeae sequences and CNL-type functional genes from dicotyledons. Those Triticeae sequences belonging to clades that contain at least a functional homolog may be potentially assigned to the function of the reference sequence. Therefore,A. thaliana
proteins RPS2 andRPS5 (for resistance toPseudononas
syringae) and rice sequencesPiz-tandPID3(for resistance
to Magnaporthe grisea) could be interesting for further
studying, since no resistance genes to these pathogens have been described, yet, in Triticeae species.
Although mostly occurring on rice, the fungus
Magnaporthe grisea(rice blast fungus) has also been
re-ported as the causal organism of wheat head blast and may induce important yield losses in wheat, barley and rye (Presteset al., 2007). In Triticeae crops, major emphasis is
often placed on the study of fungal diseases, because of the scarce reports onPseudomonas-caused ones. Nevertheless,
it has been reported that, out of almost 50 known P.
syringae pathovars, P. syringae pv. atrofaciens causes
“basal glume blotch” in wheat and barley (Toben et al.,
1991; Valencia-Botín and Cisneros-López, 2012), P.
syringaepv.syringaecauses “leaf blight” in wheat and
bar-ley (Toben et al., 1991; Valencia-Botín and
Cisneros-López, 2012),P. syringaepv.japonicacan cause blight or
striated areas on the nodes (Valencia-Botín and Cisneros-López, 2012), in addition to other Pseudomonads that are known to infect wheat, such asP. cichorii,causing stem or
shank melanosis andP. fuscovaginaethat induces a black
rot in the wheat sheath.
So far, few Triticeae NBS-encoding genes have been
functionally identified. Among these, four from T.
aestivum(Pm3, Lr1, Lr10andLr21), three fromHordeum vulgare (MLA1, MLA10 and MLA13) and a single gene
fromAegilops tauchii(Cre1). With further progress in the
wheat and barley genomes annotation and physical map-ping, comparisons will be made possible between phylo-genetic clades and chromosomal positions.
Acknowledgments
This study was supported financially by the Tunisian Ministry of Higher Education. We gratefully acknowledge Jacques-Déric ROUAULT (Laboratoire Evolution, Ge-nome et Speciation, CNRS, Gif sur Yvette, France), for providing training and Abdelkader Aïnouche (UMR-CNRS Ecobio, Universite de Rennes-1, France) for helpful discussion.
References
Ameline-Torregrosa C, Wang BB and O’Bleness MS (2008) Identification and characterization of nucleotide-binding site-leucine-rich repeat genes in the model plantMedicago truncatula. Plant Physiol 146:5-21.
Bailey TL and Elkan C (1994) Fitting a mixture model by expecta-tion maximizaexpecta-tion to discover motifs in biopolymers. Pro-ceedings of the Second International Conference on Intelli-gent Systems for Molecular Biology, AAAI Press, Menlo Park, pp 28-36.
Brenchley R, Spannagl M, Pfeifer M, Barker GL, D’Amore R, Al-len AM, McKenzie N, Kramer M, Kerhornou A, Bolser D,et al. (2012) Analysis of the bread wheat genome using whole-genome shotgun sequencing. Nature 491:705-710. Buschges R, Hollricher K, Panstruga R, Simons G, Wolter M,
Frijters A, van Daelen R, van der Lee T, Diergaarde P, Groenendijk J,et al.(1997) The barley Mlo gene: A novel control element of plant pathogen resistance. Cell 88:695-705.
Cameron M, Bernstein Y and Hugh E (2007) Clustered sequence representation for fast homology search. J Comput Biol 4:594-614.
Delorenzi M and Speed T (2002) An HMM model for coiled-coil domains and a comparison with PSSM-based predictions. Bioinformatics 18:617-625.
Du Preez FB (2005) Tracking nucleotide-binding-site-leu-cine-rich-repeat resistance gene analogues in the wheat ge-nome complex. Dissertation, University of Pretoria. Eddy SR (1998) Profile hidden Markov models. Bioinformatics
14:755-763.
Jupe F, Pritchard L, Etherington GJ, MacKenzie K, Cock PJA, Wright F, Sharma SK, Bolser D, Bryan GJ, Jones JDG,et al. (2012) Identification and localisation of the NB-LRR gene family within the potato genome. BMC Genomics 13:e75. Hall TA (1999) Bioedit: A user-friendly biological sequence
Han J and Kamber M (2006) Data Mining: Concepts and Tech-niques. 2ndedition. Morgan Kaufmann Publishers, San Fran-cisco, 696 pp.
Huang L, Brooks S, Li W, Fellers J, Nelson JC and Gill B (2009) Evolution of new disease specificity at a simple resistance locus in a crop-weed complex: Reconstitution of the Lr21 gene in wheat. Genetics 182:595-602.
International Barley Genome Sequencing Consortium (2012) A physical, genetic and functional sequence assembly of the barley genome. Nature, 491:711-716.
Ling HQ, Zhao S, Liu D, Wang J, Sun H, Zhang C, Fan H, Li D, Dong L, Tao Y,et al.(2013) Draft genome of the wheat A-genome progenitorTriticum urartu. Nature 496:87-90. Löve Á (1984) Conspectus of the Triticeae. Feddes Repertorium
95:425-521
Lozano R, Ponce O, Ramirez M, Mostajo N and Orjeda G (2012) Genome-wide identification and mapping of NBS-encoding resistance genes in Solanum tuberosum group Phureja. PLoS One 7:e34775.
Luo S, Zhang Y, Hu Q, Chen J, Li K, Lu C, Liu H, Wang W and Kuang H (2012) Dynamic nucleotide-binding site and leuci-ne-rich repeat-encoding genes in the grass family. Plant Physiol 159:197-210.
Madsen LH, Colins NC, Rakwalska M, Backes G, Sandal N, Krusell L, Jensen J, Waterman EH, Jahoor A, Ayliffe M,et al.(2003) Barley disease resistance gene analogues of the NBS-LRR class: Identification and mapping. Mol Genet Genomics 269:150-161.
Marone D, Russo MA, Laidò G, De Leonardis AM and Mastran-gelo AM (2013) Plant Nucleotide Binding Site-Leucine-Rich Repeat (NBS-LRR) genes: Active guardians in host defense responses. Int J Mol Sci 14:7302-7326.
Meyers BC, Dickerman AW, Michelmore RW, Sivaramakrishnan S, Sobral BW and Young ND (1999) Plant disease resistance genes encode members of an ancient and diverse protein family within the nucleotidebinding superfamily. Plant J 20:317-332.
Meyers BC, Kozik A, Griego A, Kuang H and Michelmore RW (2003) Genome-wide analysis of NBS-LRR-encoding genes inArabidopsis. Plant Cell 15:809-834.
Nei M and Kumar S (2000) Molecular Evolution and Phylo-genetics. Oxford University Press, New York, 333 pp. Porter BW, Paidi M, Ming R, Alam M, Nishijima WT and Zhu YJ
(2009) Genome-wide analysis ofCarica papayareveals a small NBS resistance gene family. Mol Genet Genomics 281:609-626.
Prestes AM, Arendt PF, Fernandes JMC and Scheeren PL (2007) Resistance toMagnaporthe Griseaamong Brazilian wheat genotypes. Dev Plant Breed 12:119-123.
Romer P, Hahn S, Jordan T, Strauss T, Bonas U and Lahaye T (2007) Plant pathogen recognition mediated by promoter ac-tivation of the pepper Bs3 resistance gene. Science 318:645-648.
Rostoks N, Zale J, Soule J, Brueggeman R, Druka A, Kudrna D, Steffenson B and Kleinhofs A (2002) A barley gene family homologous to the maize rust resistance gene Rp1-D. Theor Appl Genet 104:1298-1306.
Sanseverino W and Ercolano MR (2012) In silico approach to pre-dict candidate R proteins and to define their domain archi-tecture. BMC Res Notes 5:678.
Sanseverino W, Roma G, De Simone M, Faino L, Melito S, Stupka E, Frusciante L and Ercolano MR (2010) PRGdb: A bioinformatics platform for plant resistance gene analysis Nucleic Acids Res 38:D814-D821.
Schuster-Böckler B, Schultz J and Rahmann S (2004) HMM Logos for visualization of protein families. BMC Bioin-formatics 5:e7.
Schwarz R and Dayhoff M (1979) Matrices for detecting distant relationships. In: Dayhoff M (ed) Atlas of protein se-quences, National Biomedical Research Foundation, Silver Spring, Md, pp 353-58
Tamura K, Peterson D, Peterson N, Steecher G, Nei M and Kumar S (2011) MEGA: Molecular Evolutionary Genetics Analy-sis using maximum likelihood, evolutionary distance, and maximum parsimony methods. Mol Biol Evol 28:2731-2739.
Tan S and Wu S (2012) Genome-wide analysis of nucleotide-binding site disease resistance genes in Brachypodium distachyon. Comp Funct Genom 2012:418208.
Toben H, Mavridis A and Rudolph KWE (1991) On the occur-rence of basal glume root wheat and barley caused by Pseu-domonas syringaepv.atrofaciensin West Germany. J Plant Dis Prot 98:225-235.
Valencia-Botín AJ and Cisneros-López ME (2012) A review of the studies and interactions of Pseudomonas syringae pathovars on wheat. Int J Agron 2012:692350.
Yang L, Li D, Li Y, Gu X, Huang S, Garcia-Mas J and Weng Y (2013) A 1,681-locus consensus genetic map of cultivated cucumber including 67 NB-LRR resistance gene homolog and ten gene loci. BMC Plant Biol 13:e53.
Yang S, Zhang X, Yue JX, Tian D and Chen JQ (2008) Recent du-plications dominate NBS-encoding gene expansion in two woody species. Mol Genet Genomics 280:187-198. Yu J, Tehrim S, Zhang F, Tong C, Huang J, Cheng X, Dong C,
Zhou Y, Qin R, Hua W and Liu S (2014) Genome-wide comparative analysis of NBS-encoding genes between Brassicaspecies andArabidopsis thaliana. BMC Genomics 15:e3.
Internet Resources
National Center of Biotechnology Information (NCBI) Taxon-omy database, http://www.ncbi.nlm.nih.gov/taxonomy (July 20, 2013).
National Center of Biotechnology Information (NCBI) GenBank, (http://www.ncbi.nlm.nih.gov/genbank/) (February 02, 2013).
Plant Resistance Gene database (PRGdb), www.prgdb.org (De-cember 02, 2013).
The Dana-Farber Cancer Institute (DFCI) Expressed Sequence
Tag (EST)-based Gene Indices (GIs),
http://compbio.dfci.harvard.edu/tgi/ (February 18, 2013). Multiple Sequence Comparison by Log- Expectation (MUSCLE),
http://www.ebi.ac.uk/Tools/msa/muscle/ (March 17, 2013). LogoMat-M software (Schuster-Böckler et al., 2004)
http://www.sanger.ac.uk/cgi-bin/software/analy-sis/LOGOMAT-m.cgi (May 17, 2013).
HMMER 3.0 software, http://hmmer.org/ (May 29, 2013). HMMER web server,
The European Molecular Biology Open Software Suite (EMBOSS) version 6.5.0.0,
ftp://em-boss.open-bio.org/pub/EMBOSS/ (May 05, 2013). Biological Sequence Clustering and Comparison (CD-HIT Suite),
http://weizhong-lab.ucsd.edu/cdhit_suite/cgi-bin/in-dex.cgi?cmd=Server%20home (May 17, 2013).
Multiple Expectation Maximization for Motif Elicitation (MEME), http://meme.nbcr.net/meme/cgi-bin/meme.cgi (June 06, 2013).
Associate Editor: Guilherme Corrêa de Oliveira