GIS FROM A CULTURAL HERITAGE
PERSPECTIVE
When past and future collide
GIS FROM A CULTURAL HERITAGE PERSPECTIVE
When Past and Future Collide
Dissertation supervised by
Professor Doutor Pedro Cabral Professor Doutor Mário Caetano
ACKNOWLEDGMENTS
I would like to thank Professor Pedro Cabral and Professor Mário Caetano, for their indisputable support and their many hours of advising, that made this thesis possible and without which I wouldn’t have the tools to grow academically. Them, I owe the tools to progress.
Also, I would like to thank Professor Marco Paínho and Professor Peter Nijkamp, for having believed in me, and as such with their ongoing advice and friendship allow me to keep on dreaming. Them, I thank their simplicity which allow me to look further in the things I enjoy.
I wish to thank Professor João Pedro Bernardes, for giving an opportunity for a non-archaeologist to think about the past and the University of the Algarve for making the database so flexibly available to me. I thank also the New University of Lisbon – ISEGI for having had the capability to recycle a Hotel Manager into a GIS enthusiast. Thanks also to my dear colleagues Miguel André Oliveira, João Cuña and André Barriguinha who have become good friends during this Masters in the last two years, Pedro Santos for his useful bibliographic support and Miguel Peixoto, for his late night conversations and 24/7 support as well as Dra. Fátima Conceição for her patience and so accurately helping me with the correct editing of this document. My soon to be married wife, Celia, I thank her dedication and utmost patience, for coping with a man who put often spatial information before good movies and long walks.
“Wisdom is like a clear and fresh lake,
one can enter it from any side”
GIS FROM A CULTURAL HERITAGE PERSPECTIVE
When Past and Future Collide
ABSTRACT
Endangered cultural heritage is becoming nowadays a consequence of global change. With an increasing world population, urban growth seems to be a jeopardizing consequence for sustainable development coping with an already scarce number of resources and cultural resource management. This dissertation prompts the importance of pro-active monitoring of cultural heritage phenomena using Geographic Information Systems as tools for predicting ongoing change to take active measures in sustainable regional planning.
The research carried out in this context will use GIS to analyse the case scenario of the Algarve as foci of urban growth as well as region of abundant archaeological vestiges from the Roman era. Understanding the dynamics of past civilization activity in what seem the most endangered freguesias (parishes) in the Algarve using Archaeological Predictive Models and assessing urbanity in those areas, may lead to a direct impact on future planning strategies.
SIG DE UMA PERSPECTIVA DE RECURSOS
CULTURAIS
Quando o Passado e o Futuro Colidem
RESUMO
O património cultural em perigo é hoje em dia uma das graves consequências das mudanças globais existentes. Com o aumento significativo da população mundial, o crescimento urbano pode ser um fenómeno comprometedor para o desenvolvimento sustentado de recursos escassos bem como da gestão de recursos culturais.
Esta dissertação indaga sobre a importância da monitorização pro-activa de fenómenos de recursos culturais, usando Sistemas de Informação Geográfica (SIG) como ferramentas poderosa na aplicação de medidas activas para um planeamento regional sustentável.
A investigação efectuada neste contexto utiliza SIG para analisar o caso do Algarve. Sendo a região como foco exemplar para a compreensão dos fenómenos de crescimento urbano bem como para a observação de numerosos vestígios da época Romana. Pretende-se compreender as dinâmicas de civilizações passadas localizando as nas freguesias em maior perigo no Algarve e, recorrendo simultaneamente a modelos de predição arqueológica bem como a modelos de crescimento urbano, foi possível analisar o seu impacto directo nas estratégias de planeamento futuro.
KEYWORDS
Archaeological Predictive Models Algarve
Cellular Automata
Cultural Heritage Management Environmental Sustainability Regional Planning
Urban Growth
PALAVRAS-CHAVE
Modelos Arqueológicos De Predição Algarve
Autómatos Celulares
ACRONYMS
APM – Archaeological Predictive Models
ASCII – American Standard Code for Information Interchange CA – Cellular Automata
CLC – CORINE Land Cover
CLC2000 – CORINE Land Cover 2000 CLC90 – CORINE Land Cover 1990
CORINE - Coordination of Information on the Environment COS – Carta de Ocupação do Solo
CRM – Cultural Resource Management DEM – Digital Elevation Model
EEA – European Environment Agency GIS – Geographic Information Systems
ICNB – Instituto da Conservação da Natureza e da Biodiversidade INE – Instituto Nacional de Estatística
K-S - Kolmogorov-Smirnov
LRM – Logistic Regression Models
LULCC – Land Use and Land Cover Change MCE – Multi-Criteria Evaluation
MCM – Multi-Criteria Models
MURBANDY – Monitoring Urban Dynamics MUU - Minimum Mapping Unit
NCGIA - National Center for Geographic Information and Analysis PM – Predictive Modelling
PROT – Plano Regional de Ordenamento do Território
PROTAL - Plano Regional de Ordenamento do Território do Algarve SDSS – Spatial Decision Support Systems
SRTM – Shuttle Radar Topography Mission UGM – Urban Growth Models
TABLE OF CONTENTS
ACKNOWLEDGMENTS ... ii
ABSTRACT... iv
RESUMO... v
KEYWORDS... vi
PALAVRAS-CHAVE ... vi
ACRONYMS... vii
LIST OF TABLES... xi
LIST OF FIGURES ... xii
1. INTRODUCTION ... 1
1.1. Contextualization of the Thesis ... 1
1.2. Objectives of the Thesis... 2
1.3. Assumptions... 2
1.4. Thesis Structure ... 3
1.5. Used Technology ... 5
1.6. Urban Growth and Historico-Cultural Heritage ... 6
2. THE STUDY AREA: AN ENVIRONMENTAL AND HISTORICAL PERSPECTIVE ... 9
2.1. The Algarve Region... 9
2.2. The Roman Algarve... 10
2.3. The Endangerment in the Algarve ... 13
2.4. Remembering the Past to protect the future... 14
3. PREDICTIVE MODELS FOR ARCHAEOLOGY ... 15
3.1. Introduction... 15
3.2. Evolution of predictive modelling in Archaeology ... 15
3.3. Literary review on Archaeological predictive models... 16
3.4. Applications of APM – Advantages and Failures ... 18
3.5. Methodology for APM... 18
3.5.1. Datasets... 22
3.5.2. Preliminary Data Preparation... 23
3.6. Logistic Regression Archaeological Predictive Model ... 31
3.6.1. Logistic Regression Model Accuracy... 34
3.7. Multi-Criteria Evaluation and APM – Innovating in uncertainty... 35
3.7.1. Chi-Square Test ... 38
3.7.2. Testing Results for MCE - APM ... 40
3.7.3. Goodness of Fit tests... 41
3.7.4. Weights of Independent Variables... 43
3.8. Comparing Generated Archaeological Predictive Models ... 43
3.9. Conclusions: Comparing both Archaeological Predictive Models... 46
4. URBAN GROWTH SIMULATION IN THE ALGARVE AREA ... 48
4.1. Introduction... 48
4.2. Urban Growth Models ... 48
4.3. Importance of an Urban Growth Model for the Algarve ... 50
4.3.1. Cellular Automata... 53
4.3.2. Markov chains in Urban Growth ... 54
4.4. Land Cover Map Adequacy for Studying Urban Algarve... 55
4.4.1. Comparing CORINE Land Cover with COS’90 ... 58
4.4.2. Comparing Urban Areas in the Algarve in CLC90 and CLC2000... 59
4.5. Urban Growth Model for the Algarve Area... 61
4.5.1. Suitability Map ... 62
4.5.2. Choice of Areas ... 63
4.5.3. Cellular Automata Urban Growth for Study Areas ... 66
4.5.4. Validation of Study Areas... 66
4.6. Conclusions... 68
5. ASSESSING THE FUTURE... 70
5.1. Urban Cultural Endangerment Model... 70
5.2. Urban Cultural Endangerment Model for Lagoa... 72
5.3. Urban Cultural Endangerment Model for Olhão ... 74
5.4. Urban Cultural Endangerment Model for Albufeira... 77
5.5. Conclusions... 80
6. CONCLUSIONS ... 81
6.2. Predictive Archaeological Modelling ... 82
6.3. Urban Growth in the Algarve ... 83
6.4. Cultural heritage Endangerment ... 84
6.5. Future Directions ... 85
BIBLIOGRAPHIC REFERENCES ... 87
ANNEX ... 100
Annex 1. Kolmogorov-Smirnov Tests... 101
1.1.. Kolmogov-Smirnov Test for Aspect Variable:... 101
1.2. Kolmogov-Smirnov Test for Elevation Variable: ... 101
1.3. Kolmogov-Smirnov Test for Hillshade variable: ... 102
1.4. Kolmogov-Smirnov Test for Land use Variable: ... 102
1.5. Kolmogov-Smirnov Test for Slope (Percentage Rise) Variable: ... 102
1.6. Kolmogov-Smirnov Test for Soil Variable: ... 103
LIST OF TABLES
Table 1 - Datasets used in study ... 23
Table 2 - Results of Kolmogorov Smirnov... 32
Table 3 – Weight Factor and Accuracy ... 34
Table 4 - Accuracy of MCE model... 40
Table 5 - Comparison Matrix for LRM and MCE... 45
Table 6 - Similarity between CLC90 and COS90 ... 58
Table 7 - Global changes in land use... 59
Table 8 - Risk of Heritage Endangerment per Freguesia... 64
LIST OF FIGURES
Figure 1 - Thesis Structure... 5
Figure 2 - Example of vector and raster (grid) layers... 6
Figure 3 - Study Area (source Google Earth) ... 9
Figure 4 - Example of garum Brands (Silva, 2007) ... 12
Figure 5 - Site location database assembly... 19
Figure 6 - Random Site Location... 20
Figure 7 - Working Methodology... 22
Figure 8 - Data Preparation... 24
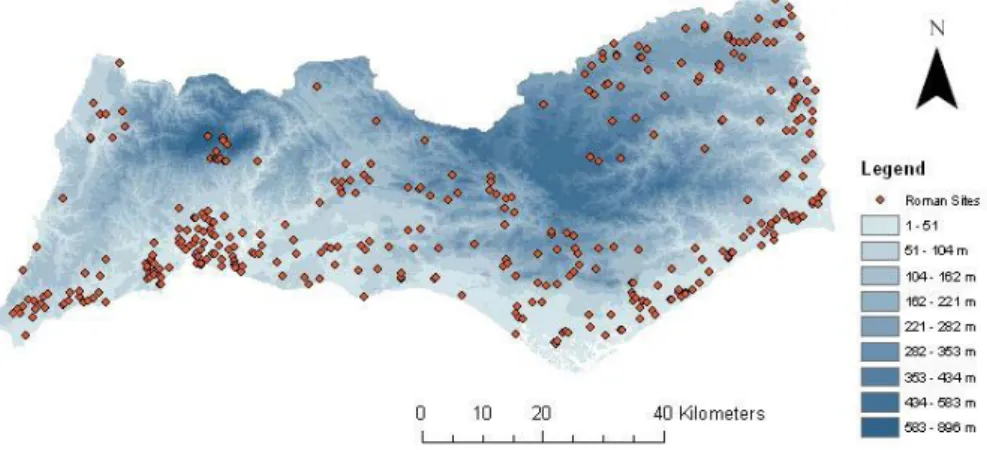
Figure 9 - Generated Elevation of the Algarve Area ... 26
Figure 10 - Derivation of slope, hillshade and aspect from the DEM ... 27
Figure 11 - Calculated slope with percent rise ... 27
Figure 12 - Hillshade ... 29
Figure 13 - Creation of River Factor and River Constraints... 31
Figure 14 - Logistic Regression Archaeological Predictive Model... 33
Figure 15 - Multi-Criteria Evaluation Model ... 38
Figure 16 - LRM and MCE Comparison ... 44
Figure 17 - Cross Tabulation in IDRISI - Methodology ... 60
Figure 18 - Accuracy Assessment ... 61
Figure 19 - Suitability Map for urban growth for the Algarve region... 63
Figure 20 - Areas with higher Cultural Risk... 65
Figure 21 – Urban Growth Forecast and Data... 69
Figure 22 - Example of Cultural Endangerment Methodology ... 71
Figure 23 - Cultural Endangerment in Lagoa ... 73
Figure 24 - Chapiter found in the quinta de Marim (Graen, 2007) ... 75
Figure 25 - Cultural Endangerment in Olhão ... 76
Figure 26- Roman Bridge in Paderne (Nunes, I.; 1989)... 78
Figure 27 - Roman Bridge in Guia (Nunes, I.; 1989) ... 78
Figure 28 - Roman path in Paderne (Nunes, I.; 1989)... 78
Figure 29 - Cultural Endangerment in Albufeira... 79
1. INTRODUCTION
1.1. Contextualization of the Thesis
Urban growth is a natural consequence of an ever increasing modern society. The effort of modernity is mainly to allow urban growth to develop in a sustainable manner and constant monitoring of sprawl1 without compromising land-use and maintaining a well balanced environmental and cultural landscape. This is not always an easy task, as urban growth may endanger valued patrimony as well as natural environment due to its progressive nature, thus prompting for a direct call of sustainability (Savard et al, 1999).
The last two years have been years of environmental awareness where problems as pollution, urban growth and sustainability have largely been discussed (Keiner, 2006; Costanza et al, 2007; EEA Report 10/2006; EEA Report 2/2007). These phenomena are an inherent consequence of demographic increase, boosted by a consuming population which must be made aware of a rising pollution and urbanization that may jeopardize life quality as well as natural and cultural landscapes if no monitoring and sustainable measures are taken (Camhis, 2006).
Geographic Information Systems (GIS) with their unique modelling capabilities may be very helpful as spatial decision support systems (SDSS) (Nijkamp and Scholten, 1993) as SDSS “embodies geomatics principles for situating decision making in space, often using a geographic information system (GIS) component to provide spatial analysis functionality.” (McCarthy et al, 2008).
These characteristics seem to be the ideal combination for usage in a Cultural heritage context, where environmental and human risk factors may be analyzed through a GIS as a “place to think” (Gillings and Goodrick, 1996), leading us to the undermined theme of our study which relates to sustainable planning of city growth having attention to archaeological cultural heritage.
Understanding the environment and tracking its changes is, above all, the attempt to preserve the past for future generations developing a more modern and conscious society “ensuring that what we pass on to future generations reflects what we
ourselves inherited from the past and what we have contributed to and shaped in the landscape, whether tangible or intangible” (Schofield, 2008). Gaining further meaning in a context of the revised version of European Convention on the Protection of the Archaeological Heritage (European Community, 1992), which underlies the philosophical framework of this study, in which it becomes clear that new technologies and urban growth may help preserve cultural resources.
1.2. Objectives of the Thesis
The overall objective of the thesis is to assess historico-cultural heritage endangerment due to urban growth in the region of the Algarve. The first objective of this thesis is to aggregate a large enough database of archaeological sites that allowed the creation of two archaeological predictive models which measure site propensity spatially. The second objective is to create an urban growth model forecasting urban sprawl in the region until 2020 using cellular automata and spatial data inventories that allowed spatial cognition of land use / land change.
The resulting intersection between archaeological predictive model and urban growth forecasting shall enlighten the higher or lesser cultural heritage endangered areas in the Algarve. It is our hope to provide stakeholders with helpful information for regional planning and develop a new methodology of analytical reasoning regarding cultural heritage endangerment, as well as shed some light on consequences of urban expansion for cultural heritage which remains modestly documented.
1.3. Assumptions
yet quite clear and is an ongoing debate which leads necessarily to different opinions. Thus, this study relies on the following assumptions, without which we could not justify the objectives of this study:
- The knowledge of the past is of extreme importance in a human social context. It is one of mans fundamental roles to understand himself and thus, learn from his ancestors. Therefore, the preservation of human past in any form is crucial for keeping its socio-cultural identity and balance, justifying the importance of such research.
- It is of crucial importance that modern urban growth is sustainable and that this sustainability reflects also historical patrimonial value regarding urban planning. Urban growth is in fact of socio-cultural and economical manifestation as human species survival. Therefore it is necessary to develop forms that ease this phenomenon in a context of respect for the environment maintaining as much as possible the aptitude for social, environmental and economical survival.
- GIS and modelling can cooperate within the social sciences, helping to better understand reality about men and their past, present and future, contributing in a unique form to the monitoring of menaced environmental suitability.
1.4. Thesis Structure
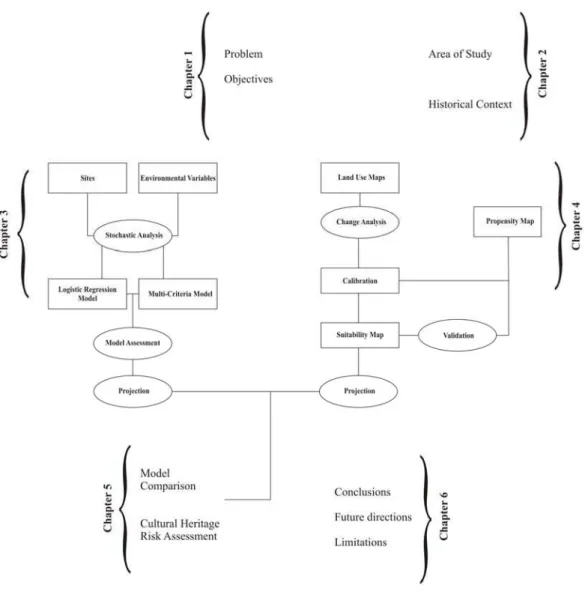
Divided in six chapters, the thesis follows a deductive approach in an attempt to comprehend urban growth as well as to understand possible damage to cultural heritage sites in the Algarve region (Portugal). While chapter one contextualizes the thesis, chapter two provides an environmental and cultural background of the region of the Algarve. Chapter three and four express individual objectives (chapter three the creation of archaeological predictive models and chapter four the generation of an urban growth scenario) which in the fifth chapter form a critical analysis leading to the cognition of the most endangered municipalities in our study area. Chapter six discusses the generic conclusions as well as limitations of our study. Describing each of the chapters individually:
anthropogenic interest of this area since the Roman era until the recent Tourist development.
In chapter 3, we will create two archaeological predictive models based on a classical and a new approach to understand Roman behaviour in the Algarve and archaeological site propensity in the study area.
In chapter 4, given the previously mentioned urban growth in the Algarve area, an Urban Growth Model will be created in an attempt to understand the characteristics of growth in the region, using common European datasets.
Chapter 5 will be a methodological suggestion regarding Cultural heritage risk areas. Given both constructed models, Archaeological Predictive Models and the Urban Growth Model, it is our objective to understand which areas are mostly at risk to lose permanently cultural heritage locally. The focus on this methodology lies in the attempt to give stakeholders a tool to premeditate cultural risk analysis using a spatial dimension.
Figure 1 - Thesis Structure
1.5. Used Technology
The entire study employs GIS to reach its purpose: A mixture of ESRI ArcGIS 9.2 and Clark Labs IDRISI Andes software packages will serve as support for development and model our calculi. Regarding statistical analysis, Microsoft Office Excel is the software which will permit us to calculate statistical results.
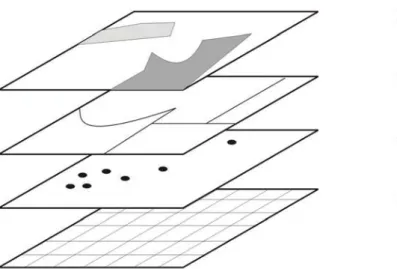
types that will be used are: ESRI shapefiles in vector format (polygon, polyline and point as exemplified in Figure 2) for representing discrete entities as well as ESRI GRID format for representing surfaces like elevation and slope. Some of these files were interchangeably exported between IDRISI Andes (RST format) and ArcGIS (GRID format) environment using ASCII files.
Figure 2 - Example of vector and raster (grid) layers
1.6. Urban Growth and Historico-Cultural Heritage
Urban Growth has been a widespread phenomenon in Europe in the last decades. It can be defined as the “physical pattern of low-density expansion of large urban areas, under market conditions, mainly into the surrounding agricultural areas.”
(EEA Report 10/2006).
The exodus from agricultural areas has led to a larger amount of people living in urban areas benefiting from services and facilities of modernity. A quarter of Europe’s territory has been affected by urban land use while 80% of Europeans will be living by 2020 in urban areas, reaching in some areas up to 90% (EEA Report 10/2006).
not articulately and not properly planned, may peril existing cultural and environmental landscapes.
Recent European objectives have considered the constant monitoring of urban growth as measures towards preservation within city boundaries as well as protected areas which are clearly defined. Also, academic initiatives related to Geographic Information Science (Goodchild, 1997) and Remote Sensing, have been actively engaged in monitoring and creating consciousness on global change awareness (Longley, 2002).
Global change, in fact, is a phenomenon which is confronting mans response regarding pollution, environmental sustainability and preservation. If no measures are taken in near future, the environment and quality of living as we know may very well become jeopardized for future generations.
The importance of geographic acknowledgment of urban sprawl has become clear in the 1999 European Spatial Development Perspective, where management of cultural and natural resources were one of the key topics of discussion: “Natural and cultural heritage in the EU is endangered by economic and social modernization processes. European cultural landscapes, cities and towns, as well as a variety of natural and historic monuments are part of the European heritage. Its fostering should be an important task for modern architecture, urban and landscape planning in all regions of the EU.” (European Community, 1999).
Although the endangerment of natural environment is no novelty, as several different species are becoming currently extinct due to pollution and environmental change, action must be taken to allow a balanced and sustainable urban growth which avoids further threat of those species and their ecosystems.
growth has destroyed many different archaeological sites and historical buildings, on one site, the short-term perspective of changing at local level may focus stakeholders on promoting and creating cultural awareness supporting for instance tourist products related to monument visits while allowing the possibility to finance conservation of buildings and monuments in latent danger due to air pollution natural of city habitat. As locally cultural heritage becomes manageable, long term regional policies may reflect on undiscovered and peripheral patrimony. These measures would benefit further academic discussions of cultural backgrounds as well as allow having in thought at the long run heritage management problems regarding urban development and expansion.
As a consequence, measures in a cultural heritage preservation context regarding urban growth forecasting may be seen in the following framework: (1) Short-run, local change measures: For instance, the protection from existing urban patrimony often endangered due to air pollution - a consequence of human activity within city due to gas emissions - may be created by developing an interesting, within urban area, tourist cultural heritage offer. (2) Long-run, regional change measures promote the analysis of future urban growth leading to a sounder choice of future urban development which may as a consequence benefit directly urban planning sparing at the long run large economic investments. For example, the recent case of Stonehenge, which due to poorly planned infrastructures 40 years ago may become on UNESCO’s list of endangered world heritage sites very soon (Webster, 2007). These advantages of planning sustainability put modelling capabilities and spatial analysis in an important position for future assessments. As “Models are, perhaps, the best way of understanding the land change phenomenon and anticipate correct planning activities for sustainable cities.”. (Cabral, 2006).
In spite the uncertainty of the possibilities of preservation of this specific site, Stonehenge could very well be a lesson in future preservation and assessment of the importance of urban growth regarding cultural heritage.
industry is an example of a cultural heritage where no active measures regarding urban growth are currently being taken.
2. THE STUDY AREA: AN ENVIRONMENTAL AND HISTORICAL PERSPECTIVE
The Algarve has been since ancient times a region of historical and environmental diversity. This chapter tries to abridge these aspects as well as contextualize the cultural and environmental potential of this area.
2.1. The Algarve Region
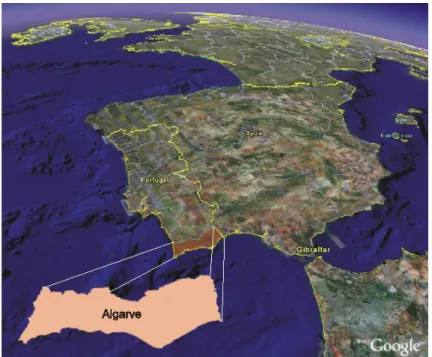
The Algarve region is the most southbound region of Portugal and has a total area of 4960 km2 (Figure 3). To the south and west, its littoral coasts are bathed by the Atlantic Ocean whereas to the north, the massive mountain range called Serra do Caldeirão, separates this region from the Alentejo and the rest of Portugal.
Figure 3 - Study Area (source Google Earth)
microclimate, different from the rest of continental Portugal and more similar to the Mediterranean neighbours.
The Algarve can be divided into three distinct ecosystems Barrocal (located at the Serra do Caldeirão), Interior (between the Serra do Caldeirão and the coast area) and
Litoral (the coastal area). Those distinct areas have diverse fauna and flora, largely influenced by each one of the particular climatic and morphological characteristics. The Algarve region has been a very attractive tourist area since the beginning of the 1960s having led to a large mass-tourism industry. This has both, been economically positive for the region which grew to be one of the richest regions of Portugal, but also a paradigm to sound and sustainable urban planning. The ongoing tourism strategies for the Algarve region which are discussed in the PROTAL 20072 emphasize the importance of the tourist sector for this region and remind us, of an overpowering number of five million tourists which the Algarve receives annually. The municipality of Faro has according to the INE (Instituto Nacional de Estatística) has a total of 58664 inhabitants and borders with the municipalities of São Brás de Alportel, Loulé and Olhão facing to the south the Atlantic Ocean is the administrative centre of the Algarve. Its coastal proximity has made of Faro an interesting settlement since protohistoric times.
2.2. The Roman Algarve
Homers Odyssey is proof that Homers Heroes already knew the west of the Mediterranean (Maia, 1987). “But the other cliff, thou wilt note, Odysseus, is lower – they are close to each other; thou couldst even shoot an arrow across – and on it is a great fig tree with rich foliage, but beneath this divine Charybdis3 sucks down the black water.” (Homer, 1984) This unique region extending almost to half of the Iberian Peninsula as far from the south lands of the Tagus river to the Spanish Andalusia was cradle for many civilizations.
2 The PROTAL (Plano Regional de Ordenamento do Terrirório) is one of the instruments for regional
territorial development which according to nationally defined directives integrates municipal strategies for local development creating guidelines for sustainable and sound territorial developing defining networks for infra-structures, transportation and services.
The region of the Algarve belonged to the so-called Tartessos4 region, and has been described by 63 BC to 24 AD geographer Strabo, in his work Geographica which depicts an accurate historical, social and geographical description of the ancient world.
The existences of different civilizations are diverse and archaeological remains from as early as the times of the Celts (Maia, 1987) and also from the Palaeolithic are visible and abundant. (Veiga, 2005).
During the Roman occupation due to administrative boundaries which were created by Augustus in the first century, the region became a part of the province of
Lusitania. It is only much later, in the beginning of the XII century that the region former known as Lusitania, became segmented in different provinces. One of those provinces was the Al-Garb, from the Moorish meaning “The Occident”. Later, in 1250 that the Al-Garb province, conquered by the Christians becomes the region of the Algarbe and is incorporated in Portugal.
The heterogeneous morphology of the Algarve was quite similar in the times of the ancient Algarve as described by Strabo:
“Turdetanium5 is a prosperous country, with all kinds of products and in large quantity. This richness is duplicated by exportation. The existing estuaries allow routes of transportation which are carried out by small boats that allow the connections from the river deltas to the open sea. The abundance of rivers and estuaries makes almost the entire region sailable.” (Strabo, 2007)
Strabo also gives us a clear idea of the inhabitant’s behaviour in Roman days mentioning also some of the major cities in the times of the Romans:
“The inhabitants built their cities with great proximity to their rivers and estuaries. Those cities are Asta, Nabrissa, Onuba, Ossonoba, Mainoba and a few others. The existing channels that connect those cities also ease the already abundant commerce. Commerce is carried out with the entire Italy and Rome being navigation quite accessible.” (Strabo, 2007).
The Algarve was not only an important region in the antiquity since pre-roman times but also during the Imperial Rome period where it was regionally auto-sufficient and
4 Greek name of the first civilization of the occident
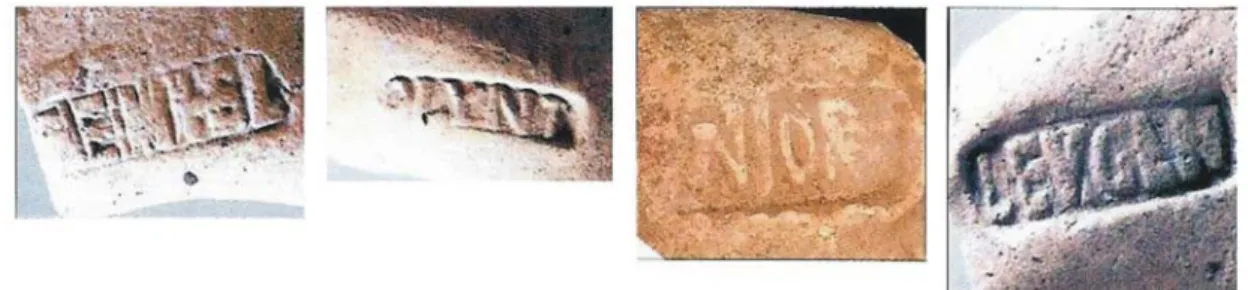
had an active role regarding wealth distribution through the entire Roman Empire. One of the main exportations was garum, a salted fish mixture, often used as a sauce in the entire Empire of which the most appreciated was Gades, distributed at the Golf of Cadis and included the multiple production areas in the Algarve (Silva, 2007). The popularity of this ingredient is obvious due to the existence of different brands (Figure 4) that commercialized this product and were found in different archaeological excavations.
Figure 4 - Example of garum Brands (Silva, 2007)
This strong commercial activity as well as Strabo’s mentioned descriptions are a clear indication of a cultured, cosmopolitan society existing in the first centuries of our era with a vast network all throughout the entire Roman Empire (Marques, 1999) that allowed impaired circuits for trade and commerce which were a consequence of a unique geo-morphological location, explored since the Phoenicians. The networks of the Romans in the Algarve were diverse. Not only did the Romans connect by sea to the rest of the Empire and to near cities, but also, existence of fortified roads partially still visible indicate robust roads that connected all the way to Rome. (Rodrigues, 2004)
This dilemma, justifies a special attention from the Archaeological and scientific community, as Ossonoba with already pre-roman influence became capital of the Roman civitas6.
Ossonoba was in fact a rich city and one of the most important ones in Roman days. The ruins of Milreu as well as other archaeological sites found in the last decades show us an immense and powerful heritage of wealth and splendour in the region, as cited in Frei Vicente Salgado, 1786, “Memórias Eclesiásticas do Reino do Algarve”(Salgado, 1786), who cited André de Resende, 1593, “Livro das Antiquidades da Lusitania”, quoting in Latin Médico Rhafes who lived in 10th century in the following way: “(…) soil was fertile and abundant, plane and full of kitchen gardens, to which many water sources shed surrounded by cattle pastures and two small isles where many boats and ships sailed, in fact, one of the grandest in the world”. Thereof, this city was “a city of major importance in any historic moment, showing since the Bronze Age vestiges of different civilizations” (Gamito, 1997).
2.3. The Endangerment in the Algarve
Compared to Stonehenge and the Valley of the Kings, the Algarve does not represent an as important cultural phenomenon. Albeit this difference which is naturally imposed by the magnitude and historical character of those sites, the Algarve as discussed in earlier chapters, merits our attention due to the unprecedented urban sprawl as well as the extent of cultural Mediterranean spoils situated in the past region known as Hispania. Sharing a common European identity which defines a common cultural value, we had the chance in chapters three and four to predict both: archaeological site propensity and urban growth. The most interesting question raised by both predictions is one of intersection, which may prospect knowledge of urban planning in the region, giving an opportunity to protect vestiges of the past as well as broaden a chance of sustainable cultural landscapes for future generations (Sen et al, 2006).
The call for proactive measures reaching a region like the Algarve which is shaped by a massive tourist industry, would allow stakeholders to monitor locally and regionally as well as improvement of cities at short, medium and long period.
2.4. Remembering the Past to protect the future
The cultural richness in the Algarve justifies the importance of performing studies that relate cultural heritage to current urban growth. As we have seen from this chapter, the Algarve shows a diverse geomorphologic and cultural milieu. This vast cultural and heterogeneous geography, have made it a region that not only know in the past, but also with rich present and future perspectives, with interesting cultural tourism possibilities surrounded by many natural and artificial cultured assets, worthwhile of being considered and protected.
Understanding the regional context and historical value of the region as a whole may lead future stakeholders to develop sounder strategies to acknowledge a sustainable tourism industry and develop services which relate to other products than sun and beach traditionally offered.
3. PREDICTIVE MODELS FOR ARCHAEOLOGY
3.1. Introduction
Predictive Modelling (PM) is becoming of extreme importance for the Archaeological Sciences. The possibility to understand the patterns that may have existed in the past, allow stakeholders to take direct action regarding cultural heritage or historians to understand long disappeared civilizations underpinned by the importance of spatial data (Renfrew and Bahn, 2004). Since the 70’s GIS have had an active role in Archaeological Predictive Modelling (APM). Although not as much used in southern Europe, due to a more historical oriented Archaeology, these models are much explored in the United States, England and in the Netherlands where predictive modelling is seen as an asset that complements sustainability and preservation.
In this chapter we will introduce the paradigms of APM by developing two distinct Predictive Models (one based on Logistic Regression and the other based on Multi-Criteria Evaluation) which will allow judging of the accuracy for regional archaeological prediction based on a collected site sample of the Algarve.
3.2. Evolution of predictive modelling in Archaeology
Models can be used for dynamic simulation, providing decision makers with vivid visualizations of alternative futures (Longley et al, 2006). This ubiquity in visualization, sheds light not only on alternative realities but may help to understand the past, and thus becomes particularly interesting for archaeological studies (Espa et al, 2006).
“(…) spatial patterning of archaeological remains which reflect the spatial patterning of past activities” (Schiffer, 1972).
Hence, with an over thirty years old history, APM are becoming a accepted tool for site prediction and are a frequent application for GIS in Archaeology (Wheatley and Gillings, 2002). Though Human Sciences tend to have an opposite scope than Information Technologies and quantitative methodologies, GIS and Archaeology due to the availability of commercial GIS packages (Ebert, 2004) and the increasing easiness of use as well as the cost effectiveness of conducting surveys (Groover, 2002) seem to have reached a common ground with Archaeological Sciences.
Most of the APM are environmental deterministic models and rely primarily on environmental variables for the prognostic analysis. This characteristic favours the usage of GIS systems with their capacity to evaluate spatial data (Longley et al, 2006). As much as this may bring a methodological approach to prospective modelling, human behaviour does not exclusively rely on environmental factors. Also other human socio-cultural factors share importance remaining a problem of representation in a GIS environment and may influence the spatial patterns to be solved (Ingold, 1993; Tilley, 1994; Bradley, 1998) and should be considered.
Nevertheless for Cultural Resource Management (CRM) Archaeological Predictive Models may be highly recommended, as CRM deals not with the contribution of an explanation of site location but rather with the prediction of site location and its environmental impact. (Conolly and Lake, 2006).
3.3. Literary review on Archaeological predictive models
Since 1970 an ongoing scientific debate regarding archaeological predictive modelling has existed. This debate has been accompanied by technological advances which led to possibilities of better understanding and predicting archaeological past. The initial models proposed strong statistical backgrounds (Savage, 1990) mainly as a result of Archaeological processualism.
only rely on correlations towards environmental factors, but also historic non-quantifiable data has an important meaning for prediction.
As the main question is, if a specific location contains Archaeological vestiges, the argument becomes one of available theories of spatial distribution of archaeological material as well as empirical and historical observations of site records (Wheatley and Gillings, 2002). It is in this scenario that disagreement occurs more often, as scientists do not agree yet on a common methodology and a general theory which entwines correlative and cognitive approaches.
Nonetheless, in this spirit of controversy, deductive and inductive approaches for APM have risen over the past decades. The inductive Models are considered to be more spatially related, and as a consequence of empirical and analytical tools related to environmental variables. Deductive modelling focuses mainly on the available historical data leading towards a more cognitive nature.
The predisposition of correlative models, primarily based on environmental variables seems to exclude the importance of cognitive / anthropological backgrounds. This fact led to the appearance of cognitive models, which unfortunately still lack on mathematical and empirical explanation.
Predictive Modelling (Verhagen, 2007). While LRM only reason in a deductive approach, MCM may consider inductive and social data as well.
3.4. Applications of APM – Advantages and Failures
APM have reached diverse applications in many different subtypes of the archaeological sciences. Albeit many unclear directions due to the lack of a common theoretical background (Wheatley and Gillings 2002), a few sound examples of application of APM models have been created recently using GIS as tools for spatial analysis.
An ongoing debate on the usefulness of inductive and deductive models has increased related to the fact that prospecting past historic vestiges is an unclear task and arguments linked to methodologies for highly accurate prospecting seem yet uncertain. Nevertheless, if APM are to be analyzed as a hypothetical tool for regional planning, rather than historico-archaeological prompting based on previous environmental assessment they are elegant tools and very useful tools. Those tools lead to successful cases of preservation of artificial cultural heritage (archaeological sites, monuments etc.) protection as studies in the case of the protection of Forest Management Planning in Ontario (Bona, 2000).
This allows us to conclude APM should in nowadays be seen as supplementary assets of great potential (Hill, 2007) for regional planning rather than a methodology
per se, as no sound theoretical background is still defined and divergences related to the analytical processes exist.
3.5. Methodology for APM
confirmed and validated with the Instituto Português de Arqueologia, which confirmed the correct location of the mentioned archaeological vestiges. This task was executed by the University of the Algarve, Faculty of Human and Social Sciences without which this work would not have been possible. Figure 5 shows the overall methodology for data preparation and assembly.
Figure 5 - Site location database assembly
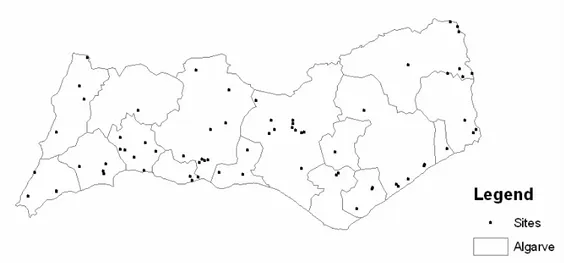
chosen based on a well spread distribution and were used for accuracy assessment (Figure 6).
Figure 6 - Random Site Location
The generated datasets permitted the creation of two different models, which will be explained in this chapter (Logistic Regression Model and Multi-Criteria Evaluation Model).
The inductive relation of site location given environmental determinants will consented the conception of a relationship between the information about plausible location of sites and the independent environmental variables that may be expressed in a function as follows (Altshul, 1988):
A = D + F1B + F2C + Fix …+ E
Where Aequals site density; B, C and xrepresent the independent variables we have considered; F1, F2 and Fx represent the weights for B, C and X respectively; D is a constant; and E is an error term. Thus, B and C represent independent variables in which the relationship to the sites is of utmost importance for our model and becomes the key for the parameterization of a propensity map, in which the different probabilities of finding a site in a given location may be assessed.
the different sets of data that are available. This is the reason why in our study two distinct models for predicting the location of Roman sites will be applied. The attempt of two different approaches is related to the need to find the most adequate model for predicting sites in the Algarve for cultural resource management induced by swift changing urban landscapes.
The propensity maps produced by the independent variables are based on a 370 sites sample, where 70 sites will remain for calculating the accuracy of each of the generated models as mentioned later on.
Therefore, environmental variables as slope, hillshade, elevation and river distance may very well be independent variables for a dependent site location dataset in the creation of an APM as they are chiefly for environmental planners concerned mainly in the presence or absence of Archaeology (Kamermans and Rensink, 1998).
Once the models are successfully build and allow interpretation archaeological site propensity as Kvamme (Kvamme, 1999) suggests, a jack-knife approach should be used to validate ground truth of the Predicted Model. This will inherently answer the models predictive power and capability.
A jack-knife approach consists of excluding to the statistic interpretation of the predictive model a set of random archaeological sites, which are afterwards added to confirm the accuracy of the modelled result.
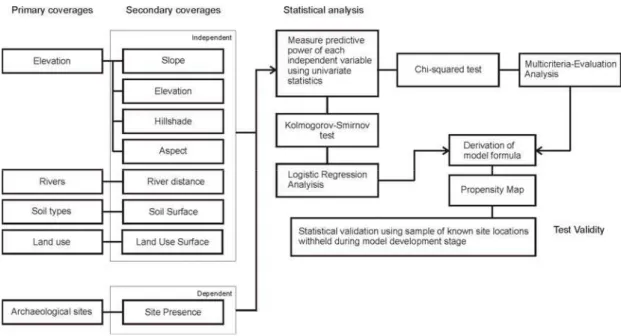
Figure 7 - Working Methodology
3.5.1. Datasets
According to Kincaid (1988), the very possibility of coping with the modelled reality and the archaeological environment is not only due to the availability of information of a sample inventory but also to:
(1) detailed analysis of existing information (2) preparation and choice of environmental data
(3) development and execution of successive phases of model testing (using independent data)
(4) collection and processing of supplemental information about site variability Table 1, shows all data, their source, original projection, usage, scale, geometric and model type used for our study
Data Layer Source Original
Projection Used for
Scale / Resolution
Model Type
ARCHAEOLOGICAL DATA
Roman Site Location University of the Algarve WGS1984
Dependent Variable for Multi-Criteria Analysis Model 1 and 2 and Logistic
Regression Model
Not Applicable Vector
ENVIRONMENTAL DATA
Algarve DEM 90m resolution
SRTM (Shuttle Radar Topography
Mission - NASA) WGS1984
For creation of slope, hillshade, aspect and elevation datasets which are
important independent variables for our models.
90 metres per
cell Raster
Slope SRTM (secondary data) WGS1984 Significant Layer for APM 90 metres per cell Raster
Hillshade SRTM (secondary data) WGS1984 Significant Layer for APM 90 metres per cell Raster
Aspect SRTM (secondary data) WGS1984 Significant Layer for APM 90 metres per cell Raster
Elevation SRTM (secondary data) WGS1984 Significant Layer for APM 90 metres per cell Raster
Hydrographical Basins Downloaded from SNIG (Sistema Nacional de Informação Geográfica)
Hayford-Gauss Significant Layer for APM 1:1000000 Vector
Portuguese Rivers Downloaded from SNIG (Sistema Nacional de Informação Geográfica)
Hayford-Gauss Significant Layer for APM 1:1000000 Vector
Soil Types for Portugal Downloaded from SNIG (Sistema Nacional de Informação Geográfica) Hayford-Gauss
Significant Layer for APM, dataset was simplified to have
the soil types for the Algarve only.
1:1000000 Vector
Land use for Portugal
Requested from Portuguese Environmental Institute, belonging
to CORINE Land Cover 2000 Project.
Hayford-Gauss
Significant Layer for APM, dataset was simplified to have
the soil types for the Algarve only.
1:100000 Vector
Portuguese
Administrative Chart Geographic InstitutePortuguese Hayford-Gauss and Definition of Municipality Freguesias Boundaries 1:25000 Vector
Table 1 - Datasets used in study
3.5.2. Preliminary Data Preparation
It is of extreme importance to allow a rigorous analysis by undertaking the conversion of the available datasets into a common coordinate system. This is not always an easy task, as often data providers are unknown and not all the necessary information is available.
In our case the following transformations were introduced:
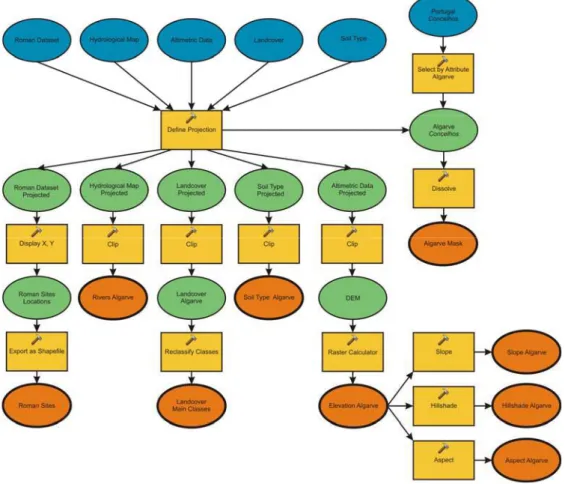
CAOP (Carta Administrativa Oficial de Portugal, Portuguese Administrative chart) was downloaded in digital format from the Instituto Geográfico Português with a Lisbon Hayford – Gauss Projection at a 1:25000 scale. The area corresponding to the Algarve was filter and later, using the dissolve function, these polygons were dissolved to origin a homogenous shapefile which served as mask for our scope of analysis.
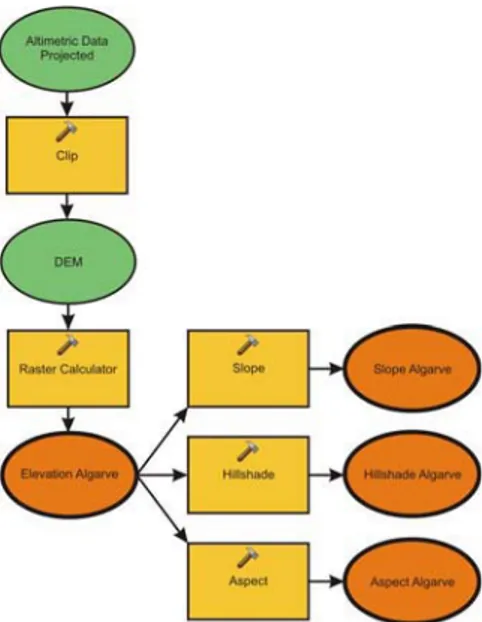
Lisbon Hayford-Gauss was defined as a common coordinate system for all data and thus, initial input data such as Roman sites, Hydrographical Map, Altimetry data, CORINE Land Cover and Soil Type were projected into the same coordinate system as the CAOP. The different originating layers which encompassed more than the area of study were extruded by the study area layer derived from the CAOP information. This originated our analysis layers and allowed us to calculate slope, hillshade and aspect based on our generated Digital Elevation Model of the study area. The overall schema and methodology for this process may be observed in Figure 8.
3.5.3. The Models Variables
3.5.3.1. Dependent Variable7 – Roman Sites
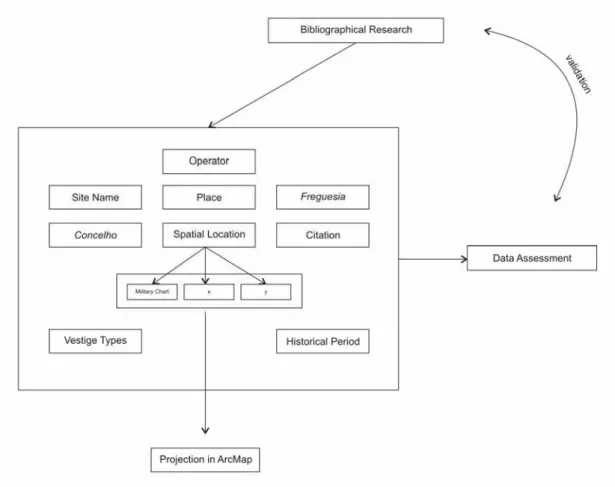
The present Archaeological dataset, consequential of the data collection mentioned previously, are vector point locations of several different types of artefacts, grind stones, mosaics and a large variety of fine and common ceramics. This was, in fact, the first attempt to cover the entire bibliographical roman site location reference for the Algarve and is, among other, constituted by the main reference of historians who studied the region.
A database was generated with the provided attributes; simplifying the process of academic prospecting of available bibliographical information. The Access database comprehended the X and Y coordinate that conferred a spatial location to the site attributes those were implemented in a GIS to allow the mapping and future prospective modelling of Roman culture in the Algarve (Vaz et al, 2007).
The site datasets correspond to our dependent variable, as its behaviour will depend on the environmental (independent) variables. This detail relates to our notion of an environmental deterministic model as we already described.
The dependent variable will allow us to quantify the densities of each independent variable and assess its relation. These important relationships have been established by simple stochastic methodologies explained later.
3.5.3.2. Independent Variables8 – Environmental Data
GIS and its capacity to cope with environmental variables and datasets, allow us to approach archaeology in the sense that the past (and present) cultures are somehow functions of environmental pressure: favourable conditions for specific cultural systems induce higher probabilities to find similar systems in different locations with the same set of conditions.
3.5.3.2.1. Digital Elevation Model
The Digital Elevation Model (DEM9) (Figure 9) became of extreme importance for spatial analysis as other altimetry features such as slope, hillshade and aspect must be derived from it. The DEM was generated based on NASA’s Shuttle Radar Topography Mission (SRTM, 24.11.07). The product downloaded was at Latitude min. 35 N max 40 N with Longitude 10 W to max 5 W with centre point Lat: 37.50 N and Long: 7.50 W, with 90m elevation data per cell.
The downloaded file in ASCII10 was converted into GRID Raster format in IDRISI and the available WGS 1984 coordinate system converted into the common feature coordinate system, Lisbon Hayford-Gauss. Those processes are considered as pre-analysis measures which are of paramount importance for GIS spatial pre-analysis.
Figure 9 - Generated Elevation of the Algarve Area
From the Elevation Model, four important layers were acquired: slope, hillshade and aspect using ArcGIS ® spatial analyst tools (Figure 10).
9 “A raster Digital Elevation Model (DEM) records height above sea level for a set of cells arranged in
Figure 10 - Derivation of slope, hillshade and aspect from the DEM
3.5.3.2.2. Slope and Aspect
These variables are considered as first-order from the DEM. Slope (Figure 11) calculated by GIS software tools is the maximum level of change of the elevation at a given location as the aspect may be defined as the azimuth (compass direction) of this rate of change in downhill direction. Those variables are usually included in archaeological predictive models for site location (Conolly and Lake, 2006). Both of these variables are estimated from a local neighbourhood and values are applied to a cell of the same size as the DEM models (Wheatley and Gillings, 2002).
The importance of this variable is quite understandable, as it measures the amount of energy it takes to move from one location to another. Making it perfectly clear that areas where less amount of energy is spent are preferable, hence areas with low slope are more desirable as they are less hostile. The result is a statistical sum of sites for a specific slope class the normalized result is obtained by the site per class dividing by the total number of sites.
“Aspect” is calculated in degrees with either 0 – 360 representing North. It is often reclassified from degrees (or radians) into the eight primary compass directions (N, NE, E, SE, S, SW, W and NW) (Wheatley and Gillings, 2002). “No Aspect” data (i.e., data with flat slope and with no correspondent Aspect) was removed for the calculation of our ratio as those values may hinder the correct categorization of site tendencies per slope and may lead us to an inconclusive analysis regarding this variable.
“Aspect” may be an influencing environmental factor in two main ways. First, south facing slopes receive more sun and are therefore warmer on average than more northerly facing slopes. In the Southwest, increased temperatures may not necessarily have been as desirable as in the higher latitudes, but increased duration of available sunlight may have played a role. Secondly, sun-loving plants are highly correlated with “Aspect”, and may have influenced the availability of edible seeds, the desirability for planting cultigens at a location, or the habitat of an animal resource.
3.5.3.2.3. Hillshade
Figure 12 - Hillshade
3.5.3.2.4. Land use
The used environmental dataset was CORINE Land Cover 2000 (CLC2000) for Portugal (Paínho and Caetano, 2006). The CORINE Land Cover project is a project that originated in the eighties by the European commission with the objective to start a land cover map for all of Europe. Based on Landsat imagery it comprehends a total of 44 classes and a minimum unit of 25 ha. Its original scale is at 1:100000. In this study, the five Level 1 classes were used which are: Artificial Surfaces, Agriculture areas, Forest and Semi-Natural areas, Wetlands and Water bodies.
and Spooner, 2005) thus as a consequence often originating material legacy in the land use.
3.5.3.2.5. Hydrographical Data
The usage of rivers by the Romans has long been discussed, and, therefore this data became an important variable for the creation of our predictive model. The data was downloaded from the Sistema Nacional de Informação Geográfica and was created by the Instituto do Ambiente – Atlas Digital do Ambiente in September 2003 with Map Projection of Transverse Mercator and Horizontal Geodetic Datum of Lisbon Hayford-Gauss.
Figure 13 - Creation of River Factor and River Constraints
3.6. Logistic Regression Archaeological Predictive Model
Logistic Regression Models (LRM) are the most usual types in Archaeological Predictive Models (APM). Their usage is a clear statement to simple processualist Archaeology in which the question of understanding the past recognizes quantitative aspects of stochastic methodologies. Processualism in Archaeology has begun in the 60’s and seems to emerge in a time of large examination of exact sciences in different human sciences.
While the later discussed Multi-Criteria Evaluation (MCE) in predictive modelling are quite new it has proven great usage in urban and regional context (Voogd, 1983) and as Archaeology, those areas deal necessary with human action thus methodologies and tools could be shared and find a common ground.
advantages and disadvantages of both methodologies contributing for further investigation concerning the most adequate methodology for APM.
Datasets inventories as well as generated coverage from primary datasets are exactly the same in both models. It is the statistical analysis where also Archaeologists don’t seem to find a common ground that varies. While the MCE-APM (Multi-Criteria Evaluation Archaeological Predictive Model) was based on a Chi-squared test to measure the weight of each variable, LR-APM (Logistic Regression Archaeological Predictive Model) was done using Kolmogorov-Smirnov11 Goodness-of-Fit-Test (Kvamme, 1990). Table 2 shows the results of the relation of independent and dependent variables obtained by Kolmogorov-Smirnov:
Variable Dmax D K-S Dmax-D K-S Relation
Aspect 0.153240 0.0785 0.074720 Not Random
Elevation 0.000001 0.0785 -0.078519 Random
Hillshade 0.074830 0.0785 -0.003690 Random
Land use 0.005124 0.0785 -0.073395 Random
Slope 0.848868 0.0785 0.770348 Not Random
Soil 0.194056 0.0785 0.115536 Not Random
River Distance 0.973333 0.0785 0.894814 Not Random
Table 2 - Results of Kolmogorov Smirnov
The Logistic Regression was calculated based on the weights of each independent variable class as mentioned earlier. Therefore, the final map is a result of the different sums of weight for the given area of study.
From our initial equation of:
Logistic Regression APM = f([Elevation] + [Riverdistances] + [Landuse] + [Soil] + [Aspect] + [Hillshade] + [Slope])
We obtained a more assertive relationship where Random variables were excluded, leading us to the following:
Logistic Regression APM = f([Riverdistances] + [Soil] + [Aspect] + [Slope])
11 Kolmogorov-Smirnov analyses the relationship between dependent and independent variables,
The resulting map creates a unique weight per cell where each cell has a 20m spatial resolution showing the potentiality of finding roman sites in the region (Figure 14).
Figure 14 - Logistic Regression Archaeological Predictive Model
3.6.1. Logistic Regression Model Accuracy
Although no agreement regarding the best practice for assessment of accuracy of Archaeological Predictive Models exists, ground truth of site prediction is of chief importance as to validate the constructed model and to understand the accuracy of prediction. To achieve this, a set of random sites was left out which will serve as a jack-knife sample (Kvamme, 1988) measuring the models accuracy. The jack-knife sample consists of 70 random roman sites, which were unsystematically selected from our study area.
Site Potential Pixels per
Class Class Weight Inverse Weight Sites Site Weight Weight Rank
Final Ratio
10-20% 615470 0.050806 19.682816 0 0 0 0
20-30% 2919199 0.240974 4.149831 4 0.06 0.24 0.011
30-40% 3967063 0.327473 3.053691 23 0.33 1.00 0.047
40-50% 1886949 0.155764 6.419984 18 0.26 1.65 0.078
50-60% 1219298 0.100650 9.935375 12 0.17 1.70 0.08
60-70% 1219738 0.100687 9.931791 9 0.13 1.28 0.060
70-80% 268498 0.022164 45.118336 3 0.04 1.93 0.091
80-90% 12890 0.001064 939.812490 1 0.01 13.43 0.632
90-100% 5078 0.000419 2385.620914 0 0 0
12114183 70 21.23102923
Table 3 – Weight Factor and Accuracy
esteemed an 80-90% of accuracy for the Logistic Regression Model as can be seen on the weight rank of the table. The following steps were considered:
a) Establishing the true weight for each class. As potential classes may have different spatial dimensions, it is important to establish a comparative weight for each class. Inverse values were considered.
Inverse Relative Weight of Class = 1 / [(Pixels per Class / Total Pixels)]
b) Establishing a relative weight for sites in each class.
Site weight per Class = Sites per Class / Total Sites
c) Creating the Relative weight of each class by multiplying site weight per class by the established class weight potential
Weight Rank = Site weight per Class * Inverse Relative Weight of Class
d) Recording the true relative potential of all classes is thus, the result of the total weighted ranks. Value with highest ratio will correspond to accuracy of model
Final Ratio = Weights Rank / Total Weights Rank
3.7. Multi-Criteria Evaluation and APM – Innovating in uncertainty
occurrence in which each independent variable may be sub-categorized in factors or weights leading us to a propensity or suitability map.
In Archaeological Predictive Modelling where independent variables may very well represent factors and constraints of occurrence of sites, Multi-Criteria Evaluation is a sound process for site prediction (Verhagen, 2007). The problem in Archaeological Predictive Models which occurs with the Multi-Criteria Evaluation or with any methodology of prediction other than logistic regression, is, the distribution of the weights per factor. This obstacle underlies the lack of information regarding the impact of the independent variable on the dependent variable. That is, we may know that for instance, land use, may have a direct impact on site location given bibliographical research, but, are we able to quantify precisely the weight that each of the classes represents in the land-use dataset? Nevertheless, this methodology lends us an elegant degree of flexibility, which allows us to innovating on the form in which we calculate (and how we calculate) the factors weights.
This paradigm has brought in a series of discussions regarding the nature of Archaeological Predictive Modelling and is related fundamentally to the centre of discussion concerning the usage of inductive and deductive models. Following the debate originated in the 90’s, inductive models rely too much on environmental variables, not having in mind the past behaviour of cultures and the economic performance which is not that much related to environmental variables by itself, but rather a more casuistic and rather intangible human choice of action (Leusen, 2002). It is also understood that there is not such a gap between the divergences of inductive and deductive models on a practical basis (Whitley, 2006). In fact, our choice of variables for a correlative inductive model, in which we formalize the choice of agricultural soil as a factor, is related to a previous knowledge of the trend e.g., we know, based on bibliographical research, that Romans preferred proximity to rivers and agricultural soils for residence. Our model becomes further accurate depending on bibliographical specificity of environmental variables that is, the kind of agricultural soils preferred by Roman settlements.
create an as accurate spatial model as possible. Hence, the underlying approach of deductive and inductive models is not a question per se, as both theories are significant for the creation of the model underpinning cultural systems as well as ecosystems variables (Kamermans and Rensink, 1998).
Deductive Models may give a preliminary choice of the variables to be analyzed and, inductive models, to analyze stochastically the variables and to truly arrive to a clear and crisp quantification of the predicted phenomena in the form of a propensity map. Once arrived to this conclusion, it is reasonable to say that inductive models, with support of independent environmental variables, will be able to project a given scenario of possibility of occurrence. The question that occurs next is the following: Having chosen the independent variables based on a deductive context of site location and bibliographical research, how can we understand the weights (tradeoffs) of each of these variables in a quantitative context instead of a qualitative survey? It may be clear that for instance, slope and land use are important factors, but, given those to independent variables for site prediction, which one is more important and as consequence, how is the weight distribution between both of those stochastic generated variables?
Looking back on each independent environmental variable we knew a priori that a relation of dependent and independent variables existed:
S = w1A + w2B + w3C
Where, S is the Site propensity, W1 and W2 weight of independent variables and A, B and C the independent variables.
This relationship obliges us to calculate w for each variable, where wrepresents the tradeoffs of each independent variable for the propensity of the dependent sites (S)
variable.
In this model, we will try to understand the weight of wbased on the distribution of the existing dispersion.
higher weight factor. This conclusion is reached based on the notion that agglomeration is a consequence of a voluntary choice in which the random context is diminished establishing a pattern that may be quantitatively analyzed using standard deviation.
The best way to measure effectively different weight factors as we have seen is the Multi-Criteria Evaluation (Figure 15) as it gives us a free choice of weight factors and, different from logistic regression, allows us to have a non-linear approach.
Figure 15 - Multi-Criteria Evaluation Model
3.7.1. Chi-Square Test
No consensus does exist regarding MCE as for the weighting method of the different factors (Conolly and Lake, 2006). This is necessarily a consequence of aggregating individual preferences into collective preferences (Voogd, 1983), result of MCE of factors and chosen weighting factors.
The Ranking Method is defined by:
wj = n – rj + 1 / (n – rk + 1)
Where, w is the weight for criterion j, n the number of criteria under consideration and r the rank position of the criterion. As rank position is somewhat arbitrary, this criterion necessarily will not express confident set of rules for stochastic approach. Rating Method which is most widely applied in APM (Verhagen, 2007) allows the decision maker to estimate weights from 1-100 scale.
The qualitative nature of the weight criterion biased and uncertain an accurate quantitative methodology does not exist. Nevertheless, in Archaeology the problem of creating a Weight for factors may be of stochastic nature, and hence have a solution which may create quantifiable weights.
In our study we will try to answer this question with the squared test. The chi-squared test is an excellent starting point for a situation when it is necessary to test the significance of observations made at nominal scales of measurement.
As non-parametric test of significance, it allows the comparison among different types of areas of an archaeological site (Conolly and Lake, 2006). It is formula is given by:
¦
¸¹· ¨ © §
k i
Ei
Ei
Oi
1 2 2 FWhere X2is the chi-squared vale, k is the number of categories and Oi and Ei are the observed and expected number of classes in each category.
This will allow a correlation of expected and occurred values that may be compared by the total number of classes if:
¦
22
Where W is the weight of X2 per existing class over the total of X2 results over the
studied universe.
3.7.2. Testing Results for MCE - APM
No specific methodology for accuracy assessment of APM does exist. Therefore, we adopted a proven Methodology (Santos, 2006) in which assessment is based on a jack-knife sample as largely documented (Kvamme, 1990) and the Archaeological Predictive Model is reclassified in ten classes of potentiality 10% per class.
Percentage Roman Sites % Potential
70-80% 17 24,29
50-60% 16 22,86
40-50% 11 15,71
80-90% 8 11,42
60-70% 6 8,57
0-10% 5 7,14
30-40% 4 5,71
10-20% 1 1,43
20-30% 1 1,43
90-100% 1 1,43
70
Table 4 - Accuracy of MCE model
(1) We can see clearly the tendency to find Roman near coastal areas. This is quite an important conclusion for further study, as this area is the one suffering significantly from urban growth and sprawl originated from the Tourist Industry as we may see in the next chapter.
(2) There seem to be specific areas which create cluster region for site propensity. Analyzing those with the Geographic information of known Roman cities, we may see clearly the cities of Porto Hannibalis (Portimão) and Balsa (Tavira) with much higher site propensity. This conclusion also helps to reinforce the theory of the location of the city of Ossonoba as under the actual city centre of Faro (Gamito, 1997).
(3) Furthermore, certain paths between high elevation with lower slopes appear in the interior of the Algarve, those areas seem to suggest the most adequate location for pathways among the Roman Algarve which may share some information on the location of the still undiscovered Roman Road circuits.
3.7.3. Goodness of Fit tests
Weighting the independent variables is an important step which justifies the significance that each of the variables has in the context of the studied environment. The environmental variables of this model have been chosen based on bibliographical and anthropological information (Sebastian and Judge, 1988; Ebert, 2004; Bona, 2000). Yet, the relationship that might exist between them can not be neglected as overall relations among dependent variables may differ. The calculus
that decides relevant variables are equated by a quality of fit test, which is an important procedure to establish and test the weights of each of the environmental factors.
Several statistical methodologies exist, and it is in this context that non-parametric tests of significance like chi-squared (F2) and Kolmogorov-Smirnov (K-S) are used.
In our Logistic Regression methodology, we will try to use both, K-S and 2F while
While F2 is pointed out to be an excellent starting point for those situations when it
is necessary to test the significance of observations made at nominal scales of measurement as well as of common practice, K-S has been largely used in the Archaeological context (Kvamme, 1990; Santos, 2006). Kolmogorov-Smirnov can effectively be used to assess distributional differences of any kind (Kvamme, 1988), still it may be problematic due to positive spatial auto-correlation, which invalidates any possible independence among variables (Kvamme, 1988; Altschul et al, 1988).
3.7.3.1. Kolmogorov-Smirnov Goodness of Fit test
Applying the Kolmogorov-Smirnov (K-S) test for the seven independent variables has proved that distribution of roman sites regarding the independent variables for each set isn’t random. This concludes our Goodness of Fit test and allows us to use all studied independent variables for our logistic regression expression.
The K-S test was done as follows:
(1) Calculi of the Cumulative Percentage Class Area as a result of Zonal Statistics in ArcView with interchange with Microsoft Excel for creating tables and weights.
(2) Sites observed per each defined class.
(3) Percentage of sites per class as a result of the following equation:
a.
¦
nn
% , where % is the percentage of sites per each class and nthe
existing sites.
b. Cumulative site percentage presence was calculated as consequence of (a)
(4) Sites expected was calculated as a result of the following:
a. E (
¦
n)%, where Eis the expected site value in real positive integerand n the existing sites.