Journal of Synchrotron Radiation
ISSN 0909-0495
Received 16 May 2009 Accepted 8 October 2009
#2010 International Union of Crystallography Printed in Singapore – all rights reserved
Energy-dispersive X-ray absorption spectroscopy
at LNLS: investigation on strongly correlated
metal oxides
Ju´lio C. Cezar,a‡2Narcizo M. Souza-Neto,a}4Cı´nthia Piamonteze,a§6
Edilson Tamura,a‡‡8Fla´vio Garcia,aEdson J. Carvalho,aRe´gis T. Neueschwander,a Aline Y. Ramos,bHe´lio C. N. Tolentino,b* Alberto Caneiro,cNestor E. Massa,d
Maria Jesus Martinez-Lope,eJose Antonio Alonsoeand Jean-Paul Itie´f
aLaborato´rio Nacional de Luz Sı´ncrotron – LNLS, CP6192, 13084-971 Campinas, SP, Brazil, b
Institut Ne´el, CNRS and UJF, BP 166, 38042 Grenoble, France,cComision Nacional de Energia Ato´mica, Centro Atomico Bariloche and Instituto Balseiro, Bariloche, Argentina,dLaboratorio
Nacional de Investigacion y Servicios en Espectroscopia Optica – CEQUINOR, Universidad Nacional de La Plata, La Plata, Argentina,eInstituto de Ciencia de Materiales de Madrid, CSIC, Cantoblanco, Madrid, Spain, andfSynchrotron SOLEIL, L’Orme des Merisiers, Saint-Aubin, France.
E-mail: [email protected]
An energy-dispersive X-ray absorption spectroscopy beamline mainly dedicated to X-ray magnetic circular dichroism (XMCD) and material science under extreme conditions has been implemented in a bending-magnet port at the Brazilian Synchrotron Light Laboratory. Here the beamline technical characteristics are described, including the most important aspects of the mechanics, optical elements and detection set-up. The beamline performance is then illustrated through two case studies on strongly correlated transition metal oxides: an XMCD insight into the modifications of the magnetic properties of Cr-doped manganites and the structural deformation in nickel perovskites under high applied pressure.
Keywords: XAS; XMCD; high pressure.
1. Introduction
The Brazilian Synchrotron Light Laboratory (LNLS,
Campinas, Brazil) runs a 1.37 GeV electron storage ring (Rodrigueset al., 1998) endowed with a 120 MeV LINAC and 500 MeV booster injector system (Linet al., 2001) operating at a maximum current of 300 mA. The energy-dispersive X-ray absorption spectroscopy (EDXAS) beamline described here is installed in a bending-magnet port and was delivered to the users in 2005. The peculiar capability of an EDXAS spectro-meter is to collect full absorption spectra through a parallel detection scheme over an extended range of photon energies without any mechanical movement (Phizackerleyet al., 1983; Dartygeet al., 1986). The parallel detection, combining good spatial resolution, ability to handle the high flux of photons (of the order 1011photons s1
) and fast readout times makes EDXAS specially suited to detecting very weak signals in
XANES (X-ray absorption near-edge spectroscopy) and XMCD (X-ray magnetic circular dichroism) experiments (Baudeletet al., 1991; Pizziniet al., 1995), for tracking time-dependent evolution of chemical reactions (Tourillon et al., 1986) and attaining nanosecond resolution (Bonfim et al., 1998). Owing to the absence of moving parts during the acquisition, the beam in an EDXAS set-up is inherently highly stable in both energy scale and spatial position. These features, along with the intrinsic focused beam and the parallel detec-tion, enable high-pressure studies using diamond anvil cells (Itie´et al., 1989; Pascarelliet al., 2004), even when associated with XMCD experiments (Mathon et al., 2004), and the possibility of probing femtometer-scale atomic displacements (Pettiferet al., 2005).
From 2005 onwards, many experimental facilities have been developed at the LNLS EDXAS beamline; for example, a halogen-lamp-based furnace for controlled thermal treat-ments and study of dynamical processes (Meneseset al., 2006). This furnace made possible the observation of NiO nano-particles undergoing a phase transformation (amorphous to nanocrystal) during annealing (Meneseset al., 2007). A reactor chamber (Bernardi et al., 2007) was used to monitor the chemical environment of Pt atoms in a catalytic reaction of ‡ Present address: European Synchrotron Radiation Facility, Grenoble,
France.
}Present address: Advanced Photon Source, Argonne National Laboratory, Argonne, USA.
§ Present address: Swiss Light Source, Paul Scherrer Institut, Villegen PSI, Switzerland.
PtxPd1xnanoparticles (Bernardiet al., 2009). Both chambers are usually coupled to a mass spectrometer for residual gas analysis. An electrochemical cell for in situ voltammetry analysis was employed to study the oxy–redoxy reaction of methanol on carbon-supported Pt–Ru nanocatalysts (Godoiet al., 2009). High-pressures studies have been reported in two different pressure domains, one up to 1.2 GPa using a B4C anvil cell (Ferreiraet al., 2009) and another up to 15 GPa using a perforated diamond cell (Ramoset al., 2007). A set-up for grazing-incidence X-ray resonant magnetic scattering (Souza-Neto et al., 2006) and the use of a closed-cycle He cryostat associated with a 0.9 T permanent magnet for XMCD experiments (Azimonteet al., 2007; Stewartet al., 2007) have also been reported. Many other experiments on magnetic materials will soon become feasible with the forthcoming installation of a 6.5 T superconducting magnet. As may be noted, the LNLS EDXAS beamline covers the traditional fields of similar existing facilities around the world. Some strengths and limitations when compared with these facilities will be discussed throughout the paper.
We will give here an extensive description of the EDXAS beamline that includes the optical elements, some important aspects of the mechanics, and the detector system. Then, the beamline performance is illustrated by two studies related to main instrumental developments of the beamline: an XMCD set-up is used to study the magnetic properties of Cr-doped manganites and a diamond anvil cell is used to study the structural changes of nickel perovskites under high pressure.
2. The energy-dispersive X-ray spectrometer
The energy-dispersive X-ray spectrometer uses a bent Si crystal monochromator to provide a continuous energy variation of the Bragg-reflected photons (Fig. 1). The mono-chromator is bent in such a way that the incidence angle of the white synchrotron light beam changes continuously along the crystal, thus selecting a bandwidth of hundreds of eV and focusing it horizontally at the sample position. There is a correlation between the photon energy and the horizontal position at the detector. A complete X-ray absorption spec-trum is collected in a single detector’s readout. Vertical focusing as well as harmonic rejection are accomplished by a bendable mirror before the Si crystal.
2.1. The energy-dispersive optics
The source-to-crystal and crystal-to-focus distances in Fig. 1 are represented by the variables p and q, respectively. The average curvature radiusRis related topandqby 1/p+ 1/q= 2/(RsinB), whereBis the average Bragg angle of reflection.
The photon energy E depends on the Bragg angle B
according toE[eV] = 12398/(2d[A˚ ] sinB), wheredis the Si
crystal lattice spacing. The angle changes along the illumi-nated crystal length L, yielding a relative energy bandwidth
E/E = cotB, with = L/R(1 RsinB/p). The full
energy bandwidth is focused at the sample. The energy reso-lution depends essentially on the intrinsic crystal band-pass,
spatial resolution of the detector and horizontal source dimension. In order to optimize energy resolution the detector is normally placed at a distancebfrom the sample such that
b’q(Tolentinoet al., 1988). As can be noted, energy band-pass and resolution depend on intrinsic as well as on extrinsic parameters, likeL,Randp.
The EDXAS beamline at LNLS is installed on a bending-magnetic port (Fig. 2). The horizontal and vertical dimensions (FWHM) of the source are sx = 750mm and sy = 168mm, respectively. The source-to-crystal distance was chosen as short as possible (p= 9.75 m) to provide a large beam hori-zontal acceptance by the bent crystal. This acceptance is limited to a maximum of 4.8 mrad by the detector horizontal acceptance. The crystal-to-detector distance is adjustable between 1 and 3.5 m. The 2arm can be adjusted to angles between 56 and 16, providing, in principle, an energy range from 4 to 14 keV with the Si(111) crystal. A compromise between energy band-pass, energy resolution and sample position has to be found for each experimental situation. The energy band-pass and energy resolution for typical qvalues and atb’qare presented in Figs. 3(a) and 3(b), respectively. The dotted lines in Fig. 3(a) represent the band-pass limited by the crystal size while the continuous ones give the band-pass limited by the detector window whenb’q. One may set the distancebsmaller thanqto gain band-pass with the drawback of losing energy resolution.
The lowest attainable energy depends on the sample and on its environment, especially when extreme conditions are required. Up to now, the lowest energy achieved in a real experiment is the one reported here for Cr-doped LaMnO3.
The LaL2edge (5891 eV) is easily accessible owing to its high
absorption cross section. However, the strong attenuation imposed by La atoms, whoseL3andL2edges are at 5483 eV
and 5891 eV, respectively, makes experiments at the CrKedge
Figure 1
very challenging, especially when only 5% of Cr atoms substitute for Mn atoms in the perovskite structure.
The monochromator bender
mechanism developed at LNLS is detailed elsewhere (Neuenschwander & Tolentino, 2004). Such a bender is supported by four columns and assem-bled on top of a three-circle goniometer with the center of the crystal’s front face coincident with the three-circle confu-sion sphere (Fig. 4). The main circle is used to set the energy, and the others are used for the preliminary alignment procedure. The vacuum vessel allows future installation of a second bender, with a different crystal reflection plane, to extend the covered energy range. All elements inside the vessel are
UHV-compatible and isolated from the
beamline by a 0.125 mm Be entrance
window. The beam-output window
is a flat 385 mm-long 10 mm-wide 0.125 mm-thick Be foil brazed on a stainless steel flange, equipped with a pneumatic shutter. A 340 l s1 ion pump, assembled on the chamber, provides
vacuum conditions without any vibration. The mono-chromator operates with a base pressure of 5.0108mbar that prevents crystal surface degradation.
The curvature radius R of the Si crystal is given by two independent torques imposed by linear actuators at each extremity. The mechanism is designed to bend a 300 mm 20 mm rectangular crystal from 8 m to 3 m, given by a displacement of 2.3 mm of the actuator, without displacement of the central part (Neuenschwander & Tolentino, 2004). The combination of the two independent torques at each crystal extremity provides a way to significantly reduce spherical
Figure 3
Energy band-pass (a) and energy resolution (b) for typicalqvalues and at b ’q in the case of a Si(111) bent crystal. The dotted lines in (a) represent the band-pass limited by the crystal size while the continuous ones give the band-pass limited by the detector window whenb’q. Figure 2
Layout of the EDXAS beamline installed in a bending-magnet port at LNLS. The sequence indicates: (1) front-end, (2) wall shield, (3) cooled Be window, (4) cooled slits, (5) Rh-coated mirror, (6) two Be windows, (7) cooled slits, (8) monochromator, (9) beam shutter and large Be window, (10) sample holder, (11) optical bench, (12) modified CCD detector, (13) short linear stage and (14) long linear stage. Distances are in millimeters.
Figure 4
aberrations. One of the frames that transmit torque to the crystal is assembled on an elastic link enabling twist correc-tion. A 0.25 mm eccentric twist stroke is essential for further focus optimization.
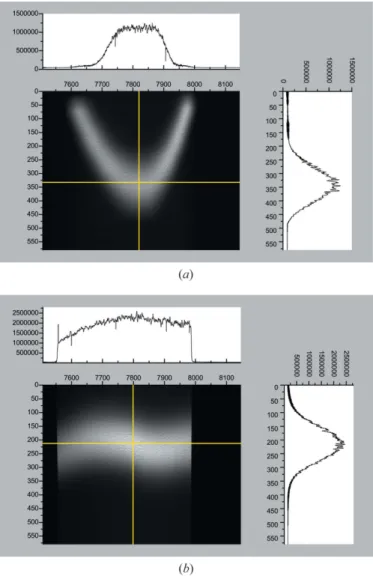
Fig. 5 presents a comparison in a situation where the aberrations are minimized with equal applied torques on both extremities (Fig. 5a) and the same situation where the two torques are optimized independently (Fig. 5b). The measure-ments were accomplished around the CoKedge (7709 eV) by scanning a 20mm slit laterally through the focus position,
while collecting images in the CCD-based detector. The vertical axis corresponds to the slit relative translation and the horizontal axis to the photon energy. The beam size (FWHM) at each energy is 125mm for both situations, given by source
size (750mm) and a demagnification (q/p) of 1/6. However,
one can observe that the full band-pass is spread over 350mm
when symmetric torques are applied and the focus spot is
dominated by the spherical aberrations. On the other hand, when the focus is optimized, by applying asymmetric torques the aberration is reduced to less than 30mm and the full
band-pass is focused within 150mm. The horizontal beam size that
should be considered is in fact about 250mm (full beam) when
the tails are included to have more than 95% of the photons. The remaining S-shape aberration could be further reduced by a small correction in the rectangular crystal shape. This correction has not been implemented at the EDXAS beamline because the focused beam is largely limited by the bending-magnet source size, and demagnification and aberrations contribute less than 10% to the beam size. For a horizontal beam slit down to the full beam, the tails of the Gaussian-shaped beam have negligible contribution to the intensity.
Vertical focusing and harmonic rejection are provided by an 800 mm-long Rh-coated glass mirror at 6.5 m from the source (Neuenschwander & Tavares, 2001). The mirror is separated from the front-end and the monochromator by two 125m
m-thick Be windows and operates with a base pressure of 1.0 108
mbar. The bending mechanism yields at the sample a vertically focused beam (FWHM) of about 200mm, limited by
the storage ring vertical emittance and a demagnification close to 1 : 1. The mirror provides a cut-off energy of about 15 keV at a grazing angle of 4 mrad, the typical working angle for most experiments. At photon energies lower than 7 keV and strongly absorbing samples, the grazing angle has to be increased up to 4.5 mrad to reduce the cut-off energy to about 12 keV. A second small mirror is normally installed, between the sample and the detector, for further reducing harmonic contamination.
The bending-magnet source, front-end and photon flux characteristics have already been discussed elsewhere (Tolentinoet al., 2005b). In normal operation conditions, the photon flux in a spot of 250mm200mm at the sample is of
the order of 1.01011photons s1at 8 keV. This corresponds to the Si(111) crystal monochromator (bandwidth of 0.013%) accepting a horizontal divergence of 4 mrad and the storage ring working with 200 mA. The photon flux can be improved by a factor of two at 8 keV by pumping along the beam path. Pumping the beam path is compulsory when working at energies lower than 7 keV. For instance, at the Cr K edge (5898 eV) the photon flux is improved by one order of
magnitude, from 6.0 1010photons s1 up to 4.0
1011photons s1. It must be noted that the beam path in the air
is the most severe factor of attenuation and not the four
125mm-thick Be windows, whose contribution to the
attenuation is only 20% (Tolentinoet al., 2005b). Such flux is smaller by a factor of ten when compared with a similar facility, the ODE beamline at Soleil, and by four to five orders of magnitude when compared with the undulator beamline ID24 at ESRF.
2.2. The CCD-based detection scheme
The high photon flux is handled by a modified CCD camera that uses a phosphor screen to convert X-rays into visible light (Fig. 6). The cryogenically cooled CCD camera system has a
Figure 5
front-illuminated scientific grade 1 CCD of 13401300 pixels. Each pixel is 20mm 20mm providing an image area of
26.8 mm 26.0 mm. A 20mm-thick P43 (Gd2O3S:Tb)
fluor-escence screen, optimized for 8 keV X-rays (Koch, 1994), receives the incoming beam at an angle of 20. A set of lenses guides the light from the screen to the CCD detector with a demagnification factor of 1 : 1.75, so that the projected pixel size and useful area at the fluorescence screen are 35mm
35mm and 46.9 mm 46.5 mm, respectively. Actually, the
spatial resolution measured in the energy dispersion direction is about 2.5 to 3 times larger than the projected pixel, i.e.
100mm, owing to the penetration and blurring into the
fluor-escence screen. To improve spatial resolution, which turns out to be the limiting factor in the overall energy resolution, thinner fluorescence films should be considered, with the drawback of losing quantum efficiency.
The photon energy–direction correlation is transformed into an energy–position correlation along the horizontal dimension of the CCD detector. The intensity along one horizontal line of pixels gives an XAS signal. With 20 of incidence, the vertical beam (200mm FWHM) is spread over
about 18 pixels. To produce an XAS frame, the XAS signal is integrated along the vertical dimension over 30 to 50 pixels. Each pixel in the CCD detector is an integrator. It accumu-lates charges that are transferred to a processing system. A pixel saturates with about 2.0105photons of 6 keV (or, with about 275000 electrons). So, if 1.0 1011photons s1, distributed within typically 1000 horizontal by 40 vertical pixels, reach the detector, each pixel receives on average 2.5 106photons s1
. The pixels at the maximum of the Gaussian distribution receive on average 5.0 106photons s1 and would saturate in about 40 ms. Typical accumulation time for
XAS frames is 20 to 1000 ms, depending on photon flux and sample attenuation. So, the intensity at each point in an XAS frame comes from 4.0106photons at most and the statistical noise would be 5.0104. Unfortunately, the noise level in the detector system is not coming from the counting statistics of photons; it is also dependent on charges from thermal activation, leaks and transfer processing. Beam fluctuations and instabilities along with sample inhomogeneities may also have an important impact on the noise level. The final XAS spectrum is the average of many frames, ensuring a good signal/noise ratio is achieved.
2.3. The optical bench
The 2optical bench (Fig. 7, see also Fig. 2) is made of a steel-framed 3 m-long granite block, with two main steel rails screwed directly onto aluminium reference pads aligned on the granite block. The optical bench can bear heavy equip-ment and hold movable supports that are clamped to the steel rails through linear sliders. We should recall that the crystal monochromator and its internal mechanics are isolated from the vacuum chamber and supported directly in a concrete block on the floor. This makes access to the center of rotation of the monochromator difficult and imposes the design of a 2 arm rotation based on two translation stages equipped with linear encoders, ball screws and linear bearings (Neuen-schwander & Tolentino, 2004). After a proper alignment procedure, a set of equations that control each translation stage displacement is found in order to give a rotation refer-enced to the center of the monochromator. The rotation covers the 2range from 16 to 56. The translation stages are both perpendicular to the optical bench at an angle of 36 (Fig. 2). The short stage (shown in Fig. 7) has the moving carriage equipped with a rotation platform that contains a pivoting base plate. The long stage (not seen in Fig. 7) has the
Figure 7
Photograph of the EDXAS beamline showing (from left to right) the entrance slits, the cylindrical monochromator vessel, with the large output Be window, the experimental set-up, with the cryostat and an electro-magnet installed, and the modified CCD detector. The experimental set-up and the detector are installed on the 2 optical bench, which is supported on two linear stages (only one shortest linear stage appears in the photograph).
Figure 6
moving carriage equipped with another linear stage able to move freely in the perpendicular direction. The 2 arm is screwed onto the base plate of the short stage and placed by gravity in the center of an axial bearing at the top of the long stage. Recently, in order to receive the new 6.5 T super-conducting magnet facility, the optical bench has been modi-fied, keeping the same design but with the main rotatable arm much lower than the one shown here.
3. Case study 1: XMCD in Cr-doped LaMnO3+d
Doped LaMnO3 perovskites have been extensively studied
owing to their colossal magneto-resistance (CMR) property and its potential applications to magnetic devices (Ramirez, 1997). In Cr-doped manganites the chromium takes the Cr3+
form. This ion involves three electrons in the one-spin state of the t2gorbitals, analogous to Mn
4+
. For low doping concen-trations, Cr3+ ions go into the Mn3+ sites, thereby changing the Mn3+ density without large distortion of the crystal cell (Morales et al., 2008). These features make the partial substitution of Mn by Cr in LaMnO3.00+an interesting system
for studying the character of the Mn3+–Cr3+interaction (Sunet al., 2001; Moraleset al., 2005; Deisenhofer et al., 2002) and understanding the mechanism involved in CMR.
We present here a preliminary XMCD study in a series of LaMn1xCrxO3.00+ compounds with rigorously controlled
stoichiometry. Polycrystalline powdered samples of
LaMn0.75Cr0.25O3.00, LaMn0.9Cr0.1O3.04 and LaMnO3.09 were
prepared by the liquid-mix method (Morales et al., 2008). X-ray powder diffraction reveals the existence of single-phase materials with orthorhombic symmetry (Pnma). With the increase of Cr content the magnetic phases change from A-type AFM order to a system with FM clusters. In sample A (LaMn0.75Cr0.25O3.00) there are no Mn4+ions, the FM ordering
temperature is 90 K and the magnetic moment is 1.6B. The
holes (25%) are all introduced by Cr-doping. The two other samples contain the same hole ratio (18%). However, in sample B (LaMnO3.09) the holes are introduced only by the
oxygen over-stoichiometry, then formally present as Mn4+ ions, while in sample C (LaMn0.9Cr0.1O3.04) half of them are
provided by Cr-doping. The magnetic moments for samples B and C are 3.0Band 2.5B(Morales & Caneiro, 2003), with
ordering temperatures of 165 K and 135 K (Morales et al., 2004), respectively. At the MnKedge, the XMCD is due to the orbital magnetization of 4p-projected density of unoccupied states (Guo, 1998). These states are hybridized with the spin-polarized 3dMn band, which dominates the magnetic prop-erties of the system. Thus the XMCD amplitude reflects the Mn magnetic moment strength.
XMCD spectra at the Mn and Cr K edges (6539 eV and 5989 eV, respectively, in the pure elements) were collected with an average storage ring current of 250 mA. The circularly polarized light was selected 0.14 mrad (0.8 mm) above the orbital plane, with a slit aperture of 0.02 mrad (100mm).
Under such conditions the photon flux reaching the sample was reduced to about 5.01010photons s1with an estimated polarization ratio of 70% (Tolentino et al., 2005a). A
band-pass of 230 eV with an energy resolution of 1.5 eV was selected around the chosen edge by the Si(111) bent crystal. The beam was focused horizontally to a spot of 200mm and
collimated vertically to about 100mm. Data were collected
using the CCD detector, with the sample temperature fixed at 20 K using a closed-cycle helium cryostat. The direction of the 0.9 T applied magnetic field was inverted by 180 rotation of the permanent magnet. To avoid long-term shifts in energy scale, the sequence of collection followed the standard procedure with the magnetic field aligned parallel to the beam direction (+), then antiparallel (), then again antiparallel (), then finally parallel (+). The sequence is repeated starting with antiparallel, leading to the XMCD signal as the average of these eight (++++) acquisitions. The typical acqui-sition time for each XAS frame was 300 ms. Each acquiacqui-sition was the result of typically 50 accumulations, or about 15 s. So, a total of 50106photons were accumulated at each acqui-sition, giving a statistical fluctuation of 1.4104. However, the noise in this experiment was not limited by the photon counting. Beam fluctuations and sample vibrations, induced by the rotation of the magnet, associated with sample inhomo-geneities, were probably the main source of noise. Many successive acquisitions, typically 100 to 500, were added up in order to obtain a noise-to-signal ratio of the order of 104
. Since the Cr K and La L2 edges are only 100 eV apart
(5989 eV and 5891 eV, respectively), the XANES features of the former are superimposed on the EXAFS (extended X-ray absorption fine structure) oscillations of the latter. Although La is a nominally diamagnetic ion, a strong XMCD signal at the LaL2edge is clearly observed (Fig. 8). This signal is likely
to arise from a ferromagnetic-induced moment by interactions with neighboring Mn ions. The La L2 background signal,
extending over a large energy range far above the CrKedge, is therefore not removed by performing differences among sequential spectra. The data presented in Fig. 8 correspond to the sample A, with the higher Cr content, and an accumulated acquisition time of about 5 h, giving a noise level of 1.5104, which represents the RMS statistics of the spectrum when it is
Figure 8
LaL2-edge and CrK-edge XANES (bold line) and XMCD (thin line) in
sample A (LaMn0.75Cr0.25O3.00). The XANES features at the CrKedge
are superimposed on the LaL2-edge EXAFS oscillations. Only the LaL2
normalized to the LaL2edge. If the spectrum is normalized to
the Cr K edge, whose jump is about ten times smaller, the noise level is of the order of 103
. Within such a noise level, no Cr K-edge XMCD signal has been observed. As we will see below, the XMCD amplitude at the MnKedge, which refers to the amplitude of the first negative feature around 6553 eV, ranges from 1.4 to 2.5 103. If Cr were coupled anti-ferromagnetically or anti-ferromagnetically with Mn, one would expect a value quite close to that of Mn. We can conclude that either the Cr spins are randomly oriented and average out, or they give a contribution to the XMCD signal by less than 103.
To be able to extract any signal smaller than that, at least one order of magnitude should be gained in the noise-to-signal ratio. In this experiment the noise was not limited by the counting statistics of photons but by a combination of source instabilities, inhomogeneities of the sample and sample holder vibrations. New dedicated measurements, with longer acqui-sition time, should significantly improve the noise-to-signal ratio.
The normalized XANES spectrum at the Mn K edge, its first derivative and the XMCD signal in LaMnO3.09(sample B)
are shown in Fig. 9 for a total acquisition time of 3 h. The XMCD and the XANES derivative shapes are quite different. Some of their near-edge features are almost out of phase, testifying that the XMCD is not a derivative spurious signal. The XANES first derivative can be used to estimate the beamline stability required for detecting reliable XMCD signals. In the present case, the maximum derivative at the edge position is about 2.3104meV1. This means that, in the procedure of difference among successive spectra, an instability in the energy scale of 1 meV would give rise to a spurious contribution of 2.3 104 and then hinder any expected XMCD contribution of same order of magnitude. The noise level of our XMCD data is 1.0104. Successive measurements of the same sample for several hours show a
variation smaller than 10% in signal amplitude, thus attesting an energy stability of the order of 1 meV. For the sample B, the MnK-edge XMCD amplitude is 2.5103(or 3.6103, if corrected by the polarization ratio of 70%), in agreement with those found in doped manganites compounds with similar hole doping (Subiaset al., 1997).
The XMCD signals of the different samples A, B and C (Fig. 9 and insert) have the same shape, already identified in doped manganites: a main signal changing from negative to positive at the edge, then a second resonance stemming from multiple scattering of magnetic nearest neighbors, and finally a further peak, observed at 43 eV above the edge, assigned to a simultaneous excitation of 1sand 3pelectrons (Subiaset al., 1997). We note that the XMCD amplitudes are very similar for samples B (2.5103) and C (2.3103), and about half in amplitude for sample A (1.4103). The lower amplitude in sample A is easily explained considering that the magnetic moment of this sample (1.6B) is half that of sample B
(3.0B). This is consistent with the strong domination of the
3dMn spins on the magnetic properties of manganites. More singular is the similarity of the XMCD signals for samples B and C. While in the case of the mixed (hole plus Cr-)doped sample C the total magnetic moment is significantly (20%) smaller (2.5B) with respect to the strictly hole-doped sample
B (3.0B), the XMCD signals for both samples are the same
within the accuracy of 10%. The Mn atoms in both samples polarize the 4p states in the same manner and then carry similar magnetic moments. A lower magnetic moment for sample C could be related to an AFM Mn3+ and Cr3+ spin
alignment. Further measurements are needed to confirm and extend this assumption.
4. Case study 2: pressure-induced metal–insulator transition in YNiO3
Distorted nickel perovskites RNiO3 (R = Y or rare-earth)
exhibit a narrow thermally induced insulator–metal (IM) transition (except for La) (Lacorreet al., 1991). The transition temperature (TIM) increases when theRatomic size decreases.
For the largest sizes (R = Pr, Nd, Sm) diffraction measure-ments show an orthorhombic structure with a unique rather symmetric Ni site (Garcı´a-Mun˜ozet al., 1992). For the smallest sizes (R= Y, Ho–Lu) a monoclinic structure shows up below
TIM. This monoclinic structure is characterized by the
presence of two distinct Ni sites with different average Ni—O distances, both exhibiting a limited distortion of the NiO6
octahedra (Alonsoet al., 1999). EXAFS and XANES provided evidence for two Ni sites in the insulating phase even in the compound with orthorhombic structure (Piamonteze et al., 2005a; Acosta-Alejandroet al., 2008). The site with the longer Ni—O distances is less hybridized and promotes electronic localization. Charge-transfer multiplet simulations of the modifications in the Ni L-edge spectral shape for the insu-lating and metallic states undoubtedly confirmed this scenario (Piamontezeet al., 2005b).
The stability of the insulating charge-ordered state in YNiO3 under applied pressure was investigated by infrared
Figure 9
MnKedge in sample B (LaMnO3.09): XANES (plain line), derivative of
spectroscopy and X-ray diffraction (Garcı´a-Mun˜oz et al., 2004). The authors report a sudden structural modification close to 14 GPa, consistent with a monoclinic to orthorhombic transition. At this pressure an increase in electronic conduc-tivity and a phonon screening were also observed. However, such structural modifications of long-range character could not be directly associated with the insulator–metal transition. We report here on the evolution under pressure of the local scale environment of Ni3+ions in YNiO3, directly studied by
high-pressure XAS at the NiKedge (8345 eV). A fine-grained high-quality YNiO3polycrystalline powder sample (Alonsoet
al., 2000) was loaded into the 125mm-diameter hole of an
iconel gasket mounted on 2.4 mm-thick diamond anvils. At 8 keV such thickness results in an attenuation of 96% of the incident beam. In order to keep a similar dynamic range of the CCD detector, the normalization intensity without the sample was measured through an equivalent hole gasket and atte-nuated by thin glass plates. Each frame was collected in 100 ms and accumulated 250 times, giving a total acquisition time of 20 s per spectrum. Five spectra were collected at each pressure and then averaged to produce the final XAS data. XAS was measured with an energy resolution of about 1.5 eV, a band-pass of about 800 eV being focused to a Gaussian spot of 130mm (FWHM). For each energy the center position was
dispersed in less than 30mm, in such a way that almost the
whole energy band-pass could be collected through the gasket. Quasi-hydrostatic pressures up to 20 GPa were applied using silicone oil as pressure medium. The actual pressure was increased by steps of about 2 GPa, monitored and controlled with a precision of about 0.5 GPa, using the luminescence from ruby spheres. After each pressure measurement, the cell was carefully realigned at the optical focus. The energy cali-bration stability was better than 0.03 eV over the whole set of measurements.
Fig. 10 shows the NiK-edge XANES spectra of YNiO3at
selected pressures. Two main changes are observed when increasing applied pressure: a shift of the absorption threshold
and a subtle raise of the structures B and C above the edge; the feature A does not change. The absorption threshold shifts almost continuously towards higher energies. In order to properly interpret this shift, the reproducibility of the edge position was checked to be better than 30 meV. The accuracy can also be certified by the fact that feature A does not change and that after pressure release the features are rather recov-ered. The amplitude of the edge shift as a function of the increment of applied pressure,E/P, is not constant over the whole pressure range (insert Fig. 10). Up to about 13 GPa,E
varies almost linearly with the applied pressure and quotes
about 60 meV GPa1. Above that, E/P drops to
20 meV GPa1and another almost linear regime takes place.
As the metal formal valence (Ni3+) does not change with the
applied pressure, the edge shift (E) results essentially from the modifications in the repulsive nearest-neighbor potential arising from the bond reduction (R) in the coordination shell. As for other perovskite oxides, where the ratio E/R is roughly 10 eV A˚1
(Ramos et al., 2007), the shift may be converted directly into a compression. The compression separated in the two different linear regimes turns out to be 0.06 A˚ and 0.02 A˚, respectively. It should be noted that the difference in the average distance of the two Ni sites in the monoclinic structure is0.08 A˚ .
A subtle rise in the intensity of the structures B and C above the edge (from 8350 to 8370 eV) occurs in a narrow pressure range from 12 to 14 GPa. The sudden increase of the spectral weight of the B structure is associated with some degree of symmetrization in the average Ni site (Ramoset al., 2007). The rise of the C structure has been observed in the thermal evolution of the PrNiO3compound across the insulator–metal
transition (Acosta-Alejandro et al., 2008). It has unambigu-ously been associated with a local symmetry change from two non-equivalent Ni sites, consistent with a local monoclinic distorted structure, to a single rather symmetric Ni site.
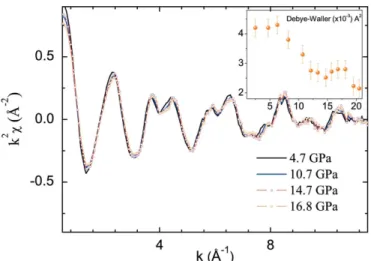
The EXAFS oscillations, given in Fig. 11 for selected applied pressures, clearly show the good quality of the signal, free of spurious diffraction peaks from the diamond anvil cell,
Figure 11
Comparison of k2-weighted EXAFS oscillations of YNiO3 at selected
pressures around 13 GPa. Insert: Debye–Waller term variation as a function of applied pressure.
Figure 10
Comparison of the XANES spectra in YNiO3 at selected applied
over a large extension in reciprocal space (kmax ’12 A˚1).
When the applied pressure increases, the overall structure of the oscillations remains almost unchanged but their amplitude slightly increases. Such a feature is usually associated with a decrease in the damping Debye–Waller (DW) term exp(2k22) accounting for bond length dispersion. The DW variation related to the coordination shell (inset Fig. 11) decreases almost linearly from 6 to 14 GPa. This decrease is in agreement with the reduction in the splitting of NiO distances. A complete EXAFS analysis must be carried out to quantify this decrease. A similar drop was observed at the crossover of the thermally induced insulator–metal transition in NdNiO3
(Piamontezeet al., 2005a).
All local experimental evidence coming from XAS suggests a coherent description of the pressure-induced process leading to the insulator–metal transition in YNiO3at room
tempera-ture. In a first regime of compression, the largest distorted Ni site shrinks, while the smallest one remains almost unchanged, until symmetrization at the critical pressure of 13 GPa. At this pressure all NiO6 octahedra then become roughly
equivalent, charge delocalization takes place and the system becomes metallic at room temperature. The additional pres-sure effect is limited to an overall bond length reduction, with a decreased compressibility.
5. Summary
An overview of the EDXAS beamline implemented at the Brazilian Synchrotron Light Laboratory has been given. The choice of the optics and detection scheme has been deter-mined by the bending-magnet source characteristics. The optics, mirror and monochromator, very close to the source, have the advantage that a large angular beam acceptance can be collected by the monochromator. Moreover, a few number of optical elements and short distances are favorable to produce a very stable beam. The large source size and a maximum demagnification of the order of 10 impose the size of the focused beam, which is typically 250mm200mm. The
focus dimension is not limited by aberrations from the bent crystal but by the source size. This focus is quite large compared with facilities installed at higher-energies/lower-emittances synchrotron sources. The ODE beamline at Soleil utilizes a similar optics to produce a focus of 40mm40mm.
At ID24 at ESRF, the beam size can be as small as 5mm 5mm, which opens the possibility of micrometer mapping of
inhomogeneous samples. A modified CCD detector that uses a fluorescence screen to convert X-rays into visible photons has been optimized to match the photon flux conditions. Typical acquisition times from 10 ms to 500 ms are achieved in most experiments.
In this paper two scientific cases related to strongly corre-lated metal oxides have been shown. In the first case, the magnetic properties of Cr-doped manganites were investi-gated by XMCD experiments. The preliminary results suggest that at least part of Cr spins are randomly distributed within the system or antiferromagnetically coupled to Mn3+spins.
These results demonstrate the feasibility of experiments on
diluted light metal elements in strongly absorbing compounds. In a second case study, a high-pressure diamond anvil cell was
used to induce the metallic phase in YNiO3 at room
temperature. The insulator–metal transition of YNiO3under
normal atmospheric conditions is 580 K and the effect of pressure is to reduce the structural distortion, decreasing the transition temperature. Much experimental evidence has been gathered providing a coherent local structural description across the IM transition. The stable 250mm200mm beam
matches very well the diamond anvil cell for experiments in the pressure range up to 20 GPa.
The EDXAS beamline has proved to be a valuable tool for a variety of material science studies. The instrumentation has been used to investigate magnetic materials,via XMCD experiments, electrochemical and catalytic reactions and phase transitions under pressures up to 20 GPa, covering the fields of similar existing EDXAS facilities around the world. Owing to the LNLS storage ring characteristics, which are mostly a soft X-ray machine with a critical energy of 2.08 keV, the energy range covered by the beamline, from 4 to 14 keV, suffers from a limited photon flux. Nevertheless, the fluores-cence screen was optimized to gain in quantum efficiency and this is not the most serious limitation. The quite large emit-tance, however, imposes a focused beam of 150mm (FWHM),
or 250mm (full beam), and limits the highest attainable
pressure using diamond anvil cells. It can also be a dramatic limitation when samples are inhomogeneous. On the other hand, the possibility of being very close to the source and the simplicity of the optics, with few optical elements, leads to a good stability over long periods.
We acknowledge the LNLS technical staff. Special thanks to Milton Rocha for providing technical drawings. This work is partially supported by LNLS/ABTLuS/MCT and FAPESP (1999/12330-6). JCC, NMSN and AYR acknowledge the grants from FAPESP, CAPES and CNPq, respectively.
References
Acosta-Alejandro, M., Mustre de Leo´n, J., Medarde, M., Lacorre, P., Konder, K. & Montano, P. (2008).Phys. Rev. B,77, 085107. Alonso, J. A., Garcı´a-Mun˜oz, J. L., Ferna´ndez-Dı´az, M. T., Aranda,
M. A. G., Martı´nez-Lope, M. J. & Casais, M. T. (1999).Phys. Rev. Lett.82, 3871–3874.
Alonso, J. A., Martı´nez-Lope, M. J., Casais, M. T., Garcı´a-Mun˜oz, J. L. & Ferna´ndez-Dı´az, M. T. (2000).Phys. Rev. B,61, 1756–1763. Azimonte, C., Cezar, J., Granado, E., Huang, Q., Lynn, J., Campoy, J.,
Gopalakrishnan, J. & Ramesha, K. (2007). Phys. Rev. Lett. 98, 017204.
Baudelet, F., Dartyge, E., Fontaine, A., Brouder, C., Krill, G., Kapler, J. P. & Piecuch, M. (1991).Phys. Rev. B,43, 5857–5866.
Bernardi, F., Alves, M., Scheeren, C., Dupont, J. & Morais, J. (2007).J. Electron Spectrosc. Relat. Phenom.156–158, 186–190.
Bernardi, F., Alves, M. C. M., Traverse, A., Silva, D. O., Scheeren, C. W., Dupont, J. & Morais, J. (2009).J. Phys. Chem. C,113, 3909–
3916.
Dartyge, E., Depautex, C., Dubuisson, J. M., Fontaine, A., Jucha, A., Leboucher, P. & Tourillon, G. (1986).Nucl. Instrum. Methods Phys. Res. A,246, 452–460.
Deisenhofer, J., Paraskevopoulos, M., Krug von Nidda, H.-A. & Loidl, A. (2002).Phys. Rev. B,66, 054414.
Ferreira, F. F., Correa, H. P. S., Orlando, M. T. D., Passamai, J. L., Orlando, C. G. P., Cavalcante, I. P., Garcia, F., Tamura, E., Martinez, L. G., Rossi, J. L. & de Melo, F. C. L. (2009).J. Synchrotron Rad.16,
48–56.
Garcı´a-Mun˜oz, J., Amboage, M., Hanfland, M., Alonso, J. A., Martinez-Lope, M. J. & Mortimer, R. (2004). Phys. Rev. B, 69,
094106.
Garcı´a-Mun˜oz, J. L., Rodrı´guez-Carvajal, J., Lacorre, P. & Torrance, J. B. (1992).Phys. Rev. B,46, 4414–4425.
Godoi, D. R. M., Perez, J. & Villullas, H. M. (2009).J. Phys. Chem. C,
113, 8518–8525.
Guo, G. Y. (1998).Phys. Rev. B,57, 10295–10298.
Itie, J. P., Polian, A., Calas, G., Petiau, J., Fontaine, A. & Tolentino, H. (1989).Phys. Rev. Lett.63, 4–8.
Koch, A. (1994).Nucl. Instrum. Methods Phys. Res. A,348, 654–658. Lacorre, P., Torrance, J. B., Pannetier, J., Nazzal, A. I., Wang, P., Huang, T. & Siemens, R. (1991).J. Solid State Chem.91, 225–237.
Lin, L., Tavares, P. F. & Tosin, G. (2001).IEEE Proc.5, 2701.
Mathon, O., Baudelet, F., Itie´, J.-P., Pasternak, S., Polian, A. & Pascarelli, S. (2004).J. Synchrotron Rad.11, 423–427.
Meneses, C., Flores, W. & Sasaki, J. (2007).Chem. Mater.19, 1024–
1027.
Meneses, C. T., Flores, W. H., Sotero, A. P., Tamura, E., Garcia, F. & Sasaki, J. M. (2006).J. Synchrotron Rad.13, 468–470.
Morales, L., Allub, R., Alascio, B., Butera, A. & Caneiro, A. (2005). Phys. Rev. B,72, 132413.
Morales, L. & Caneiro, A. (2003).J. Solid State Chem.170, 404–410. Morales, L., Rodriguez-Carvajal, J. & Caneiro, A. (2004).J. Alloys
Compd.369, 97–100.
Morales, L., Zysler, R. & Caneiro, A. (2008).J. Solid State Chem.181, 1824–1832.
Neuenschwander, R. T. & Tavares, W. S. (2001). Internal Technical Communication. Internal Technical Note, LNLS, Campinas, SP, Brazil.
Neuenschwander, R. T. & Tolentino, H. C. N. (2004).AIP Conf. Proc.
705, 647–650.
Pascarelli, S., Mathon, O. & Aquilanti, G. (2004).J. Alloys Compd.
362, 33–40.
Pettifer, R. F., Mathon, O., Pascarelli, S., Cooke, M. D. & Gibbs, M. R. J. (2005).Nature (London),435, 78–81.
Phizackerley, R. P., Rek, Z. U., Stephenson, G. B., Conradson, S. D., Hodgson, K. O., Matsushita, T. & Oyanagi, H. (1983).J. Appl. Cryst.16, 220–232.
Piamonteze, C., de Groot, F. M. F., Tolentino, H. C. N., Ramos, A. Y., Massa, N. E., Alonso, J. A. & Martı´nez-Lope, M. J. (2005a).Phys. Rev. B,71, 020406.
Piamonteze, C., Tolentino, H. C. N., Ramos, A. Y., Massa, N. E., Alonso, J. A., Martı´nez-Lope, M. J. & Casais, M. T. (2005b).Phys. Rev. B,71, 012104.
Pizzini, S., Fontaine, A., Giogetti, C., Dartyge, E., Bobo, J.-F., Piecuch, M. & Baudelet, F. (1995).Phys. Rev. Lett.74, 1470–1473. Ramirez, A. (1997).J. Phys. Condens. Matter,9, 8171–8199. Ramos, A. Y., Tolentino, H. C. N., Souza-Neto, N. M., Itie´, J. P.,
Caneiro, A. & Morales, L. (2007).Phys. Rev. B,75, 052103. Rodrigues, A. R. D., Craievich, A. F. & Gonc¸alves da Silva, C. E. T.
(1998).J. Synchrotron Rad.5, 1157–1161.
Souza-Neto, N. M., Ramos, A. Y., Tolentino, H. C. N., Martins, A. & Santos, A. D. (2006).Appl. Phys. Lett.89, 111910.
Stewart, S., Figueroa, S., Sturla, M., Scorzelli, R., Garcia, F. & Requejo, F. (2007).Physica B,389, 155–158.
Subias, G., Garcia, J., Proietti, M. & Blasco, J. (1997).Phys. Rev. B,56,
8183–8191.
Sun, Y., Tong, W., Xu, X. & Zhang, Y. (2001). Phys. Rev. B, 63,
174438.
Tolentino, H. C. N., Cezar, J. C., Souza-Neto, N. M. & Ramos, A. Y. (2005a).J. Synchrotron Rad.12, 168–176.
Tolentino, H. C. N., Cezar, J. C., Watanabe, N., Piamonteze, C., Souza-Neto, N. M., Tamura, E., Ramos, A. & Neueschwander, R. (2005). Phys. Scr.T115, 977–979.
Tolentino, H., Dartyge, E., Fontaine, A. & Tourillon, G. (1988). J. Appl. Cryst.21, 15–22.