*e-mail: lgallego@ipen.br
Study of the Crystal Structure of the High Tc Superconductor
Hg
1-xRe
xBa
2Ca
2Cu
3O
8+δby Using EXAFS, XANES and XRD
Luis Gallego Martineza*, Jesualdo Luiz Rossia, Marcos Tadeu D’Azeredo Orlandob,
Carlos Augusto Cardoso Passosb, Hamilton Perez Soares Corrêac
a
Materials Science and Technology Centre,
Nuclear and Energy Research Institute – IPEN, CNEN, 05508-900 São Paulo - SP, Brazil
b
Federal University of Espírito Santo – UFES, Vitória - ES, Brazil
cFederal University of Mato Grosso do Sul – UFMS, Campo Grande - MS, Brazil
Received: March 21, 2007; Revised: April 22, 2008
Hg based superconducting ceramics present the highest critical temperatures ever reported, particularly the phase 1223 with the highest Tc so far obtained –135 K. However, these compounds are obtained by a complex synthesis route and suffer degradation at ambient atmosphere. This disadvantage may be overcome by doping
with an appropriate amount of Re. Samples of nominal composition Hg0.82Re0.18Ba2Ca2Cu3O8+δ having different
oxygen contents were studied by X ray absorption and diffraction techniques. Using XANES we determined the Re valence = +7 in an octahedral distorted coordination. We determined the distances of Re-O bonds (1.85 Å and 2.10 Å) by EXAFS. XRD Rietveld fits showed segregation of two superconducting phases with distinct lattice parameters. The main phase is associated with Hg, Re-1223 with higher oxygen content, and the secondary superconducting phase is related to undoped Hg-1223.
Keywords: high Tc superconductor, XRD, EXAFS, XANES, Rietveld
1. Introduction
Since the discovery of high Tc superconductors by Bednorz and
Muller1 in La-cuprate system, several other families of ceramic
su-perconductors were produced. In 1993, Putilin et al.2 obtained a new
family, namely, HgBa2Can-1CunOy (n = 1,2,3...), which presented the
highest Tc (134 K) ever reported. When exposed to ambient atmos-phere this Hg-cuprate system loses its superconducting properties
due to CO2 contamination, however this problem has been overcome
by partial substitution of mercury by rhenium3. Clearly the presence
of Re increases the amount of oxygen in the HgO layer, because
of its higher valence3. These additional oxygen atoms stabilize the
mercury layer. Namely, samples with 18% nominal atomic Re content presented an improvement of the superconducting properties, such
as the critical current density, when compared to HgBa2Ca2Cu3Oy,
Hg-1223 without Re3.
The crystal structure of Hg,Re-1223 has been intensively
stud-ied by some authors4 and discrepant results have been reported. For
instance the term δ in the stoichiometry of oxygen - one of the most
important parameters in all ceramic high Tc superconductors - is still
matter of discussion4.
In this work we studied three different samples of
Hg1-xRexBa2Ca2Cu3O8+δ with 18% nominal content of Re and
dif-ferent oxygen contents, obtained by means of difdif-ferent oxidation treatments during the synthesis process. In order to study the crystal structure of the samples we employed different techniques such as X ray Absorption Near Edge Structure (XANES), Extended X ray Absorption Fine Structure (EXAFS) and X ray Diffraction (XRD) with application of Rietveld analysis in order to fully characterize the crystallography of the compounds. The techniques revealed to
be useful and complementary to one another allowing the determina-tion of the valence of Re cadetermina-tions in the samples, Re-O coordinadetermina-tion and bond lengths. These results were used as input to the Rietveld analysis of XRD data.
The resulting Rietveld fits show the segregation in two super-conducting phases with slight different cell parameters and different contents of rhenium and oxygen, in addition to other minor residual phases due the incomplete synthesis. The superconducting phases were classified as one main oxygen and rhenium rich phase and an additional rhenium free and oxygen poor phase.
2. Experimental
Three samples of Hg0:8Re0:2Ba2Ca2Cu3O8.7+δ, with δ values equal
to 0, 0.10 and 0.15, labeled as A, B and C, respectively, were prepared
as described elsewhere 4. Rietveld analysis of X ray diffraction (XRD)
data was performed with the purpose of completing our previous
study3,5. The X ray diffraction measurements were carried out in
conventional laboratory diffractometers as well as in the X ray Powder Diffraction beamline, D10B-XPD, of the Brazilian Synchrotron Light Laboratory (LNLS), located at Campinas, Brazil. Conventional XRD
measurements employed Cu Kα radiation and the synchrotron
meas-urements where performed also at an energy close to the rhenium LIII
absorption edge, where the rhenium scattering factor is higher due to anomalous scattering. The spectra were measured from 2° to 122° in
2 with 0.01° step scan. The instrumental parameters were obtained
from the fitting procedure applied to standard LaB6 and Al2O3 samples
(NIST-Standard Reference Materials) at each energy. Rietveld fits
Absorption measurements were also made at the Brazilian Syn-chrotron Light Laboratory (LNLS) using the X ray absorption
spec-troscopy beamline D04B-XAS. The Re LIII absorption edge spectra
at 10.535 keV were measured from 10.400 keV up to 11.400 keV, in 1 eV steps in the XANES region and 2.5 eV steps in the EXAFS region. The absorption data were analyzed using of the programs
FEFF and FEFFIT8,9
3. Results and Discussion
XANES study consisted in comparing the known valences of Re cations in elementary Re and two different rhenium oxides with the
energy of its LIII absorption edges, in order to establish the calibration
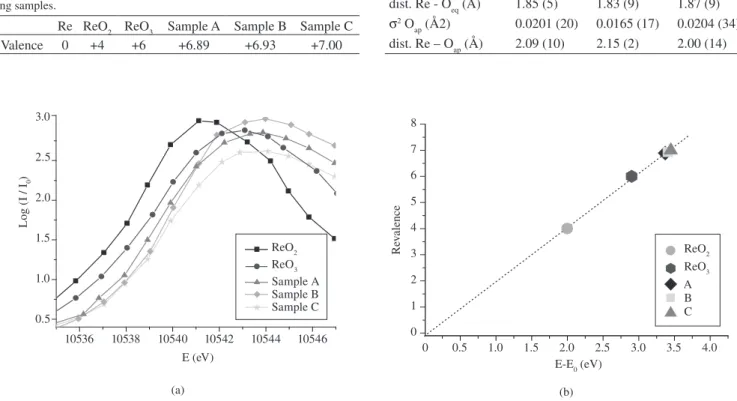
curve to be applied to the Re edge energy of the superconducting samples, thus inferring its valence in the compound. Figure 1a shows
details of the top of Re absorption edges in the oxides ReO2, ReO3
and in samples A, B and C of the compound. Figure 1b shows the values of valence versus edge displacement in elementary Re and in Re oxides. It allowed us to determine a linear calibration curve, which was used to estimate the valence of Re in the superconducting samples, as presented in Table 1.
The values of valence for the samples are in agreement with the
one estimated by Chmaissem10 for a similar sample, using the Bond
Valence Method, namely, 6.8511.
As the intensity of X ray scattering by an atom is proportional to the square of its atomic number, the intensity of the X rays scattered by basal planes of Hg, Re superconductors is mainly determined by
the heavy cations. Thus, the contribution of anions O2– in the basal
planes to XRD reflections is too small to be able to give information about its atomic positions, vibrations and occupations. In order to overcome this difficulty we employed EXAFS, a short range tech-nique suitable to supplying information about the local coordina-tion around the absorbing atom. The structural model for EXAFS
calculation was implemented by the programs ATOMS and FEFF8,9,
using the values of the cell parameters, the space group and a model
for the atomic positions reported in literature4,5,10 as initial inputs.
The analysis was carried out on the same spectra used for XANES, however using the far region above the absorption edge (from 30 to 1000 eV above the edge). For EXAFS analysis we employed the
program ATOMS9 for calculating the scattering paths, the program
AUTOBK for background corrections and the program FEFF to calculate scattering amplitude, angles and phases for each scattering path. The program FEFFIT performed the adjustment between the calculated and measured data. The results for the two first coordina-tion shells are shown in Table 2.
Re-O bond lengths indicate a distorted octahedral coordination
with C4V symmetry, similar to that found in ReO3 under isostatic
pressure4. In order to confirm the reliability of the EXAFS results
we applied the Bond-Valence Method11 to calculate the valences for
the bond distances obtained and the results were very similar to those presented in Table 1, showing the coherence of the method.
In the Rietveld analysis we at first found difficulties in adjusting the profile function using only one superconducting phase, due to a strong asymmetry in the 001 reflection, as shown in Figure 2a, b and c. However, when using high resolution Synchrotron diffraction it was observed that that asymmetry was actually a convolution of two very close peaks, as can be seen in Figure 2d.
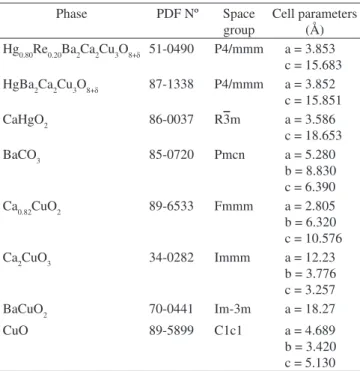
The double peak led us to propose the co-existence of two super-conducting phases with a small difference in parameter c. In order to take it into account we introduced a second superconducting phase together with other residual phases, as shown in Table 3.
Table 1. Re valence in elementary and Re oxides and in the superconduct-ing samples.
Re ReO2 ReO3 Sample A Sample B Sample C
Valence 0 +4 +6 +6.89 +6.93 +7.00
(a) (b)
Figure 1. a) details of the Re LIII absorption edges in ReO2, ReO3 oxides and in the samples A, B and C; and b) valences of Re in the samples of the Hg,Re-1223, B and C, determined from the LIII e absorption edge displacements.
10536 10538 10540 10542 10544 10546
0.5 1.0 1.5 2.0 2.5 3.0
E (eV)
L
og (
I / I
0
)
Sample A Sample B Sample C ReO2 ReO3
0.5 1.0 1.5 2.0 2.5 3.0 3.5 4.0
0 0 1 2 3 4 5 6 7 8
ReO3 A B C ReO2
E-E0 (eV)
Re
valence
Table 2. Results from the EXAFS analysis for the first and second coordina-tion shells: Oeq are the equatorial oxygens (in the basal plane) and Oap are the apical ones (in the 00l direction)4.
Sample A Sample B Sample C
σ2 O
eq (Å2) 0.0155 (9) 0.0137 (17) 0.0157 (13)
dist. Re - Oeq (Å) 1.85 (5) 1.83 (9) 1.87 (9)
σ2 O
ap (Å2) 0.0201 (20) 0.0165 (17) 0.0204 (34)
(a)
(c)
(b)
(d)
Table 3. Identified phases according to Powder Diffraction File - PDF- ICDD
Phase PDF Nº Space
group
Cell parameters (Å)
Hg0.80Re0.20Ba2Ca2Cu3O8+δ 51-0490 P4/mmm a = 3.853
c = 15.683
HgBa2Ca2Cu3O8+δ 87-1338 P4/mmm a = 3.852
c = 15.851
CaHgO2 86-0037 R3m a = 3.586
c = 18.653
BaCO3 85-0720 Pmcn a = 5.280
b = 8.830 c = 6.390
Ca0.82CuO2 89-6533 Fmmm a = 2.805
b = 6.320 c = 10.576
Ca2CuO3 34-0282 Immm a = 12.23
b = 3.776 c = 3.257
BaCuO2 70-0441 Im-3m a = 18.27
CuO 89-5899 C1c1 a = 4.689
b = 3.420 c = 5.130
0 20 40 60 80 100 120
0 2000 4000 6000 8000 10000 12000 14000 16000 18000
Angle (2 )
Intensity (count)
(HgRe-A)
0 20 40 60 80 100 120
0 5000 10000 15000 20000 25000 30000 35000 40000
In
te
ns
ity
(c
ou
nt
)
Angle (2 )
(HgRe-B)
0 20 40 60 80 100 120
0 5000 10000 15000 20000 25000
(HgRe-C)
In
te
ns
ity
(c
ou
nt
)
Angle 2
5.48 5.51 5.54 5.57 5.60 5.63 5.66 5.69 5.72 5.75 5.78 2300
2000
1700
1400
1100
800
500
200
Angle 2
Intensity (a.u.)
Sample B - LNLS
Figure 2. XRD for the samples a) A, b) B and c) C with Cuk-α radiation and d) detail of the 001 reflection using high resolution Synchrotron diffraction.
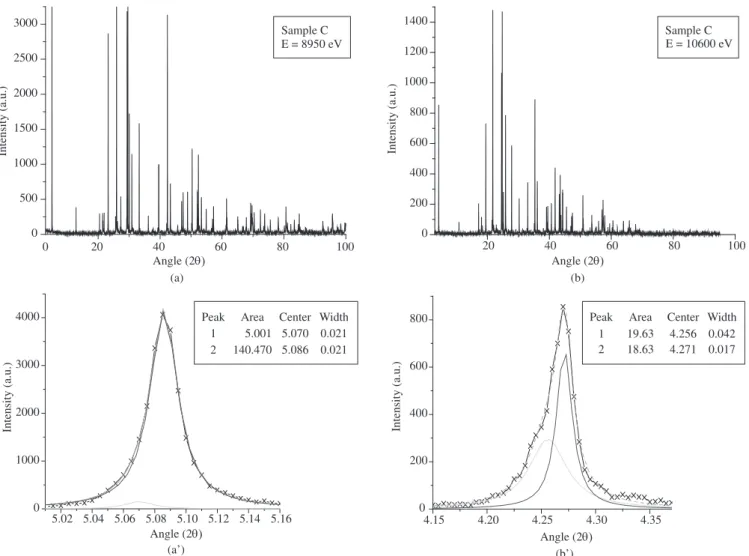
By means of high resolution anomalous synchrotron diffraction
at the Re LIII edge energy, we confirmed the presence of two phases
with different contents of Re, as can be seen in Figure 3.
The Rietveld analysis of XRD data was performed by fixing the oxygen co-ordination around Re (values obtained by EXAFS) while refining all other parameters. The details of the analysis method are
described in Martinez4. The main results are shown in Table 4. The
Rietveld plot and the crystal structure of one of the samples are shown in Figure 4.
These results allowed the explanation of intrinsic superconduct-ing properties of these Hg,Re-1223 compounds in terms of their
crystal structures13.
4. Conclusions
The Rietveld analysis, applied to conventional, synchrotron or neutron diffraction, is considered a very important tool in the study of crystal structures of materials. However, in some cases, powder diffraction analysis alone is not enough to solve intricate structures. The use of combined techniques is essential to the resolution of the crystal structure of a complex compound, as in this case, for instance. In cases like this one, the application of different techniques, in a complementary way, is necessary in order to fully characterize a
ap-Table 4. Main results of Rietveld fits for the samples A, B and C.
Parameters Sample A Sample B Sample C
%mass phase Hg,Re-1223 61.4 68.7 50.3
%mass phase Hg-1223 16.1 14.7 30.8
%mass superconducting phases 77.5 83.4 81.1
%mass residual phases 22.5 16.6 19.0
Parameter a phase Hg,Re-1223 (Å) 3.8545 3.8541 3.8544
Parameter c phase Hg,Re-1223 (Å) 15.6874 15.6881 15.6891
c/a phase Hg,Re-1223 4.070 4.070 4.070
Unit cell vol. phase Hg,Re-1223 (Å3) 233.072 233.035 233.082
Angle Cu-O-Cu phase Hg,Re-1223 (º) 176.92 179.93 178.33
O Stoichiometry δ phase Hg,Re-1223 8.707 8.747 8.752
Occupation Hg phase Hg,Re-1223 0.738 0.749 0.749
Occupation Re phase Hg,Re-1223 0.177 0.187 0.188
Occupation site 000 phase Hg,Re-1223 0.915 0.936 0.937
Parameter a phase Hg-1223 (Å) 3.8543 3.8535 3.8543
Parameter c phase Hg-1223 (Å) 15.6988 15.7016 15.6928
c/a phase Hg-1223 4.073 4.075 4.071
Unit cell vol. phase Hg-1223 (Å3) 233.215 233.163 233.129
Chi2 1.936 3.268 2.330
Rwp 0.0441 0.0399 0.0461
Rp 0.0346 0.0307 0.0359
DWd 1.040 1.247 0.888
RF2 0.0615 0.0503 0.0514
20 40 60 80 100
0 0 500 1000 1500 2000 2500 3000
5.02 5.04 5.06 5.08 5.10 5.12 5.14 5.16 0
1000 2000 3000 4000
Intensity (a.u.)
Intensity (a.u.)
Area
Peak Center Width
140.470
2 5.086 0.021
5.001
1 5.070 0.021
Area 19.63 18.63 Peak
1 2
Center 4.256 4.271
Width 0.042 0.017
Angle (2 Angle (2
Angle (2 Angle (2
Sample C E = 8950 eV
20 40 60 80 100
0 200 400 600 800 1000 1200 1400
4.15 4.20 4.25 4.30 4.35
0 200 400 600 800
Intensity (a.u.)
Sample C E = 10600 eV
Intensity (a.u.)
(a) (b)
(a’) (b’)
Figure 4. Rietveld plot and corresponding calculated unit cell for sample A.
plication of different techniques of X ray diffraction (normal and anomalous scattering) and absorption (XANES and EXAFS) allowed a good characterization of the crystal structures of Hg,Re-1223 su-perconducting compounds with different oxygen contents and this procedure can be certainly considered as a viable way to solve other complex crystallographic structures.
Acknowledgements
The authors would like to acknowledge Dr. I. P. Cavalcante for the careful revision of the manuscript and suggestions. C. A. C. Passos acknowledges the Post-Doctoral Program for Young Scientists (CNPq #150824/2007-6).
References
1. Bednorz JG, Müller KA. Possible high T superconductivity in the Ba-La-Cu-O system. Journal Zeitschrift für Physik B Condensed Matter
1986; 64(2):189-193.
2. Putilin, S. N., Antipov, E. V., Chmaissen, O., Marezio, M. Superconductivity at 94 K in HgBa2CuO4+delta. Nature 1993; 362(6417):226-228.
3. Orlando MTD, Cunha AG, Budko SL, Sin A, Martinez LG, Vanoni W, Belich H, Obradors X, Emmerich FG, Baggio-Saitovitch E. Hg0.95Re0.05Ba2Ca2Cu3O8+x superconductor:sample preparation and transport properties under hydrostatic pressure. Superconductor Science & Technology 2000; 13:140-147.
4. Martinez LG. Estudo da Estrutura Cristalina do Composto Supercondutor Hg1-xRexBa2Ca2Cu3O8+δ. [Ph.D. Thesis]. São Paulo:IPEN/USP; 2005 (in
portuguese).
5. Orlando MTD, Sin A, Alsina F, Cunha AG, Mestres N, Calleja A, et al. Effects of re-doping on superconducting properties and formation of Hg-1223 superconductors. Physica C 1999; 328(3-4):257-269.
6. Larson AC, Von-Dreele RB. General Structure Analysis System (GSAS).
Los Alamos National Laboratory Report - LAUR; 2004. p. 86-748.
7. Toby BH. EXPGUI, a graphical user interface for GSAS. Journal of Applied Crystallography 200; (34):210-213.
8. Ravel B. Introduction to EXAFS Analysis Using Theoretical Standards. 2001 [Online] [cited 2008/05/21]. Available from:http://leonardo.phys. washington.edu/~ravel/talks/course/ieauts.pdf
9. Ravel B. ATOMS:crystallography for the X ray absorption spectroscopist. Journal of Synchrotron Radiation 2001; (8):314-316.
10. Chmaissem O, Huang Q, Antipov EV, Putilin SN, Marezio M, Loureiro SM, Capponi JJ, Tholence JL, Santoro A. Neutron powder diffraction study at room temperature and at 10K of the crystal structure of the 133K superconductor HgBa2Ca2Cu3O8+δ. Physica C 1993; 217(3-4):265-272.
11. Brown ID, Altermatt D. Bond-valence parameters obtained from a systematic analysis of the inorganic crystal structure database. Acta Crystallographica 1985; B41:244-247.
12. Orlando MTD, Martinez LG, Correa HPS. Strucutral parameters as a function of the Oxygen Content in (Hg;Re) – 1223. [CD-Rom]. Campinas, Brazil:LNLS Activity Report Science Highlights 2003; Brazilian Synchrotron Light Laboratory; 2003. p. 311-312.
13. Passos CAC, Orlando MTD, Passamai JL, Mello EVL, Martinez LG. Resistivity study of the pseudogap phase for (Hg,Re)-1223 superconductors. Physical Review B. Condensed matter and materials physics 2006; 74(9):94514.1-94514.10.
(a)
(b)
A−FINAL1 cycle 1421 Hist 1
Angle (2
50 100
Intensity
0 10000
Hg Re Ca Ba Cu O c


