ii AMINO ACID METABOLISM AND THE PRODUCTION OF WINE AROMA
COMPOUNDS BY Saccharomyces cerevisiae
Thesis presented to Escola Superior de Biotecnologia of the Universidade Católica Portuguesa to fulfill the requirements of Master of Science degree in Food Science,
Technology and Nutrition
by
Leandro Dias Araújo
Place: Escola Superior de Biotecnologia – Universidade Católica Portuguesa
Supervision: José António Gomes Couto António César da Silva Ferreira
iii
1. Resumo
Os produtos do metabolismo de aminoácidos por leveduras Saccharomyces cerevisiae durante a fermentação alcoólica têm um impacto relevante no perfil sensorial de vinhos. Com o objetivo de estudar a influência da composição de aminoácidos do meio na formação da base do aroma típico de vinho, meios sintéticos contendo diferentes compostos nitrogenados foram fermentados por S. cerevisiae. Em um primeiro experimento, cinco meios de composições distintas quanto à fonte de azoto foram testados, sendo: A – amônia; C – hidrolisado de caseína; AC – amônia e hidrolisado de caseína; AP – amônia e aminoácidos preferenciais (arginina, asparagina, ácido aspártico, glutamina e ácido glutâmico); AA – amônia e aminoácidos precursores de aromas (isoleucina, leucina, fenilalanina, tirosina e valina). Diferenças significativas foram encontradas para 1-propanal, 1-butanol, 2-metil-1-propanol, 2-metil-1-butanol, 3-metil-1-butanol, 2-feniletanol, acetato de isoamilo e acetato de feniletilo, sendo a amostra AA a apresentar as concentrações mais elevadas. A análise de componentes principais e de agrupamento mostrou que a amostra AA se diferencia bastante em relação às demais, se correlacionando positivamente com o primeiro componente principal. Também na avaliação sensorial, a amostra AA obteve valores mais elevados para intensidade aromática, aroma frutado e floral. Esta amostra também obteve o maior valor para o caráter típico de vinho, apesar de não haver diferença significativa (p>0,05) com outras amostras. Na amostra AP foram detectados aromas associados a compostos sulfurados. Foi realizado um segundo experimento onde os meios continham amônia e aminoácidos precursores de aroma, sendo que cada amostra era deficiente em um dos aminoácidos testados. Diferenças significativas foram encontradas para propanol, 1-butanol, 2-metil-1-propanol, 2-metil-1-1-butanol, 3-metil-1-1-butanol, 2-feniletanol e acetato de feniletilo. A amostra A, fermentada apenas com amônia, teve, de um modo geral, as concentrações mais baixas destes compostos. Amostras deficientes em fenilalanina (A e F) e isoleucina (A e D) tiveram teores mais baixos dos produtos diretos do catabolismo dos aminoácidos – feniletanol e acetato de feniletilo e de 2-metil-1-butanol, respectivamente. O mesmo comportamento não foi observado nas demais amostras. A análise de componentes principais e de agrupamento mostrou a amostra A isolada, relacionando-se negativamente com o primeiro componente principal (41,26%) e com todos os compostos, exceto etanal. A análise sensorial mostrou um maior equilíbrio entre as amostras, sem grandes diferenças entre elas,
iv mostrando não haver impacto relevante da ausência de algum dos aminoácidos precursores de aroma na caracterização sensorial do vinho. Os resultados de ambos os experimentos demostraram que o perfil de aminoácidos do meio é um fator determinante da base aromática do vinho.
v
2. Abstract
The amino acid metabolism by Saccharomyces cerevisiae during alcoholic fermentation has relevant impact on wine aroma sensory profile. This work had as main objective the study the role of the amino acid composition on the production of a fermented wine-like solution. For this, 5 synthetic media containing different nitrogen sources were fermented by S. cerevisiae and the resulting wines were analyzed: A – ammonia; C – casein amino acids; AC – ammonia and casein; AP – ammonia and preferred amino acids (arginine, asparagine, aspartic acid, glutamine and glutamic acid); AA – ammonia and aroma precursor amino acids (isoleucine, leucine, valine, phenylalanine and tyrosine). Significant differences were found for 1-propanal, 1-butanol, 2-methyl-1-propanol, 2-methyl-1-butanol, 3-methyl-1-butanol, 2-phenylethanol, isoamyl acetate and phenylethyl acetate. The sample AA had the highest values for all these compounds. PCA and clustering analysis separated sample AA from the others, in a positive correlation to the first PC. The sensory evaluation corroborates with the chemical analysis with sample A having the higher scores for aromatic intensity, fruity and floral aromas. It also had the highest value for wine-like character, although no significant difference was observed (p>0,05). Sample AP had the highest score for sulphur compounds aromas. A second experiment was conducted with samples containing ammonia and aroma precursor amino acids, in which each sample lacked one of the tested amino acids. Significant differences were found for 1-propanol, 1-butanol, 2-methyl-1-propanol, 2-methyl-1-butanol, 3-methyl-1-butanol, 2-phenylethanol and phenylethyl acetate. Sample A, fermented only with ammonia as single source of nitrogen, had in general the lower concentration of these compounds. Samples deficient in phenylalanine (A and F) and isoleucine had, respectively, lower concentrations of their metabolic products, phenylethanol and phenylethyl acetate, and 2-methyl-1-butanol. This behavior was not observed for the other samples. PCA and clustering analysis showed that sample A was isolated from the others, negatively related with PC1 (41,26%) and to the chemical compounds, except for ethanal. Sensory evaluation didn‟t show substantial differences among samples, evidencing the lack of relevant influence of the absence of one aroma precursor amino acid on the wine sensory profile. The results from both experiments lead to the conclusion that the medium amino acid composition is a determinant factor affecting wine aroma.
vi
3. Acknowledgements
I wish to express my sincere gratitude and appreciation to all persons that contributed to this achievement:
To my family, for all the support and love;
To my fiancée, Jessica, for the many years of dedication, care, love and support and to the Suda family;
To Professor José António Gomes Couto and Professor António César da Silva Ferreira, for the invaluable orientation;
To engineer Cristina Santos, for all her help with the GC and HPLC analysis; To Sefotech.nut master program coordination, Dr. Monika Polanska and Professor Chris Van Keer;
To all my friends from the Sefotech batch 2010-2012 - Edward, Shanti, Lydia, Carlos, Gabriela, Dagmara, Marija, Choodamani, Yemane, Rosinah, Ghulam, Sara, Andrew, Ruirui, Shivam, Janani, Rosalba, Atilim and Jelena - from Portugal – Carla, Cristiana, Joana, Jorge and Rita – and from Auckland – Mandy, Katie, Gerard and Rohan - for all the mutual help and memorable times spent together;
To Hilde Lawereys and Ilse Roelandt, for all the help and support along these two years;
To Professor Paul Kilmartin, Gerard Logan and Mandy Herbst-Johnstone, for the opportunity to work at the wine science laboratory at University of Auckland and for all the support and friendship;
To Portuguese Catholic University, including all staff, for the opportunity of completing my thesis;
To the European Commission, for the Erasmus Mundus scholarship; And, above all, to God.
vii 4. Contents 1. Resumo ... iii 2. Abstract ... v 3. Acknowledgements ... vi 4. Contents ... vii 5. Introduction ... 1 6. Literature review ... 4
6.1. Amino acids metabolism by Saccharomyces cerevisiae during alcoholic fermentation ...4
6.1.1. Amino acids synthesis ... 4
6.1.2. Amino acids consumption ... 7
6.2. Volatile compounds formed during alcoholic fermentation ... 12
6.3. Nitrogen compounds and wine aroma ... 13
7. Materials and methods ... 15
7.1. Reagents and standards... 15
7.2. Fermentations ... 15
7.3. GC analyses ... 17
7.4. Sensory evaluation ... 18
7.5. Statistical analysis ... 19
8. Results and Discussion ... 20
8.1. Experiment 1 ... 20
8.2. Experiment 2 ... 29
9. Conclusions ... 36
10. Future work ... 37
1
5. Introduction
Wine is a complex mixture of water, ethanol and minor compounds, which even in very small concentrations can define its aroma and, ultimately, its quality. Among the many factors that contributed to the typicity and quality of wine, aroma is probably the most important sensorial characteristic and a key attribute for consumers (Perestrelo et al., 2006). Meilgaard et al. (2006) define aroma as being the odor of a food product detected when its volatiles enter the nasal passage and are perceived by the olfactory system. Wine aroma can come from grapes, namely primary aromas, but as well can be formed during the winemaking process, such as during fermentation, both alcoholic and malolactic, producing secondary aromas, or aging, producing tertiary aromas (Cacho and Ferreira, 2010).
Terpenes and pyrazines are among the grape compounds important to wine aroma. Compounds belonging to the monoterpenes family, such as monoterpenols, like linalool and nerol, are very common in several grape varieties, but with very low concentrations. They are known to give floral aromas to wine, especially in Muscat and Alsacian varieties where they appear in quite high concentrations (Cacho and Ferreira, 2010). Rotundone, a sesquiterpene, was found to have a correlation with the mean „black pepper‟ aroma intensity rated by sensory panels, indicating that this compound is a major contributor to peppery characters in Shiraz grapes and wine (Wood et al., 2008). The bell pepper aroma typical to Cabernet sauvignon, Cabernet franc, Carmenère, Merlot and Sauvignon blanc are due to the presence of some methoxypyrazines, like 3-isobutyl-2-methoxypirazine (IBMP) (Polaskova et al., 2008).
Fermentation originated compounds are the major wine aroma constituent, being the alcohols the highest in concentration. Glycerol and higher alcohols are present in wine in mg/L to g/L levels. The most significant volatile alcohols are the higher alcohols, such as 1- propanol, propanol (isobutyl alcohol), 2-methyl-1-butanol, and 3-methyl-1-butanol (isoamyl alcohol), which tend to have fusel odors, whereas C6 alcohols, like hexanol and 3-hexen-1-ol, possess an herbaceous scent. The major phenol-derived alcohol, 2-phenylethanol, has a rose-like aroma (Jackson, 2002). The higher alcohols are mainly formed by the catabolism of amino acids by the yeasts via Erlich Pathway (Hazelwood et al., 2008). In lower concentrations, around 0,3 g/L, higher alcohols can contribute to wine bouquet complexity (Jackson, 2002). They usually have low sensory detection threshold values, namely 1,6 ppm to 70 ppm for
2 amyl alcohol, 250 ppb to 4,1 ppm for isoamyl alcohol and 0,015 ppb to 3,5 ppb to 2-phenylethanol (Burdok, 2002).
Esters can be formed during alcoholic fermentation and generally contribute to a fruity aroma of the wine. The two main groups of fermentation-derived esters that have been associated with wine aroma are acetate esters, like ethyl acetate, 2-methylpropyl acetate (isobutyl acetate), 2- and 3-methylbutyl acetate (active amyl and isoamyl acetate, respectively), hexyl acetate, and 2-phenylethyl acetate, and ethyl fatty acid esters (Ugliano and Henschke, 2009). Branched-chain esters as ethyl 2-methylpropanoate, ethyl 2-methylbutanoate and ethyl 3-methylbutanoate can contribute to the red-fruits notes of some red wines (Piombino et al., 2004).
Many other compounds are of relevance in wine aroma, for example some aldehydes (acetaldehyde, methanol, phenylacetaldehyde), ketones (diacetil), fatty acids (butyric, hexanoic, heptanoic, octanoic, decanoic and dodecanoic acids), wood compounds (whisky lactone, vanillin, furfural, furfuryl alcohol, 5-methyl furfural, guaiacol, linalool and others), sulphur compounds (hydrogen sulphide, dimethylsulfide, methionol, 3-mercaptohexan-1-ol, 4-mercapto-4-methylpentan-2-one).
Any wine contains great part of these compounds, but in different concentrations and proportions. Many factors can affect their balance and therefore affect the wine final quality. They start with the grape variety and the environmental conditions of the vineyard, followed by harvesting, vinification and aging procedures, and their effects can be correlated. For instance, the grape juice composition, which is tightly related to the variety and agricultural factors, as well as to the juice extraction methods, can affect the fermentation final products. The elucidation of these correlations is the subject of many studies.
The juice amino acid profile is a factor influencing the formation of aroma compounds during fermentation. Saccharomyces cerevisiae is able to use a sort of nitrogen compounds in its metabolism and the consumption of specific amino acids leads, mainly, to the formation of higher alcohols (and related esters) and acids. The concentration of these and others compounds has been shown to be correlated to the must amino acids profile and concentration (Torrea et al., 2011; Garde-Cerdán and Ancín-Azpilicueta, 2008; Hernández-Orte et al., 2006; Hernández-Orte et al., 2002; Guitart et al., 1999). The existence of all these relationships leads to the believe that the amino acid profile of a must have to be closely related to the wine content on the amino acid-related odorants and that this influence has, probably, a relevant sensory impact.
3 This research sought to establish the relation between the amino acids profile of a synthetic must and the sensory profile of a solution that could be identified as having the bases of wine aroma with subsequent characterization of the respective chemical composition. For this, synthetic grape juice solutions containing different pools of amino acids were fermented by Saccharomyces cerevisiae in a two steps experiment. The first looked over different pools containing different amino acids and nitrogen sources with the same Yeast Assimilable Nitrogen (YAN) level. The second experiment used pools containing the amino acids pointed out as the precursors of important wine aroma compounds, as higher alcohols, acids and esters.
4
6. Literature review
6.1. Amino acids metabolism by Saccharomyces cerevisiae during alcoholic fermentation
6.1.1. Amino acids synthesis
Yeasts have the capacity to synthetize most of the amino acids required for constructing its proteins. It can fix an ammonium ion on a carbon skeleton derived from the metabolism of sugars. Ammonia is usually considered to be yeast‟s preferred nitrogen source, but for many strains glutamine equally permits a maximal rate of growth (Dickinson, 2004).
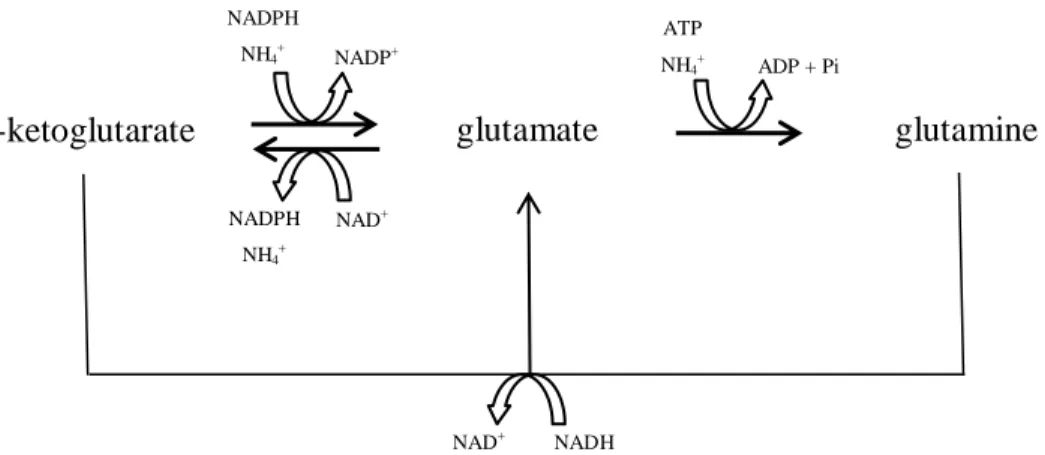
The intersection formed by ammonia and glutamate is essential for the biosynthesis of 16 amino acids. Glutamate is formed through ammonia and -ketoglutarate, derived from the citric acid cycle (TCA). The yeast can associate ammonia to glutamate and produce glutamine (Fig. 1). Through transamination reactions, glutamate then serves as an amino group donor in the biosynthesis of different amino acids. The carbon skeleton originates from glycolysis intermediary products (pyruvate, 3-phosphoglycerate, phosphoenolpyruvate), the TCA (-ketoglutarate, oxaloacetate) or the pentose phosphate cycle (ribose 5-phosphate, erythrose 4- phosphate) (Ribéreau-Gayon et al., 2006a).
Glutamate is converted into proline; it is used to produce aspartate which gives rise to threonine, methionine and cysteine; it is used to produce tyrosine, phenylalanine, serine, leucine, isoleucine, valine and histidine and is essential in the biosynthesis of lysine and arginine. Some of the amino acids synthetic pathways can be very simple, as the formation of aspartate by transamination of glutamate into oxaloacetate, but also can be more complex, as the formation of cysteine (Fig. 2).
According to Ribéreau-Gayon et al. (2006a), the amino acids can be classified into six biosynthetic families according to their carbon skeleton origin and their nature:
-ketoglutarate glutamate glutamine, proline, arginine
Oxaloacetate aspartate asparagine, lysine, threonine ( isoleucine), methionine ( homocysteine)
3-phosphoglycerate Serine with homocysteine forms cystathionine ( cysteine), Glycine
Ribose 5-phosphate histidine
5
Phosphoenolpyruvate, erythrose 4-phosphate phenylalanine, tyrosine, tryptophane glutamate glutamine NADPH NH4+ NAD+ ADP + Pi ATP NH4+ NADPH NH4+ NADP+ -ketoglutarate NAD+ NADH
Figure 1 - The -ketoglutarate – glutamate – glutamine node of amino acid metabolism
6 H2S Acetate homocysteine L-serine H2O H2O Phosphate L-threonine Acetaldehyde L-glycine H2O + 5,10-methylene-THF THF L-serine o-phospho-L-homoserine o-acetil-L-homoserine Pyruvate ATP + HCO3 -ADP + Pi Oxaloacetic acid L-aspartate L-glutamate 2-Oxoglutarate homoserine ATP
ADP Acetyl-CoA Coenzyme A
cystathionine H2O
Phosphate
L-cysteine
Figure 2 - Example of amino acids metabolic pathways for Saccharomyces cerevisiae
7 6.1.2. Amino acids consumption
Free amino acids in grape must are of great importance for yeast nutrition. Together with ammonium, they are the main sources of yeast-assimilable nitrogen, and a deficiency in these compounds can lead to slow and stuck fermentations and H2S
production (Hernándes-Orte et al., 2005; Garde-Cerdán and Ancín-Azpilicueta, 2008). A minimal concentration of more than 140 mg/L is often quoted as necessary for the fermentation of low-solids, low-temperature (< 15 °C), anaerobic musts of moderate sugar level (20%) (Vilanova et al., 2007).
Besides constituting a source of nitrogen for yeasts in alcoholic fermentation and for lactic acid bacteria in malolactic fermentation, amino acids can also be a source of undesirable compounds in wines, like ethyl carbamate, biogenic amines, ochratoxin A from 2-phenylalanine and -carbolines from tryptophane (Moreno-Arribas and Polo, 2009).
Yeasts use the nitrogen from ammonium salts for their development at the start of fermentation. Wine yeasts tend to overexpress ammonia (MEP2) transport genes. The oxidized state of ammonia permits its direct incorporation into organic compounds. Although ammonia is potentially capable of repressing the uptake of amino acids, its normal concentration in grape juice is insufficient to have this effect (Jackson, 2008).
The nitrogen from free amino acids is used after. Some of them, namely, arginine, glutamic acid, glutamine, aspartic acid, asparagine, threonine and serine, are preferentially assimilated (Moreno-Arribas and Polo, 2009). Amino acids are the most prevalent form of total nitrogen in grape juice and wine. In ripe grapes, amino acids generally represent 30% to 40% of total nitrogen. At harvest, 70% of the organic nitrogen can be constituted by amino acids, 3% by proteins and 2% by peptides (Moreno-Arribas and Polo, 2009; Ribéreau-Gayon et al., 2006b).
Amino acids are absorbed by yeasts through a series of membrane proteinic transporters or permeases. There are two distinct categories of transporters: a general amino acid permease (Gap1, Agp2, Agp3) that can transport any amino acid and can be repressed by ammonia; and many amino acid specific transporter. The last transporters can be class-specific, like Bap2 for chain amino acids, Vap1 for branched-chain amino acids, tyrosine and tryptophan, Apl1 for basic amino acids, Dip5 for dicarboxylic amino acids, Can1 for arginine, lysine and ornithine, Pap1 for isoleucine and valine and Ycc5 for asparagine and glutamine; or they can transport only one
8 specific amino acid, e.g. Gnp1 for glutamine, Mup1 and Mup3 for methionine, Hip1 for histidine and Lyp1 for lysine (Ribéreau-Gayon et al., 2006a; Dickinson, 2004).
The amino acids are fast assimilated in the beginning of fermentation (López-Rituerto et al., 2011; Hernández-Orte et al., 2006) and are accumulated in the yeast vacuoles for later use, according to their biosynthesis needs (Ribéreau-Gayon et al., 2006a).
Saccharomyces cerevisiae utilizes ammonia in the synthesis of amino acids necessary for building proteins. However, the availability of NH4 is limited and the
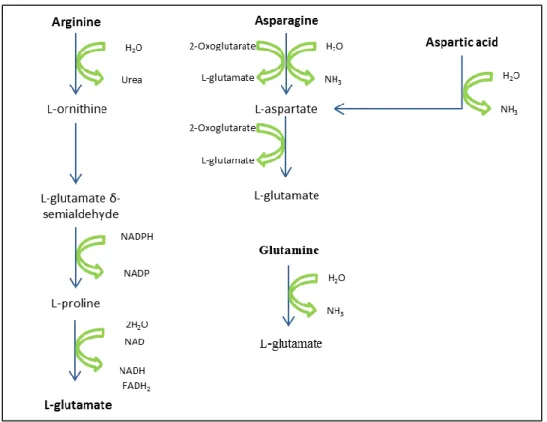
yeasts have to get it from a different source, usually amino acids. Many amino acids are catabolized to either ammonia or glutamate. When glutamate is formed it can be used directly for the subsequent conversion into other amino acids (Dickinson, 2004). The most common pathway is the transfer of an α-amino group, originating from one of many different amino acids, onto α-ketoglutaric acid to form glutamate. Aminotransferases or transaminases catalyze this reaction (Ribéreau-Gayon et al., 2006a). Examples of this metabolic pathway are given in Figure 3.
Figure 3 - Some amino acids catabolism pathways forming glutamate However, at least six other amino acids (the branched-chain amino acids leucine, isoleucine and valine; and the aromatic amino acids phenylalanine, tyrosin and tryptophan) are catabolized quite differently. The carbon skeletons are not recycled, only ammonia is retrieved and the final product is a higher alcohol. Consequently, these
9 amino acids contribute only with ammonia and the carbon will not be used further on the yeast main metabolism pathways (Dickinson, 2004).
Higher alcohols are formed during alcoholic fermentation mainly through Ehrlich Pathway. The amino acids are converted to their corresponding -ketoacids by transamination. This reaction is catalyzed by mitochondrial and cytosolic branched-chain amino acid transferases encoded by the BAT1 and BAT2 genes, respectively. -ketoglutarate accepts the ammonia group, hence forming glutamate. Branched-chain alcohols are then synthesized from the corresponding -ketoacids by decarboxylation and reduction. The first reaction is catalyzed by a decarboxylase, which converts the -ketoacid to the corresponding aldehyde through the removal of one carbon atom. This is followed by a reaction catalyzed by an alcohol dehydrogenase, which leads to the NADH-dependent reduction of this aldehyde to the corresponding higher alcohol. Alternatively, the aldehyde can be oxidized in a NAD+ dependent reaction to an acid. Therefore, it is likely that the redox state of a yeast cell is important for determining the fate of the -keto acid (Lilly et al, 2006; Dickinson, 2004). Examples of the Ehrlich Pathway are presented in Figure 4.
The higher alcohols can be produced alternatively from the generation of the specific -ketoacid through the de novo synthesis pathway from glucose. For example, 1-propanol can be derived from α-ketobutyrate which can be formed from pyruvate and acetyl coenzyme A. α-Ketoisocaproate is a precursor of isoamylic alcohol and an intermediary product in the synthesis of leucine. It too can be produced from α-acetolactate, which is derived from pyruvate. Most higher alcohols in wine can also be formed by the metabolism of glucose without the involvement of amino acids (Ribéreau-Gayon et al., 2006a). -ketoacids, formed by either amino acid or glucose catabolism, can also take part in the biosynthesis of fatty acids (Lilly et al, 2006).
The amino acids metabolism pathways can be interconnected. -ketobutyrate, also known as 2-oxobutyrate, precursor of 1-propanol, is also linked to the isoleucine biosynthesis and threonine degradation pathways (Guitart et al., 1999). In theory, both propanol and amyl alcohol (2-methyl-1-butanol) could be formed from isoleucine or threonine. Valine indirectly influences propanol and propionic acid production during alcoholic fermentation. Leucine and isoleucine directly contribute to isoamyl alcohol (3-methyl-1-butanol) production and indirectly to isovaleric acid production. Leucine also indirectly contributes to 2-phenylethanol production. (Lilly et al., 2006).
10 Figure 4 - Examples of amino acids catabolism through Erlich pathway with the formation of higher alcohols, acids and esters
11 Series of experiments using 13C nuclear magnetic resonance (NMR) spectroscopy for metabolic analysis were carried out in order to determine the metabolic pathways used in fusel alcohol formation from branched-chain amino acids. Since the fate of individual atoms in each intermediate from the amino acid to the end product could be monitored, the Ehrlich pathway was proved for the first time in the catabolism of leucine, valine, isoleucine, phenylalanine, tryptophan, and methionine into the corresponding fusel alcohols. Further confirmation of the key in vivo involvement of the Ehrlich pathway and the nonparticipation of other routes was obtained by testing specific mutants in which potential alternative metabolic pathways were blocked (Dickinson et al., 1997; Dickinson et al., 1998; Dickinson et al., 2000; Hazelwood et al., 2008).
Dickinson et al. (1998), studying the catabolism of [2-13C]valine into isobutyl alcohol, observed that [2-13C]isoamyl alcohol was also formed, although no labeled leucine was present. The formation of [2-13C]isoamyl alcohol from the [2-13C] -ketoisovaleric acid produced by the deamination of valine was explained by utilization of the [2-13C]-ketoisovaleric acid in the leucine biosynthetic pathway. Hence, a mixing of catabolic and biosynthetic pathways can account for the formation of isobutyl alcohol and isoamyl alcohol, respectively, from valine.
López-Rituerto et al (2011) studied the transformation of several amino acids during alcoholic fermentation using nuclear magnetic resonance and labeled amino acids. They observed that three amino acids, phenylalanine, leucine, and isoleucine, were completely consumed in the early stages of alcoholic fermentation and could establish that phenylalanine and leucine were transformed into the corresponding higher alcohols during alcoholic fermentation through the Ehrlich Pathway. Based on their observation, they stated that amino acids originating from grapes can affect higher alcohols in wine during wine fermentation.
The physiological function of higher alcohol production by yeasts is not clear. It may be a simple waste of sugars, a detoxification process of the intracellular medium of
-ketoacids and aldehydes, or a means of regulating the metabolism of amino acids (Ribéreau-Gayon et al., 2006a).
It has been suggested that, physiologically, oxidative deamination provides the yeast with a mechanism for obtaining nitrogen when its pool has become depleted (Lilly et al, 2006). In this way, ammonium and amino acid deficiencies in must can lead to an
12 increased formation of higher alcohols. In these conditions, the yeast appears to recuperate all of the nitrogen available by transamination, abandoning the unused carbon skeleton in the form of higher alcohols (Dickinson, 2004).
Another hypothesis proposes that higher-alcohol production contributes to the maintenance of the redox balance in the cell because the final reduction step in higher-alcohol production involves the reoxidation of NADH + H+ to NAD+ (Lilly et al, 2006).
Aspartic acid can be deaminated to form oxaloacetate and it has been shown that some bacterial strains can further catabolized it into acetoin, diacetyl and 2,3-butanediol. It is however, not known whether any yeast strains can complete this reaction. Threonine can also be converted into acetaldehyde and further into ethanol or acetic acid. Methionine can be catabolized to release methanethiol following a demethiolation reaction. Methanethiol can be further converted to other sulphur compounds, and it could also react with carboxy acids to produce thioesters. Another amino acid, cysteine can form various odor-impacting compounds through Maillard reaction (Styger, Prior and Bauer, 2011).
6.2. Volatile compounds formed during alcoholic fermentation
Apart from higher alcohols, other compounds can be formed during alcoholic fermentation as by-products of Saccharomyces cerevisiae metabolism.
Volatile esters are one of the most important classes of aroma compounds and generally give a fruity character to wine, but can also be detrimental to wine quality. The two main groups of fermentation-derived esters that have been long associated with wine fruitiness are acetate esters – ethyl acetate, 2-methylpropyl acetate (isobutyl acetate), 2- methylbutyl acetate (active amyl acetate), 3-methylbutyl acetate (isoamyl acetate), hexyl acetate, and 2-phenylethyl acetate – and ethyl fatty acid esters (ethyl C4 – ethyl C12) (Ugliano and Henschke, 2009).
Esters are formed by a reaction between an alcohol and an acid, usually by an enzymatic process. The formation of esters initiate with the activation of an acid by combining it with coenzyme A before reacting with the alcohol to form an ester. The coenzyme donor can either be acetyl-CoA (formed from pyruvate) or any of a range of acyl-CoA compounds formed by the enzyme acyl- CoA synthetase (Styger, Prior and Bauer, 2011). So, acetate esters can be formed through reaction between a higher alcohol and acetyl-CoA, catalyzed by alcohol acetyltransferase enzymes, while ethyl
13 esters are formed from ethanolysis of acyl-CoA, which is an intermediate metabolite of fatty acid metabolism. The ethyl esters of fatty acids are, therefore, formed by the condensation of ethanol with the acid group from a medium-chain fatty acid (Ugliano and Henschke, 2009; Styger, Prior and Bauer, 2011). Another important ester, ethyl acetate is formed by the condensation of ethanol and acetyl-CoA (KEGG, 2012).
6.3. Nitrogen compounds and wine aroma
Many studies were conducted to establish the relation between nitrogen compounds and wine aroma. It is clear that the amino acid profile can have an important and determinant influence on wine aroma profile, with considerable impact on sensory quality.
Guitart et al. (1999) conducted an experiment to determine the relationship of the amino acid content of Chardonnay juice with the volatile composition of the produced wines. Strong correlation between the content of amino acids and nine of the volatile compounds, including the linear fatty acids and their ethyl esters, c-3-hexenol and benzyl alcohol, was found. Surprisingly, no correlations were found between amino acid content and their related volatile compounds (higher alcohols, isoacids) and even the tendency toward a negative correlation (isobutyric acid), indicating that it is possible that high amino acid concentrations inhibit the synthesis of fusel alcohols.
An inverse relation between higher alcohols and branched-chain acids with initial concentration of nitrogen was also observed by Torrea et al. (2011). They stated that the decrease in the formation of the higher alcohols, branch-chain acids and also ethyl esters of branched-chain acids in response to nitrogen addition is explained by a repression of amino acid biosynthesis, causing a reduced carbon flow through the Ehrlich pathway.
Fermenting synthetic solutions with different amino acids profiles imitating 11 grape varieties, Hernándes-Orte et al. (2002) found significant differences in the levels of important volatile compounds. The results showed that many compounds final concentration significantly depended on the must amino acid composition, including ethanol, ethyl acetate, acetic, hexanoic and octanoic acids. Multivariate analysis showed that amino acid composition explains a high proportion of the variance in the volatile composition. According to different partial least-squares regression models, the levels of some byproducts of fatty acid synthesis were related to threonine and serine, the level
14 of -phenyletanol was closely related to the level of phenylalanine, and methionol was stongly correlated to the must methionine contents. This indicates that most vintage and geographical variations observed in wine fermentative aroma can be related to the differences in the must amino acid composition.
Grape juices added with different concentrations of four amino acids – phenylalanine, aspartic acid, threonine and alanine – were fermented and the formation kinetics of aroma volatile compounds was assessed by Hernández-Ortes et al. (2006). They could observe that the amino acids were consumed mainly in the first quarter of fermentation and that higher alcohol formation took place at the same time as ethanol formation. Smaller amounts of isoamyl alcohol were formed with higher concentrations of amino acids, while benzyl alcohol and -phenylethanol increased when amino acids were added to the juice. The sensory evaluation of the wines revealed a modification of the sensory profile with the amino acid addition, being the sulphured, vegetal, fusel, floral, lactic and reduction notes the most affected. The higher level of amino acids addition produced a significant decrease in the sulphured, reduction and lactic notes and less noticeable increase in the fusel and floral notes.
15
7. Materials and methods
7.1. Reagents and standards
The pure reference compounds used for quantification purposes were bought from Merck (Darmstadt, Germany), Sigma (Saint Louis, USA), Aldrich (Gillingham, UK) and Riedel-de Haën (Seelz, Germany). The pure amino acids, glucose and fructose were from Sigma.
7.2. Fermentations
A modified synthetic grape juice (Ciani and Ferraro, 1996) was used in both experiments. The basis for the synthetic media was maintained, but the nitrogen source was modified to include the amino acids pools. The final media was composed by three solutions – A, B and C – in the proportion of 2:1:1. The solutions composition were as follows (in 1.0 L of final media): solution A – D-glucose (110.0g), D-fructose (110.0g), Tween 80 (1.0 mL); solution B – L-(1)-tartaric acid (6.0 g), L-(2)-malic acid (3.0 g), citric acid (0.5 g); solution C – YNB (yeast nitrogen base without amino acids and ammonium sulfate – Difco) (1.7 g), CaCl2 (0.2 g), and one of the nitrogen pools
described below (200 mg N/L). The pH from solutions B and C was adjusted to 3.5. The three solutions were sterilized at 121º C for at least 15 minutes and combined aseptically.
Experiment 1
A – NH4Cl (200 mg/L N)
C – CAA (casamino acids vitamin assay – Difco) (200 mg/L N) AC – NH4Cl (50 mg/L N) + CAA (150 mg/L)
AP – NH4Cl (50 mg/L N) + arginine, asparagine, aspartic acid,
glutamine and glutamic acid (150 mg/L N divided in equal parts)
AA – NH4Cl (50 mg/L N) + isoleucine, leucine, phenylalanine, tyrosine,
valine (150 mg/L N divided in equal parts)
Experiment 2
A – NH4Cl (200 mg/L N)
B – NH4Cl (50 mg/L N) + isoleucine, leucine, phenylalanine, tyrosine,
16 C – NH4Cl (50 mg/L N) + isoleucine, phenylalanine, tyrosine, valine
(150 mg/L N divided in equal parts)
D – NH4Cl (50 mg/L N) + leucine, phenylalanine, tyrosine, valine (150
mg/L N divided in equal parts)
E – NH4Cl (50 mg/L N) + isoleucine, leucine, phenylalanine, tyrosine
(150 mg/L N divided in equal parts)
F – NH4Cl (50 mg/L N) + isoleucine, leucine, tyrosine, valine (150 mg/L
N divided in equal parts)
G – NH4Cl (50 mg/L N) + isoleucine, leucine, phenylalanine, valine (150
mg/L N divided in equal parts)
The fermentations were realized in duplicate in sterilized 500 mL glass Schott bottles covered with a cotton bud, with 300 mL of media in experiment 1 and 450 mL in experiment 2. Once aseptically transferred to the bottles, the media was inoculated with Saccharomyces cerevisiae PYCC4653 (Portuguese Yeast Culture Collection). The yeast was added at a concentration of 1% v/v. The yeast suspension was prepared by activating the culture stored at -80 ºC in 20 mL YM media. It was kept at 25 ºC for two days, centrifuged and suspended in 20 mL of sterile Ringer solution before inoculation. The fermentations were carried out in an incubator at constant temperature of 20 ºC. After fermentation, the samples were centrifuged and frozen at – 20ºC or stoked under refrigeration until analysis.
Fermentation follow up
For both experiments, the levels of sugar (glucose and fructose) and ethanol were controlled every two days using HPLC Beckman, System Gold, with an Aminex HPX-87H (ion exclusion column – 300 mm x 7,8 mm) connected to a refraction index detector. A H2SO4 2,5 mM solution at 0.8 mL/min flow rate was used as mobile phase
and 20 µL of sample was injected. The column was kept at constant temperature of 40 ºC. The fermentation was considered completed once the levels of glucose and fructose were lower than 2 g/L or when no modification could be observed in consecutive analysis.
For experiment 1, the yeast growth was followed using total plate counts every two days. The counts were made using the drop count technique (Miles and Misra,
17 1938). Aliquots of 20 µL of different dilutions of the samples were inoculated in YM medium with agar in disposable petri dishes, followed by 48 hours incubation at 30 ºC. The colonies were counted and the result was expressed in CFU/mL.
For experiment 2, the yeast growth was followed by measuring the optical density of the samples once a day. It was used a UV/VIS spectrophotometer Nicolet evolution 100, Thermo electron corporation (Cambridge, UK) for the analysis. The homogenized sample absorbance was read at 650 nm in acrylic cuvettes with 1 cm of light path length.
7.3. GC analyses
The higher alcohols (1-propanol, 1-butanol, propanol, 2-methyl-1-butanol, 3-methyl-1-butanol and 2-phenylethanol), ethanal and ethyl acetate were analyzed using a HP 5890 series II gas chromatograph, equipped with a CPWAX 57 CB column (Chrompack) of 50 m X 0.25 mm and 0.2 µm phase thickness, coupled to a flame ionization detector. For the analysis, 1 µL of sample was injected directly after filtration in cellulose syringe filters (25 µm). The temperature program was 40 ºC (5 min) to 180 ºC (0 min) at 3 ºC min-1. Injector and detector temperatures were set at 250 ºC. Carrier gas was H2 at 1 ml min-1. The injection was in split mode, the split flow
being 30 mL/min. 4-methyl-2-pentanol was used as internal standard and 50 µL of a 10 g/L solution was added to 5 mL of sample. The chromatographic peaks of the analytes were normalized by the internal standards, and the relative area was then interpolated in the calibration graphs built by the analysis of the pure compound in 10% ethanol solution.
The esters (isobutyl acetate, ethyl butanoate, isoamyl acetate, ethyl hexanoate, hexyl acetate and phenylethyl acetate) were analyzed by GC/MS in a Varian GC, equipped with a Varian 240-MS/4000 mass spectrometer. The column used was a STABILWAX-DA (60 m, 0.25 mm, 0.25 lm) fused silica. The samples were filtered in cellulose syringe filters (25 µm) before analysis. The conditions for SPME were: 5 mL of sample, 0.5 g of sodium sulphate and 20 µL of internal standard 3-octanol (50 mg/L) were transferred to 20 mL screw cap glass vial with a rubber septum. The contents were stirred for 5 min at 45 °C, and then the fiber (Divinylbenzene/Carboxen on polydimethylsiloxane coating) was exposed to the headspace for 15 minutes, under the same conditions. The length of the fiber in the headspace was kept constant. Desorption
18 of volatiles took place in the injector in splitless mode, at 220 °C for 15 minutes. The oven temperature was 40 ºC (1 min), then increased at 2 ºC/min to 220 ºC and held for 30 min. The carrier gas was Helium at 1 mL.min-1, constant flow.
All mass spectra were acquired in the electron impact (EI) mode with the Ion Trap detector set as follows: transfer line, manifold and trap temperatures 230 ºC, 45 ºC and 170 ºC, respectively. The mass range was 33 m/z to 350 m/z, with a scan rate of 6 scan/s, and without solvent delay. The emission current was 50 lA, and the electron multiplier was set to the auto-tune procedure. The maximum ionization time was 25,000 ls with an ionization storage level of 35 m/z. The analysis was performed in Full Scan mode. Quantitative analysis was performed by selected ion current mode. Ions selected were respectively for 3-octanol, m/z = 83.
7.4. Sensory evaluation
The centrifuged fermented solutions were evaluated by a panel of experienced judges, members of the Center of Biotechnology and Fine Chemistry of the College of Biotechnology / Portuguese Catholic University. The evaluations were done using the form shown in Figure 5. The panelists were asked to analyze the samples according to pre-determined descriptors and according to their perception of the similarity between the samples and wine, designated in the form as the “Wine like” character. The panelists were asked to analyze the samples disregarding any hedonic characters, especially when judging the wine like character.
Figure 5 - Form for sensory evaluation
SAMPLE: NAME: Date:
olfactory examination
0 a 5 Arom atic intensity
Fruity arom a intensity Floral arom a intensity
Others * 1 a 5 ( _____________________________ ) ( _____________________________ )
Defects (w hen applicable)
1 a 5 Sulphur (rotten eggs, onion...)
Ethyl acetate (glue) Acetaldehyde (old apples) Volatile acidity (vinegar) Others (____________________)
Wine like: _____
0 -imperceptible; 1 - faint; 3 - medium; 5- intense
Wine like: Indicate how much the sample is close to the
typical aroma of w ine:
19 The samples were presented at room temperature in black wine tasting glass, covered with a clock glass. For experiment 2, a white wine sample was added to have a standard for comparison.
7.5. Statistical analysis
The data were analyzed using descriptive statistics, univariate analysis of variance followed by tukey HSD test, Principal Component Analysis and hierarchical clustering. A 5% level of significance was used.
The analyses were performed using the Microsoft Office Excel software and the freely available statistical software R, version 2.14.1 (The R Foundation for Statistical Computing) and the FactoMineR package (Exploratory Multivariate Data analysis for R).
20 0 10 20 30 40 50 0 5 10 15 20 C F U /m L x 10E 6 Days
C
0 10 20 30 40 50 0 5 10 15 20 C F U /m L x 10E 6 DaysAC
8. Results and Discussion
8.1. Experiment 1
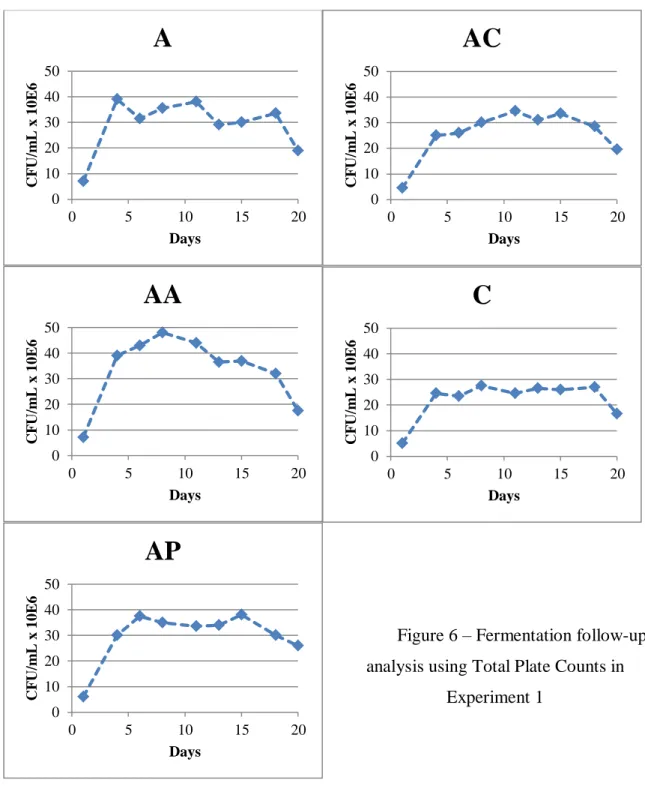
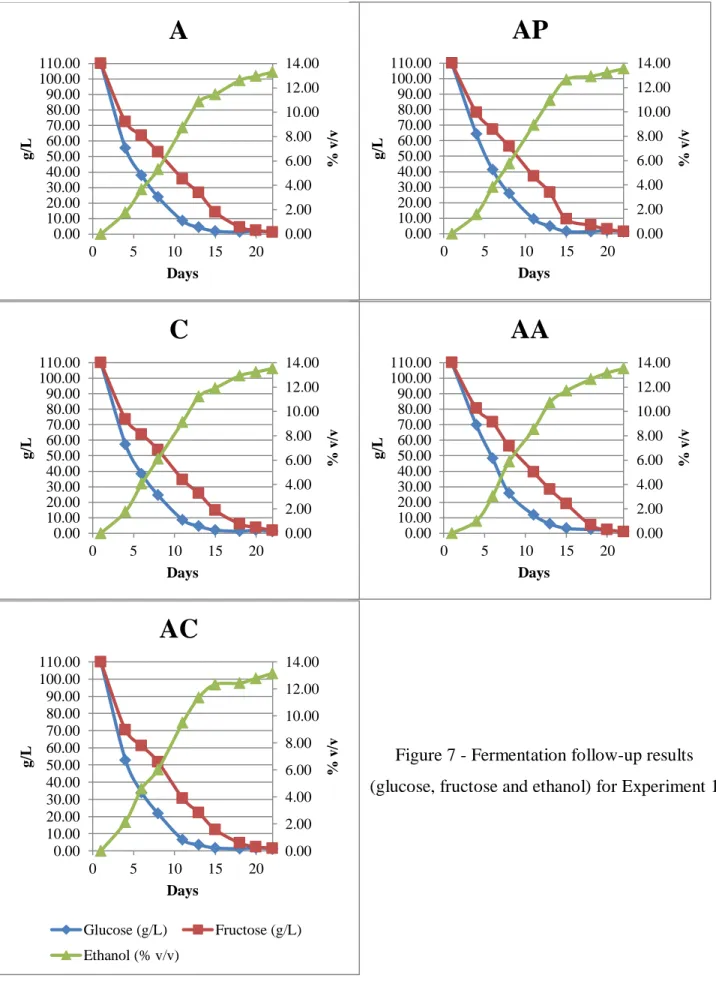
The fermentations of the synthetic grape juices with different nitrogen sources lasted 20 days. The follow up analysis results are represented in Figures 6 and 7, being A – the fermentations with only ammonia as a nitrogen source, C – casamino acids, AC – ammonia and casamino acids, AA – ammonia and amino acids precursors of aroma compounds, and AP – ammonia and amino acids preferably consumed by yeasts (Moreno-Arribas and Polo, 2009).
0 10 20 30 40 50 0 5 10 15 20 C F U /m L x 10E6 Days
A
0 10 20 30 40 50 0 5 10 15 20 C F U /m L x 10E6 DaysAA
0 10 20 30 40 50 0 5 10 15 20 C F U /m L x 10E6 DaysAP
Figure 6 – Fermentation follow-up analysis using Total Plate Counts in
21 0.00 2.00 4.00 6.00 8.00 10.00 12.00 14.00 0.00 10.00 20.00 30.00 40.00 50.00 60.00 70.00 80.00 90.00 100.00 110.00 0 5 10 15 20 % v /v g/ L Days
AP
0.00 2.00 4.00 6.00 8.00 10.00 12.00 14.00 0.00 10.00 20.00 30.00 40.00 50.00 60.00 70.00 80.00 90.00 100.00 110.00 0 5 10 15 20 % v /v g/ L DaysAA
0.00 2.00 4.00 6.00 8.00 10.00 12.00 14.00 0.00 10.00 20.00 30.00 40.00 50.00 60.00 70.00 80.00 90.00 100.00 110.00 0 5 10 15 20 % v /v g/ L DaysA
0.00 2.00 4.00 6.00 8.00 10.00 12.00 14.00 0.00 10.00 20.00 30.00 40.00 50.00 60.00 70.00 80.00 90.00 100.00 110.00 0 5 10 15 20 % v /v g/ L DaysC
0.00 2.00 4.00 6.00 8.00 10.00 12.00 14.00 0.00 10.00 20.00 30.00 40.00 50.00 60.00 70.00 80.00 90.00 100.00 110.00 0 5 10 15 20 % v /v g/ L DaysAC
Glucose (g/L) Fructose (g/L) Ethanol (% v/v)Figure 7 - Fermentation follow-up results (glucose, fructose and ethanol) for Experiment 1
22 All fermentations behaved as expected and no stuck or slow fermentation occurred. The average ethanol concentration of the final wines was 13.41% v/v (standard deviation: 0,1585). Another pool with sulphur containing amino acids (cysteine and methionine) and ammonia was tested; however, the yeast was unable to consume, after 20 days of fermentation, half the sugars in the media and that treatment was abandoned.
After fermentation completion, the samples were centrifuged and frozen until analysis. The sensory evaluation was done before freezing the samples.
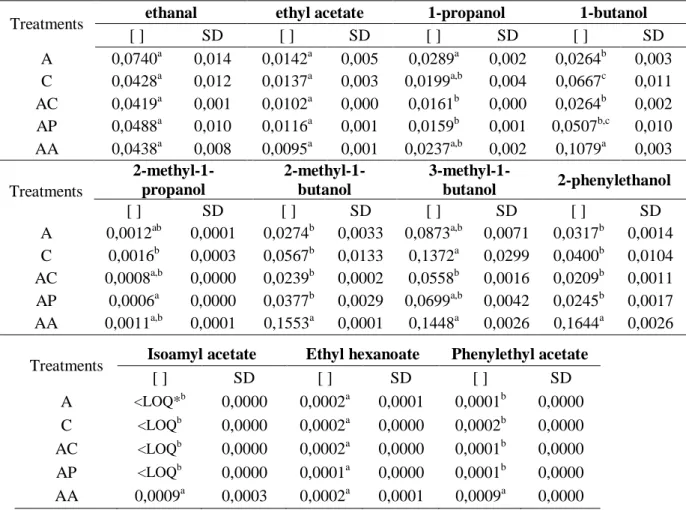
The volatile composition of the samples is presented in Table 1. Significant differences were observed for 1-propanal, 1-butanol, propanol, 2-methyl-1-butanol, 3-methyl-1-2-methyl-1-butanol, 2-phenylethanol, isoamyl acetate and phenylethyl acetate.
Table 1 - Volatile compounds concentration (g/L) in Experiment 1
Treatments ethanal ethyl acetate 1-propanol 1-butanol
[ ] SD [ ] SD [ ] SD [ ] SD A 0,0740a 0,014 0,0142a 0,005 0,0289a 0,002 0,0264b 0,003 C 0,0428a 0,012 0,0137a 0,003 0,0199a,b 0,004 0,0667c 0,011 AC 0,0419a 0,001 0,0102a 0,000 0,0161b 0,000 0,0264b 0,002 AP 0,0488a 0,010 0,0116a 0,001 0,0159b 0,001 0,0507b,c 0,010 AA 0,0438a 0,008 0,0095a 0,001 0,0237a,b 0,002 0,1079a 0,003 Treatments 2-methyl-1-propanol 2-methyl-1-butanol 3-methyl-1-butanol 2-phenylethanol [ ] SD [ ] SD [ ] SD [ ] SD A 0,0012ab 0,0001 0,0274b 0,0033 0,0873a,b 0,0071 0,0317b 0,0014 C 0,0016b 0,0003 0,0567b 0,0133 0,1372a 0,0299 0,0400b 0,0104 AC 0,0008a,b 0,0000 0,0239b 0,0002 0,0558b 0,0016 0,0209b 0,0011 AP 0,0006a 0,0000 0,0377b 0,0029 0,0699a,b 0,0042 0,0245b 0,0017 AA 0,0011a,b 0,0001 0,1553a 0,0001 0,1448a 0,0026 0,1644a 0,0026
The numbers followed by the same letter in the column do not differ statistically in the Tukey test (p<0,05).
* LOQ – Limit of quantification (= 10-5 g/L)
Treatments Isoamyl acetate Ethyl hexanoate Phenylethyl acetate
[ ] SD [ ] SD [ ] SD A <LOQ*b 0,0000 0,0002a 0,0001 0,0001b 0,0000 C <LOQb 0,0000 0,0002a 0,0000 0,0002b 0,0000 AC <LOQb 0,0000 0,0002a 0,0000 0,0001b 0,0000 AP <LOQb 0,0000 0,0001a 0,0000 0,0001b 0,0000 AA 0,0009a 0,0003 0,0002a 0,0001 0,0009a 0,0000
23 Apart from 1-butanol, all the other compounds have relation with the metabolism of amino acids. For all these compounds, the sample AA was always among the samples with higher concentration, showing that the kind of amino acid, other than just the concentration, can have an impact on the production of aroma compounds. Hernández-Orte et al. (2002) found that higher proportions of threonine lead to higher 3-methyl-1-butanol concentrations and that the higher phenylalanine content the higher
-phenylethanol and 2-methyl-1-propanol. The sample AA, with the highest concentration of phenylalanine, had the highest concentrations of phenylethanol, but not for 2-methyl-1-propanol.
To have a better dimension of the differences between the samples, Principal Component Analysis was applied and is represented in Figure 8. The two principal components retained together 81,6% of the total variation, being 55,01% for PC1 and 26,59% for PC2. Most variables are linked positively with PC1, but ethanal and ethyl acetate. This indicates that the concentration of these compounds are lower the higher the concentration of the other compounds, although, no significant correlation was found between them and PC1.
The treatment using precursor amino acids (AA) is isolated from the others and has a higher positive correlation with PC1. The other samples are closer to zero for PC1 axis and have a negative correlation, except for sample C that has positive correlation. This observation is confirmed by the clustering analysis, represented as the differences in color and shape of the markers in Figure 8A, which separated the sample AA from the others.
The variables 2-methyl-1-butanol, phenylethyl acetate, 2-phenylethanol, isoamyl acetate and 1-butanol are positively correlated (p<0,05) to the first principal component. The concentrations of these compounds are higher (Table 1) for sample AA. They are products of the yeast amino acid metabolism and this result was already expected, once the concentrations of the precursor amino acids were much higher for AA than for the other treatments, especially A and AP, which didn‟t have any precursor.
Once AA was so different from the other samples, a new PCA was performed excluding it. In this new analysis (Figure 9), the first two components resume 88,73% of the variation among samples, being 57,65% for PC1 and 31,08% for PC2. All variables were linked positively with PC1, except for isoamyl acetate, that was not detected in any of the remaining samples and had a vector equal zero. The treatment C (only casamino acids as nitrogen source) has the higher correlation with PC1, being separated
24 from the others. The sample A (only ammonia) has a better correlation with PC2 than PC1 and is also separated from the other two samples. The clustering analysis corroborates these observations.
The variables 3-methyl-butanol and 2-phenylethanol are significantly correlated to PC1 and are the most important in the discrimination of the samples. Once more, the presence of higher amount of precursor amino acids seems to be the factor causing the difference among the samples, when analyzing the treatment C. Interestingly, the sample AC, which contains more precursor amino acids than A, is negatively correlated with PC1, indicating a lower concentration of the compounds in question.
Torrea et al. (2011) found that, in experiment using different concentrations of organic and inorganic nitrogen supplements in Chardonnay must, for equivalent yeast assimilable nitrogen levels, the concentration of higher alcohols was larger in wines supplemented with a mixture of amino acid and ammonium nitrogen when compared to ammonium nitrogen alone. This pattern was observed in other experiments and corresponds to changes in the relative activity of the biosynthetic pathways and the amino acid catabolic reactions responsible for the formation of the -ketoacids.
The sensory evaluation results are represented in Table 2. The sensory evaluation was performed by four well experienced panelists and both repetitions were evaluated individually.
Significantly differences were found for the variables fruity aroma, sulphur aroma and wine like character. The sample AA had the highest fruity aroma, while the sample AP had the highest sulphur aroma and the lowest wine like character. This sample was also described as having a potato like aroma, which can also be related to sulphur compounds.
25 Figure 8 – Scores (A) and Loadings (B) of the Principal Component analysis of Experiment 1
A C AC AP AA -3 -2 -1 0 1 2 3 -5 -4 -3 -2 -1 0 1 2 3 4 5 P ri n ci p al C o m p o n e n t 2 (2 6. 5 9 % ) Principal Component 1 (55.01%)
A
-0.1 0.1 0.3 0.5 -0.3 -0.1 0.1 0.3 0.5 P ri n ci p al C o m p o n e n t 2 (2 6 .5 9 % ) Principal Component 1 (55.01%)B
ETH ETHACET PROP BUT 2METPROP 2METBUT 3METBUT 2PHETOH ISOACET ETHEX PHEACET26 Figure 9 - Scores (A) and Loadings (B) of the Principal Component analysis of Experiment 1 without sample AA
A C AC AP -2 -1.5 -1 -0.5 0 0.5 1 1.5 2 2.5 3 3.5 -5 -4 -3 -2 -1 0 1 2 3 4 5 P ri n ci p al C o m p o n e n t 2 (3 1 ,0 8% ) Principal Component 1 (57,65%)
A
-0.6 -0.4 -0.2 0.0 0.2 0.4 0.6 -0.3 -0.1 0.1 0.3 0.5 P ri n ci p al C o m p o n en t 2 (3 1 ,0 8 % ) Principal Component 1 (57,65%)B
ETH ETHACET PROP BUT 2METPROP 2METBUT 3METBUT 2PHETOH ISOACET ETHEX PHEACET27 Table 2 - Sensory evaluation results for Experiment 1
Treatment
Aromatic
intensity Fruity aroma Floral aroma Sulphur Ethyl acetate Acetaldehyde
Volatile
acidity Wine like
score SD score SD score SD score SD score SD score SD score SD score SD
A 3,50a 0,50 3,00b 1,12 1,75a 1,48 0,13c 0,33 0,38a 0,99 0,50a 0,87 0,13a 0,33 3,06a 0,95
C 3,63a 0,70 2,50bc 1,22 1,63a 1,22 0,00c 0,00 0,25a 0,66 0,00a 0,00 0,75a 1,09 2,69ab 0,83
AC 3,50a 0,87 2,63bc 1,49 2,00a 1,66 0,50b 0,87 0,00a 0,00 0,25a 0,43 0,38a 0,70 2,94a 1,24
AP 3,50a 0,50 1,75c 0,83 1,25a 0,83 3,38a 0,48 0,00a 0,00 0,00a 0,00 0,00a 0,00 1,94b 0,73
AA 4,00a 0,50 4,13a 0,78 2,13a 1,54 0,00c 0,00 0,00a 0,00 0,63a 1,11 0,88a 1,27 3,19a 0,50 The numbers followed by the same letter in the column do not differ statistically in the Tukey test (p<0,05)
28 Sulphur compounds, like disulphides and mercaptans, can be a by-product of the sulphur containing amino acids cysteine and methionine. Although none of them is present at the media, they can be metabolized from aspartic acid, one of the amino acids added in sample AP. Moreira et al. (2002) showed that the supplementation of grape musts with cysteine and methionine lead to a higher concentration of sulphur compounds. Addition of methionine led to a higher production of 3-(methylthio)-1-propanol and its acid and ester derivatives; and higher contents of hydrogen sulphide and cis-2-methyltetrahydrothiophene-3-ol were observed with cysteine supplementation.
Addition of selected amino acids (phenylalanine, alanine, aspartic acid and threonine) to grape juice produced a significant decrease in the sulphur, reduction and lactic notes and much less noticeable increase in the fusel and floral notes (Hernándes-Orte et al., 2006).
The samples A, C, AC and AA were not significantly different for the variable wine like character, having an average score around 3 out of 5. Considering that the initial media had only the bases of grape juice, lacking all other aroma compounds and precursors, this result can be considered as satisfactory. It means that some part of the aroma recognized as wine is related to the yeast metabolism and, furthermore, to the amino acid profile.
29 8.2. Experiment 2
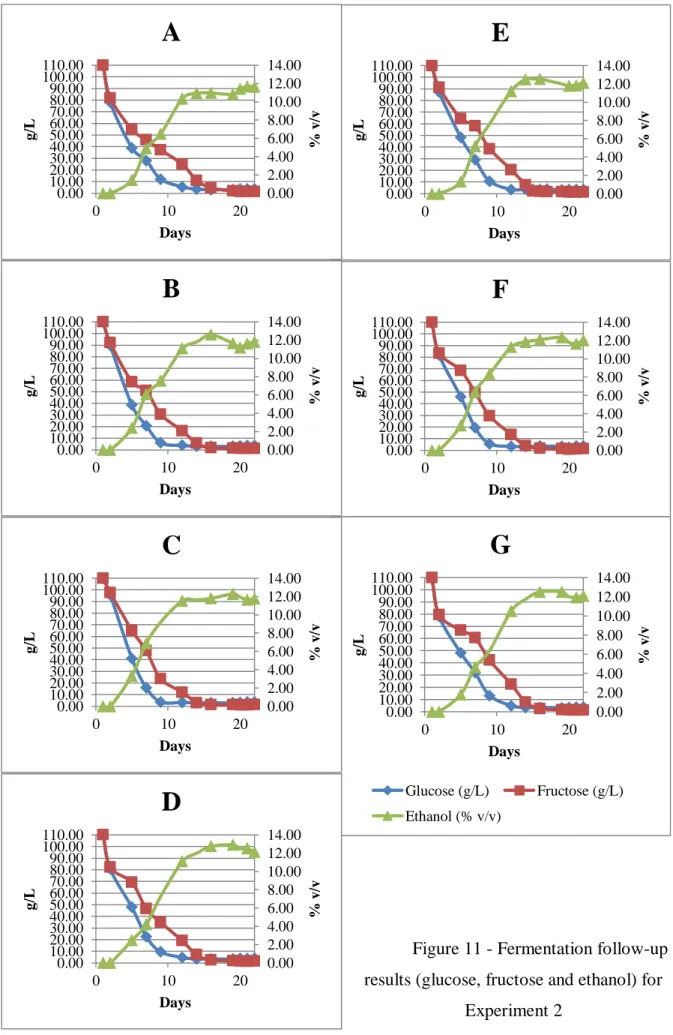
The fermentations for experiment 2, similarly as the ones for experiment 1, lasted for 22 days. The results of the follow-up analysis are represented in Figures 10 and 11, being: A – fermentation using only ammonia as nitrogen source; B – ammonia and all aroma precursors amino acids; C – same as B, without leucine; D – same as B, without isoleucine; E – same as B, without valine; F – same as B, without phenylalanine; G – same as B, without tyrosine.
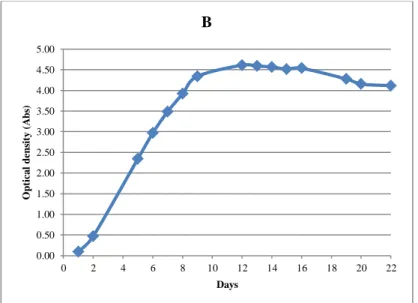
Just like in experiment 1, all fermentations behaved as expected and no stuck or slow fermentations were observed. All the samples had very similar optical density development during the fermentation (Figure 10). Figure 11 shows glucose and fructose consumption and ethanol production throughout the fermentations. After completion, the samples were centrifuged and frozen until analysis, except for a fraction saved for sensory evaluation, which was centrifuged and stored in refrigeration until evaluation.
The results from the volatile composition analysis of the samples are presented in Table 3. Statistically significant differences between samples were observed for 1-propanol, 1-butanol, methyl-1-1-propanol, methyl-1-butanol, 3-methyl-1-butanol, 2-phenylethanol and phenylethyl acetate. In general terms, the sample A, fermented with ammonia as the single source of nitrogen, had the lowest concentration of volatile compounds with significant difference.
0.00 0.50 1.00 1.50 2.00 2.50 3.00 3.50 4.00 4.50 5.00 0 2 4 6 8 10 12 14 16 18 20 22 O p tica l d en sit y ( A b s) Days B
30 0.00 2.00 4.00 6.00 8.00 10.00 12.00 14.00 0.00 10.00 20.00 30.00 40.00 50.00 60.00 70.00 80.00 90.00 100.00 110.00 0 10 20 % v /v g/ L Days
E
0.00 2.00 4.00 6.00 8.00 10.00 12.00 14.00 0.00 10.00 20.00 30.00 40.00 50.00 60.00 70.00 80.00 90.00 100.00 110.00 0 10 20 % v /v g/ L DaysF
0.00 2.00 4.00 6.00 8.00 10.00 12.00 14.00 0.00 10.00 20.00 30.00 40.00 50.00 60.00 70.00 80.00 90.00 100.00 110.00 0 10 20 % v /v g/ L DaysG
Glucose (g/L) Fructose (g/L) Ethanol (% v/v) 0.00 2.00 4.00 6.00 8.00 10.00 12.00 14.00 0.00 10.00 20.00 30.00 40.00 50.00 60.00 70.00 80.00 90.00 100.00 110.00 0 10 20 % v /v g/ L DaysA
0.00 2.00 4.00 6.00 8.00 10.00 12.00 14.00 0.00 10.00 20.00 30.00 40.00 50.00 60.00 70.00 80.00 90.00 100.00 110.00 0 10 20 % v /v g/ L DaysB
0.00 2.00 4.00 6.00 8.00 10.00 12.00 14.00 0.00 10.00 20.00 30.00 40.00 50.00 60.00 70.00 80.00 90.00 100.00 110.00 0 10 20 % v /v g/ L DaysC
0.00 2.00 4.00 6.00 8.00 10.00 12.00 14.00 0.00 10.00 20.00 30.00 40.00 50.00 60.00 70.00 80.00 90.00 100.00 110.00 0 10 20 % v /v g/ L DaysD
Figure 11 - Fermentation follow-up results (glucose, fructose and ethanol) for
31
The samples A and F, which did not have phenylalanine added to the media, had the lowest concentrations of phenylethanol and phenylethyl acetate, both directly derived from the metabolism of the mentioned amino acid. The same pattern can be observed for 2-methyl-1-butanol, where the samples A and D, both lacking isoleucine, had the lowest concentration. The isoleucine derivative ester, amyl acetate, was not detected by the methods used.
The same pattern could not be observed for 2-methyl-1-propanol and 3-methyl-1-butanol. The sample A had the lowest concentration of 2-methyl-1-propanol, as could be expected. However, sample E, fermented in absence of valine, precursor amino acid of 2-methyl-1-propanol, had statistically the same concentration as the other samples. The same occur to 3-methyl-1-butanol. It was expected that the samples without leucine, the precursor amino acid, would have the lowest concentrations, but sample C had statistically the same concentration as the other samples and sample A, even wit h the lowest average, was not significantly different from samples C, B and G.
For 1-propanol, which can be the product of threonine or glucose degradation, but also be linked to isoleucine biosynthesis, the sample D (fermented without isoleucine) had the highest final concentration, at least two times higher than most of the other samples, that did not differed for this compound.
Principal component analysis was also used to better describe the differences among samples and the results are represented in Figure 12. The first two components explained 65,06% of the total variation between samples, being 41,26% for PC1 and 23,8% for PC2. Most compounds are positively linked to PC1, indicating that they are directly proportional. The exception is ethanal, which is negatively linked to PC1. Ethanal, 1-butanol, 2-methyl-1-propanol, 1-propanol and 3-methyl-1-butanol are positively linked to PC2.
The samples were divided in four groups by the clustering analysis. The sample A, with the lowest concentration for most volatile compounds, is isolated at left, negatively linked to both components. The samples B, C, F and G form the second group and are located close to PC2 axis. This group has similar position in relation to PC1 and occupies a neutral zone, close to zero, but have different positions concerning PC2. Samples D and E form the third and fourth groups. Both are positively linked to PC1, being sample E more to the right. Sample D is positively linked to PC2, while sample E is negatively linked.
32 The compounds 3-methyl-1-butanol, 2-phenylethanol, phenylethyl acetate and isoamyl acetate have significant positive correlation with PC1 and 1-butanol has significant positive correlation with PC2.
The sensory evaluation was performed by 11 well experienced panelists. Due to the amount of samples and the time available to perform the analysis, the sample‟s repetitions were mixed to give one sample for each treatment. Each panelist evaluated all samples individually. The results for this analysis are represented in Table 4. A wine sample was added to see how far the samples were from a real wine aroma.
Significant differences were observed only for fruity aroma and wine like character, showing a more uniformity among samples. The wine sample got the highest average for fruity aroma, but it was not statistically different from the sample containing aroma precursor amino acids. Sample A had the lowest average for this descriptor. The wine sample had the highest score for wine like character, as expected. The samples containing amino acids had an average of around 2,3, lower than the score given to the sample AA, 3,19, from experiment 1, with the same amino acids composition. Although the samples didn‟t differ statistically for wine like character, the average value for the samples containing amino acids is higher than the value for the samples with only ammonia. The individual removal of amino acids from the set of aroma precursors amino acids did not significantly change the aromatic profile of the samples.
33 Table 3 -Volatile compounds concentration (g/L) in Experiment 2
Treatment ethanal ethyl acetate 1-propanol 1-butanol
2-methyl-1-propanol 2-methyl-1-butanol [ ] SD [ ] SD [ ] SD [ ] SD [ ] SD [ ] SD A 0,0644a 0,001 0,0084a 0,000 0,0199b 0,000 0,0179b 0,004 0,0007b 0,000 0,0206c 0,003 B 0,0521a 0,006 0,0072a 0,000 0,0242b 0,001 0,1031ab 0,006 0,0014ab 0,000 0,1515ab 0,010 C 0,0537a 0,000 0,0079a 0,001 0,0216b 0,001 0,1240a 0,003 0,0011ab 0,000 0,2101a 0,003 D 0,0649a 0,010 0,0106a 0,000 0,0509a 0,009 0,1473a 0,002 0,0015ab 0,000 0,0526bc 0,004 E 0,0385a 0,015 0,0144a 0,004 0,0268b 0,000 0,0614ab 0,007 0,0011ab 0,000 0,2535a 0,019 F 0,0587a 0,016 0,0095a 0,004 0,0234b 0,003 0,1404a 0,040 0,0015a 0,000 0,1987a 0,051 G 0,0319a 0,003 0,0071a 0,001 0,0241b 0,000 0,0971ab 0,001 0,0010ab 0,000 0,1465ab 0,001
The numbers followed by the same letter in the column do not differ statistically in the Tukey test (p<0,05). * LOQ – Limit of quantification (= 10-5 g/L)
Treatment
3-methyl-1-butanol 2-phenylethanol Isoamyl acetate Ethyl hexanoate
Phenylethyl acetate [ ] SD [ ] SD [ ] SD [ ] SD [ ] SD A 0,0703b 0,010 0,0222c 0,005 <LOQ*a 0,00000 0,00016a 0,00001 0,00010c 0,00001 B 0,1852ab 0,013 0,2057b 0,009 0,00034a 0,00003 0,00011a 0,00000 0,00100b 0,00005 C 0,1589ab 0,002 0,2779a 0,002 0,00024a 0,00004 0,00014a 0,00004 0,00151ab 0,00016 D 0,2623a 0,016 0,2911a 0,008 0,00055a 0,00005 0,00015a 0,00000 0,00150ab 0,00020 E 0,2887a 0,018 0,3117a 0,001 0,00160a 0,00084 0,00021a 0,00006 0,00159a 0,00005 F 0,2411a 0,074 0,0640c 0,021 0,00062a 0,00016 0,00013a 0,00000 0,00023c 0,00001 G 0,1365ab 0,000 0,1996b 0,001 0,00064a 0,00015 0,00016a 0,00002 0,00104ab 0,00000
34 Figure 12 - Scores (A) and Loadings (B) of the Principal Component analysis of Experiment 2
A B C D E F G -3 -2 -1 0 1 2 3 -5 -4 -3 -2 -1 0 1 2 3 4 5 P ri n ci p al C o m p o n e n t 2 (2 3, 8 % ) Principal Component 1 (41,26%)
A
-0.5 -0.3 -0.1 0.1 0.3 0.5 -0.3 -0.1 0.1 0.3 0.5 P ri n ci p al C o m p o n e n t 2 (2 3 ,8 % ) Principal Component 1 (41,26%)B
ETH ETHACET PROP BUT 2METPROP 2METBUT 3METBUT 2PHETOH ISOACET ETHEX PHEACET35 Table 4 - Sensory evaluation results for Experiment 2
Treatment
Aromatic
intensity Fruitty aroma Floral aroma Sulphur Ethyl acetate Acetaldehyde
Volatile
acidity Wine like
score SD score SD score SD score SD score SD score SD score SD score SD
A 3,10a 0,83 0,82b 1,11 0,64a 0,64 0,64a 1,49 0,64a 1,37 1,91a 1,56 1,36a 1,55 1,09b 1,00 B 3,18a 0,72 1,91ab 1,08 1,18a 1,03 0,45a 0,99 0,73a 1,14 1,73a 1,54 1,55a 1,56 2,27b 1,21 C 3,30a 1,10 1,55ab 0,89 1,36a 1,37 0,09a 0,29 0,27a 0,45 1,18a 1,75 1,00a 1,13 2,36b 0,88 D 3,30a 0,90 1,90ab 1,14 1,18a 1,19 0,09a 0,29 0,55a 0,78 1,45a 1,56 1,00a 1,71 2,36b 1,15 E 3,67a 1,05 1,55ab 1,37 1,00a 1,04 0,55a 1,23 1,00a 1,21 1,18a 1,59 1,18a 1,64 2,22b 1,47 F 3,50a 1,20 1,82ab 1,34 1,09a 1,31 0,36a 0,88 0,36a 0,64 1,55a 1,78 0,82a 1,19 2,09b 0,90 G 3,18a 0,83 1,64ab 1,55 0,55a 1,23 0,64a 1,23 0,64a 1,37 0,91a 1,50 1,09a 1,56 2,55b 1,37 Wine 3,64a 0,98 3,00a 1,18 2,27a 1,48 0,82a 1,40 0,27a 0,62 0,18a 0,57 0,45a 0,89 4,20a 0,98
36
9. Conclusions
The wine aroma basis could be produced by fermenting a synthetic grape juice, showing that yeast metabolic products have significant importance in it. The amino acid composition of the fermenting medium can have an important influence on the volatile compounds formed by Saccharomyces cerevisiae and, therefore, lead to differences in the sensory perception of wine aroma.
Higher levels of volatile compounds were found when a set of aroma precursor amino acids were added to the medium leading to a higher sensory perception of fruity and floral notes, aromatic intensity and wine-like character.
Moreover, the absence of one of the aroma precursor amino acids was not enough to cause great modifications on sensory perception.