Multifractal Analysis of Particle Dispersion and Interphase Percolation in Nanocomposites
Eduardo do Nascimento Karasinskia, Fernando Deeke Sasseb, Luiz Antonio Ferreira Coelhob*
Received: April 10, 2018; Revised: June 13, 2018; Accepted: July 17, 2018
The dispersion of nanoparticles in nanocomposites of an epoxy matrix reinforced with alumina (10nm) and zinc oxide (100nm) is analyzed using FIB/FESEM images, varying the volumetric fraction
of fillers from 0.2 % to 6.0 %. The nanofillers dispersion images were transformed to binary files and the multifractal spectrum was calculated. From these data the relation between agglomerate and individual particle dimensionalities related to the interphase percolation was investigated. Interphase percolation of nanocomposites should be achieved when the dimensionality of agglomerations is greater than the dimensionality of individual particles. The actual percolation state of the interphase is determined, matching the experimental nanocomposites behavior for electrical behavior at AC and dielectric breakdown at DC.
Keywords: Nanocomposite, Percolation, Interphase, Multifractal.
*e-mail: [email protected].
1. Introduction
One of the most important issues related to nanocomposites
is the interphase. It is a region around the nanoparticles where properties are somehow different from the matrix and from the nanoparticle. At a very low volumetric fraction of nanoparticles, this region can be percolated the material. For instance, in polymeric matrices with carbon nanotubes, percolation can be reached at 0.1 %. Aspect ratio is an important issue for 1-D tubular structure such as carbon nanotubes. It is also
interesting to see recently the use of tomography to study the percolation threshold in nanocomposites1-3.
In general, interphases have at least two layers, the first is tightly bonded to the nanoparticle and the second is more
loosely connected4. At the interphase, molecules or chains can
have steric confinement reducing their mobility and dipoles mobility. Also, at the interphase, we can have alterations in crystallinity and chain network density alterations5-7. It is
well known from colloid science that a diffusive double layer is present in any nanocomposite where an electric field is applied. Some potential barriers are present at the interphase trapping electric charges and reducing their mobility when
the nanoparticles are present8-10.
Increasing the fraction of nanoparticles at a constant
volume, the interphase around of different nanoparticles will approach each other. After a critical value, there will be an overlap of this region through the bulk of the material, thus the interphase is percolated. The percolation of the interphase in nanocomposites is very sensitive to the processing technique. Dielectric breakdown, glass transition temperature and
tensile strength are typical examples of properties where the
dispersion state of nanoparticles are very important. One of the key issues in nanodielectric materials is related to the dispersion state of the reinforcements. Several special issues
of specialized journals only accepted for peer review process
works having micrographs from any electronic microscopy technique regarding the dispersion state of nanofillers. If we consider that nanoparticles are randomly distributed into the
matrix, the volume of interphase converges up to a critical
value where percolation is reached. Thus, the volume of interphase can be characterized as a fractal object11.
The multifractal formalism have been used to correlate
fracture toughness as a function of fracture surface roughness
in composites materials. Zhang and collaborators12,13 observed that the width of multifractal spectra is related to competition
between ductile fracture and brittle fracture, consequently the width of multifractal spectra could be used to characterize the surface morphology and mechanical properties quantitatively. Pérez and collaborators14, noticed that the regularity of
the topography morphology of fractured surfaces can be related to the variation of the singularity width in PP/CaCO3
composites. In another work15, the fracture surfaces analysis of PP/Quartz composites allows correlating multifractal spectra
and material toughness. However, the authors suggested that
the experimental procedure of multifractal theory should
be improved to define the most sensitive parameter. Starch/ PCL blend reinforced with distinct nanoclays clearly showed
variations in the width of the multifractal spectra16. These
variations suggested that, the fracture surfaces indicated to be more irregular in the toughest nanocomposites. It should be pointed out that the presence of brittle and ductile mechanisms is related to more regular or irregular surfaces, respectively. Mills and co-workers17 applied multifractal analysis of SEM aInstituto Federal de Educação, Ciência e Tecnologia de Santa Catarina, Rua Fadho Thomé, 3000,
89503-550, Caçador, SC, Brasil
bDepartamento de Matemática, Universidade do Estado de Santa Catarina, Rua Paulo Malschitzki, 200,
images to improved method for the dispersion assessment of
flame retardant fillers in EVA. The results related the effect of different filler surface treatments on dispersion quality and flame retardant effectiveness. Another example18 was in the pharmaceutical industry and it requires the development
of complex formulations of lipophilic and hydrophobic compounds. Multifractal analysis showed that the nature of
interparticle interactions in the inorganic carrier as well as the
presence of amorphous β-Carotene had an influence on the
microstructure and thus on the mechanical performance of
the polyvinylpyrrolidone-vinylacetate. The use of multifractal analysis and the study of the mechanical properties can be connected to better characterize and understand complex formulations obtained, since it can help to tailor the final dosage form according to desired product quality attributes.
The aim of this work is to quantify the dispersion of
nanoparticles in polymeric matrices using a multifractal analysis and propose an adequate parameter to identify the
interphase percolation.
2. Materials and Methods
2.1 Preparation of the nanocomposites
In this work was used an epoxy system diglycidyl ether of bisphenol-A (DGEBA) commercial name NPES 903H-NanYa
and o-tolyl biguanidine (OTBG) commercial name Aradur
2844-Huntsman. The proportion of hardener/resin is 5.7 %. The density of the epoxy polymer was 1.2 g cm-3. Al
2O3
-filler was used with a density of 2.8 g cm-3 and surface area of 231 m2 g-1 (BET method). ZnO-filler was used with a
density of 5.6 g cm-3 and surface area of 12 m2 g-1 (BET
method). Both nanoparticles were supplied by Nanum and used as-received.
All nanocomposites and the neat epoxy were prepared
in a twin-screw extruder DCT19-Tecktril using a screw speed of 490 rpm and temperature of 90 °C in all zones. A calender at 10 °C was used for cooling, and subsequently, the material was ground and sieved. Two cycles of extrusion
were employed for the preparation of all nanocomposites
aiming to obtain a more homogeneous fillers distribution. All materials studied were cured at 200 °C for 10 min. We will designate the respective compositions used in this work as: pristine epoxy - P; epoxy filled with Al2O3 - A; and epoxy
filled with ZnO - Z, following by its nominal volumetric fraction, e.g. Z0.2 is the nanocomposite reinforced by 0.2 % in volume of the ZnO and A0.4 is the nanocomposite reinforced by 0.4% in volume of Al2O3. The compositions
prepared in this work were eight in total: A0.4; A1.2; A2.4; A6.0; Z0.2; Z0.6; Z1.2 and Z3.0.
2.2 Multifractal analysis of fillers dispersion
By applying focused ions beams (FIB) in a sample, an area was sliced in five distinct regions of the each sample
revealing the soaked fillers. Images were collected from back-scattered electrons for higher contrast between matrix and fillers using field emission scanning electronic microscopy (FESEM) Auriga Compact-Zeiss device.
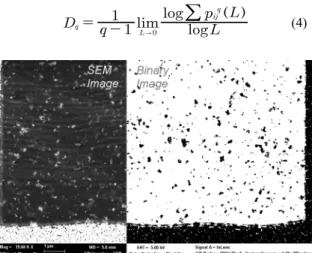
The collected SEM images are converted to a binary
representation, where the nanoparticle sites are represented
by black pixels and white pixels representing matrix regions, as shown in Fig.1.We have applied the counting box method to scaling of the clusters distribution regarding the length scale using a square grid.
The nonlinear systems can often be characterized by
multifractal formalism19. In the square grids with boxes of size L it is calculated the probability for an occupied site by
nanoparticles in the image and later it is possible to connect it to the multifractal spectrum. As usual, it is defined the probability distribution in the box (i,j) by :
(1)
Where nij (L) is the number of black pixels (nanoparticles)
in a given length scale counted for the box (i,j). Then we
can define an exponent singularity strength (α)20,21 according
to Eq. 2.
(2)
If we count the number of boxes Nα(L) where the
probability distribution has singularity between α and
α+dα, then the Hausdorff dimension f(α) can be defined
as the fractal dimension of the set of boxes with same
singularity20,21 by Eq. 3.
(3)
The generalized fractal dimension Dqwhich correspond to scaling exponents for the qth moments of the measure, provide an alternative description of the singularity measure20,21.
They are defined by Eq. 4.
(4)
Figure 1. Treatment of an electronic microscopy image for a
nanocomposite to make binary images p L n L n L ij ij ij = Q Q Q V V V
/
pijQ VL .La
N L Lf
.
a
a
-Q V QV
limloglog
This reflects a connection with the thermodynamic
formalism22, where q is the moment order and τ(q) is the
mass exponent. They are conjugate variables to the fractal
dimension f(α), and it can be obtained from the partition function χq(L) given in Eq. 5.
(5)
In this case, the fractal dimension f(α) and generalized fractal dimension Dq can be easily transformed into the
other from a Legendre transformation20,21, according to Eq.
6, Eq. 7 and Eq. 8.
(6)
(7)
(8)
Apart from a slight variation of the moment order, the extent of variation in the data set of the fractal dimension is
negligible. A range of -10 ≤ q ≤ 10 was used. The multifractal
spectra were calculated with the plugin Fraclac of the
ImageJ software.
3. Results and Discussion
3.1 Multifractal analysis
Very briefly, we are going to introduce some important
concepts of the percolation theory23,24 for this work. When
there are no distance between two or more black pixels which
representing the nanoparticles on images, they constitute
a cluster. The probability that a black pixel is observed in
a reference lattice converge exponentially to percolation
threshold. Above the percolation threshold, large clusters will be observed homogeneously in all lattice, and their size is proportional to the length of scale. Bellow the percolation threshold the size of the finite clusters have fractal dimension smaller than the dimension observed in the reference lattice, the cluster density is not uniform. Indeed, the fractal behavior of a system contains information about the internal structure of clusters depending of the probability of a site is occupied. The percolation is the probability for one site to belong to an infinite cluster. For multifractal analysis of the images, an agglomerate of nanoparticles can be described as a cluster, in this case, the volumetric fraction of fillers is similar to the probability for an occupied site or black pixel in treated image. As exposed in introduction, some papers 13-15 show
that the regularity of filler dispersion can be related to the variation of the singularity width. Therefore, multifractal analysis can be used to describe the dispersion state of
nanofillers and it will be applied here to determine the percolation of the interphase.
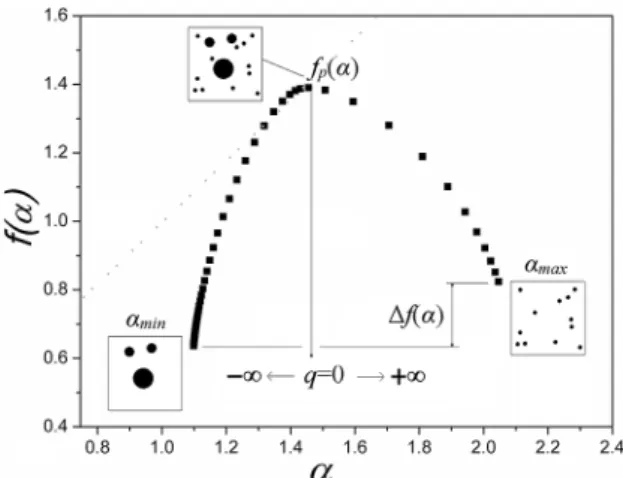
Aiming to help the reader to understand the multifractal spectra it is important to state that two regions are important,
the region of minimum and maximum singularity, in Fig. 2 they are represented by αmin and αmax, being singularity
width Δα = αmax - αmin . The region of maximum singularity
is related to the smaller probabilities of distribution, and
the region of minimum singularity is related to the higher
probabilities20,21. The variation in the dimensionality is given
by Δf(α) = f(αmax) - f(αmin ) and indicates the corresponding
variation in the number of boxes with minimum and maximum probability of distribution. According to literature decreasing the difference f(αmax ) - f(αmin)decrease the multifractal
character of the system. When q = 0 we do have a unique fractal dimension at fp (α) for the data, and when compared
different spectra for the same material at different content of a nanofiller the maximum, when Δf(α)≈0, value can be
related to the percolation threshold. As very well pointed out by Blacher and co-workers25 at q = 0, f(α) = α, and this
is the maximum possible value of f(α).
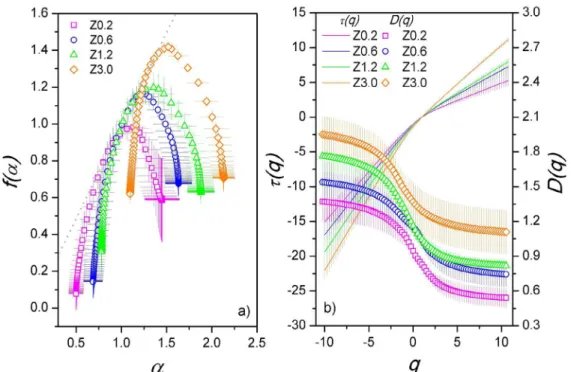
In Fig. 3 is presented the FIB/FESEM images of one slice for epoxy/ZnO nanocomposites. In Fig. 4 is presented multifractal spectra for epoxy/ZnO nanocomposites, the results and errors bars from averages over five different sliced regions of each sample. As shown in Fig. 4, the average
value of f(αmin) follow an increase from approximately 0.1 at
0.2% v/v to 0.6 at 3.0% v/v of the volumetric fraction. This
is an indication that higher the volumetric fraction, higher
the state of agglomeration. It should be noted that average
f(αmax) is in the region about of 0.7 at any volumetric fraction.
It is not observed significant variations in the singularity width Δα because this parameter have been correlated to fracture surface roughness in composites. Therefore, mechanism
of loss energy in material fracture are involved leading to
Δα increase. To analyze the filler dispersion this parameter must be unappropriated, and other quantity need be used.
L p q L
q ijq q
| Q V=
/
Q
V
= xQVD
qq
q
1
x
=
-
Q V
f
Q
a
V
=
a
q
-
x
Q
q
V
d d
q q
a= x
Q V
Figure 2. Multifractal spectrum indicating the principal amounts
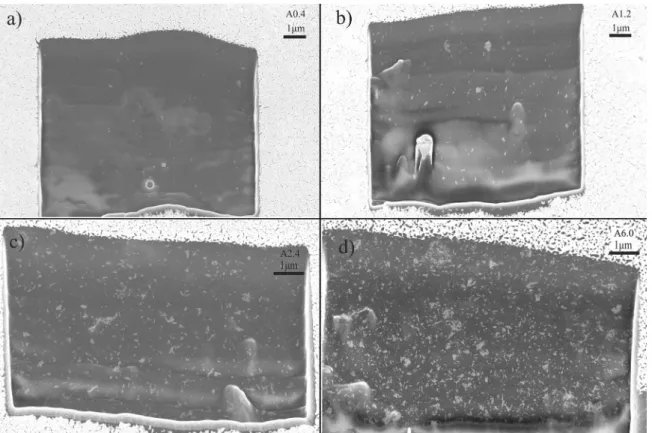
Figure 3. Images obtained by field emission scanning electronic microscopy with backscattered electrons and voltage 5
kV in an area sliced with focused ions beam of the nanocomposite DGEBA/OTBG filled with zinc oxide with a) 0.2 %, b) 0.6 %, c) 1.2 % and d) 3.0 % all nominal volumetric fractions
Figure 4. a) Multifractal spectrum of the particle dispersion for ZnO reinforced epoxy matrix nanocomposites Z, followed
Another important feature of the multifractal analysis
is when the value of Δf(α) is zero. In this situation, the agglomerates present similar divergence than individual particles since f(αmax) = f(αmin). For the Z0.2 nanocomposite,
the average value of Δf(α) is 0.5 indicating a predominance
of individual nanoparticles over agglomerates about the dispersion state. The value where Δf(α) = 0 is crucial for
understanding the percolation of the interphase. At this point,
we are proposing that the predominance of divergence of the agglomerates over the individual nanoparticles is an
indication that interphase has percolated.
In the case of nanocomposite reinforced with ZnO, the
critical volume fraction of particles to interphase percolation
must be approximately 3.0 %, and the fractal dimension of fillers dispersion is fp (α) = 1.42 according to figure 4. It should
be pointed out that percolation of interphase is different from percolation of nanoparticles. The first percolation to appear
is the percolation of the interphase, increasing the volumetric
fraction of nanoparticles. After that, if one continues to
increase the fraction of reinforcements, the percolation of
nanoparticles will appear. As mentioned in introduction, the interphase must be a matrix region extended from interface with particles which the materials properties is altered. Due
to extremely high interfacial area in nanocomposites, the
interphase can be predominant over the material behavior. The interphase influence will be directly related to filler
dispersion state, therefore is essential have an adequate
parameter to quantify the fillers dispersion in nanocomposites. It is possible to find in the literature for percolation of sites in 2D that critical fractal dimension is Dc = 1.89 23,24. If
the fraction of reinforcements continued to be increased in nanocomposites, then particle percolation would have been resolved probably at the dimensionality of 1.89. In Fig.4b, for the nanocomposite Z3.0, D(q) = 1.92 in asymptote to q → −∞. This value indicates that, if were present only
the biggest agglomerations, the fractal dimension of the composite would be similar to the respective theoretical value at the critical percolation threshold.
In Fig. 5 is presented the FIB/FESEM images of one
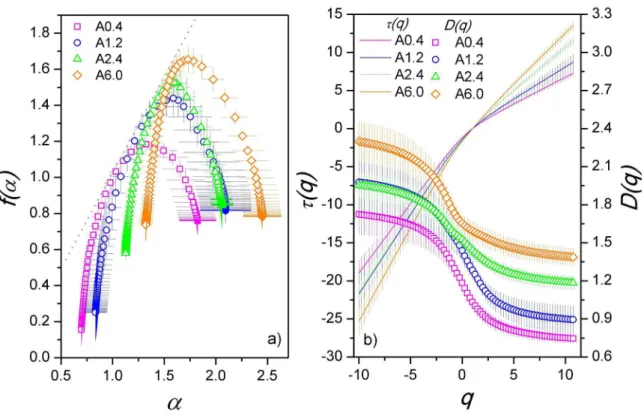
slice for epoxy/Al2O3 nanocomposites. Multifractal spectra for nanocomposites with Al2O3, are presented in Fig. 6, a
similar behavior to nanocomposites reinforced with ZnO is observed. There is an increase in the fractal dimension with increasing the volumetric fraction of nanoparticles. For instance in the sample A0.4, average f(αmin) = 0.2, increase for an average f(αmin) = 0.6 at A2.4 sample. The value f(αmax) = 0.8 is almost constant in all epoxy/Al2O3
samples, as in the samples with ZnO.
The increase of values of the general fractal dimensions of the nanocomposites reinforced with Al2O3, compared to
nanocomposites reinforced with ZnO, occurred due to the
higher agglomeration state which was expected, since this
nanoparticle had a much higher surface area. For example,
Figure 5. Images obtained by field emission scanning electronic microscopy with backscattered electrons and voltage 5 kV in an area
the sample A2.4 whose particle fraction is lower than in Z3.0, the fractal dimension of the set is higher fp (α) = 1.53.
If the percolation of the interphase should be achieved in the condition where Δf(α) = 0, according to our proposal,
in sample A2.4 must not have occurred percolation of interphase, as pointed out by the multifractal spectrum where is about Δf(α) = 0.2. Only, to sample A6.0 it can be seen
Δf(α) = 0. In the first fraction particles in which Δf(α) = 0,
the dimensionality of higher agglomerates should be about 1.89, as described above. Nevertheless, the calculated value of the generalized dimension to A6.0 sample, D(q) = 2.36
the asymptotic behavior in q→−∞, observing Fig.6b. In this
case, the dimensionality of agglomerate exceeds the scaling
for a set of two-dimensional data. We anticipated that the filler fraction for critical percolation is located around 3.5 % to the alumina-nanocomposites, but, it was not produced nanocomposites at this fraction.
3.2 Interphase percolation
To connect our methodology to real experiments, data
previously published from26 will be evocated. In that work
spectroscopy of impedance and dielectric strength were measured for all eight nanocomposites which images were
analyzed here in this work.
The main difference between nanodielectrics and neat epoxy is the location/polarization of spatial charges. For the neat epoxy, the process of conduction is using hopping. After the addition of nanoparticles, there is a clear effect of interfacial polarization. This leave to the slope of permittivity in nanocomposites with A0.4 and Z0.2 is much higher than
the neat epoxy26. Observing the dielectric losses, it is possible
to see a quasi-DC behavior of the samples Z0.2 and A0.426.
Quasi-DC conduction process means that charges have limited mobility, in general following tortuous paths, but they can
not go through the whole material27. There is evidence that residual water has a role in this scenario28. Also, there is the
formation of a diffusive double layer at interfaces. The multifractal analysis for sample A2.4 indicated a situation near percolation. In the work26 the quasi-DC
effect could not be characterized in sample A2.4, although a smooth relaxation peak is presented, characterizing relaxation attributed to spatial charges. When interphase is percolated,
there is, at least, one physical path for conduction through
the material besides hopping, this behavior is well known as conductivity-DC. As exposed in26 the Z3.0 sample show
conductivity-DC. According to our analysis percolation was reached in Z3.0 sample. In this case, the percolation and overlap of interphase are well established in the material, corroborate to multifractal analysis of percolation.
Figure 6. a) Multifractal spectrum of the particle dispersion for alumina reinforced epoxy matrix nanocomposites A, followed by its
Data from dielectric strength26 measured for the same
samples described in this work give us more evidence of percolation. In the A0.4 nanocomposites with a low fraction of nanoparticles, there is an increase of 50% in dielectric
strength compared to the neat epoxy26. From this, the values
of dielectric breakdown presented a sharp decrease due
to interphase overlapping26. At the critical fraction where
percolation is supposed to be reached, the values of dielectric breakdown are lower than pristine epoxy26. These data
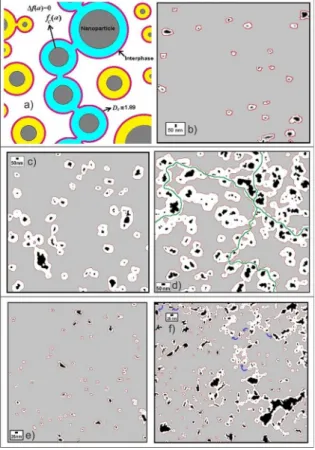
corroborate for our ideas of the percolation of interphase. The Fig. 7a summarizes illustratively the exact interphase percolation threshold when Δf(α) = 0, representing the critical
fractal dimension of fillers fc (α), the critical theoretical dimension for percolation of interphase Dc = 1.89. In
Fig. 7b is represented interphase on a binary image for the nanocomposite Z0.2. The interphase zones are quite far apart, and there is no overlap of the interphase. Fig.7c shows the same schematic illustration, however, on a binary image of the Z1.2 sample. In this case, the material is not percolated, although some overlap interphase zones. The Fig. 7d shows the Z3.0 nanocomposite with percolated interphase, i.e. interphase is superimposed forming paths all length of material. The Fig. 7e illustrates the interphase for the nanocomposite A0.4, similar to the sample Z0.2.
Finally, the Fig. 7f illustrates the interphase to A2.4 sample.
This material composition is not percolated, however, is in
a state very close to the percolation threshold. This enables that charges may hop overlapping regions of interphase.
4. Conclusion
Quantify the degree of particles dispersion in nanocomposites
is very important to predict their properties. Therefore, the multifractal analysis can offer an adequate method to correlate the final performance of nanocomposites to interphase percolation. Using scanning electronic micrographs it is possible to point out where the interphases reached percolation for nanocomposites. The null value of variation in the dimensionality given by Δf(α) = f(αmax) - f(αmin) connected to the maximum value of f(α) according to our experimental
results allowed the determination of the percolation threshold. Data from electrical properties for this system indicated that our hypothesis of percolation of the interphase is attained.
5. Acknowledgements
The financial support to the activity by CAPES and CNPq is greatly acknowledged.
6. References
1. Putz KW, Palmeri MJ, Cohn RB, Andrews R, Brinson LC. Effect of Cross-Link Density on Interphase Creation in Polymer Nanocomposites. Macromolecules. 2008;41(18):6752-6756.
2. Castellino M, Chiolerio A, Shahzad MI, Jagdale PV, Tagliaferro A. Electrical conductivity phenomena in an epoxy resin-carbon-based materials composite. Composites Part A: Applied Science and Manufacturing. 2014;61:108-114.
3. Chiolerio A, Sangermano M. In situ synthesis of Ag-acrylic nanocomposites: Tomography-based percolation model, irreversible photoinduced electromigration and reversible electromigration.
Materials Science and Engineering: B. 2012;177(4):373-380.
4. Tsagaropoulos G, Eisenberg A. Dynamic Mechanical Study of the Factors Affecting the Two Glass Transition Behavior Of Filled Polymers. Similarities and Differences with Random Ionomers. Macromolecules. 1995;28(18):6067-6077.
5. Qiao R, Brinson LC. Simulation of interphase percolation and gradients in polymer nanocomposites. Composites Science and Technology. 2009;69(3-4):491-499.
6. Tanaka T, Kozako M, Fuse N, Ohki Y. Proposal of a multi-core model for polymer nanocomposites dielectrics. IEEE Transactions on Dielectrics and Electrical Insulation. 2005;12(4):669-681.
7. Ash BJ, Schadler LS, Siegel RW. Glass transition behavior of alumina/polymethylmethacrylate nanocomposites. Materials Letters. 2002;55(1-2):83-87.
8. Sun Y, Zhang Z, Moon KS, Wong CP. Glass transition and relaxation behavior of epoxy nanocomposites. Journal of Polymer Science Part B, Polymer Physics. 2004;42(21):3849-3858.
Figure 7. Interphase illustrations on nanocomposites. a) Exact
percolation threshold showing particle and interphase dimensionalities,
9. Seiler J, Kindersberger J. Insight into the interphase in polymer nanocomposites. IEEE Transactions on Dielectrics and Electrical Insulation. 2014;21(2):537-547.
10. Li S, Yin G, Bai S, Li J. A new potential barrier model in epoxy resin nanodielectrics. IEEE Transactions on Dielectrics and
Electrical Insulation. 2011;18(5):1535-1543.
11. Mandelbrot BB. The Fractal Geometry of Nature. New York:
W.H. Freeman; 1983.
12. Zhang YH, Bai BF, Chen JB, Shen CY, Li JQ. Multifractal
analysis of fracture morphology of poly(ethylene-co-vinyl
acetate)/carbon black conductive composite. Applied Surface Science. 2010;256(23):7151-7155.
13. Zhang YH, Bai BF, Li JQ, Chen JB, Shen CY. Multifractal
analysis of the tensile fracture morphology of polyvinylidene
chloride/glass fiber composite. Applied Surface Science.
2011;257(7):2984-2989.
14. Pérez E, Bernal C, Piacquadio M. Multifractal analysis of tensile toughness and filler dispersion for polypropylene-CaCO3 composites. Applied Surface Science. 2012;258(22):8940-8945.
15. Pérez E, Bernal C, Pérez CJ. Internal structure analysis of Polypropylene/quartz composites related to their toughness.
Polymer Composites. 2016;37(5):1488-1496.
16. Pérez E, Pérez CJ, Alvarez VA, Bernal C. Fracture behavior of a commercial starch/polycaprolactone blend reinforced with different layered silicates. Carbohydrate Polymers.
2013;97(2):269-276.
17. Mills SL, Lees GC, Liauw CM, Lynch S. An Improved Method for the Dispersion Assessment of Flame Retardant
Filler/Polymer Systems Based on the Multifractal Analysis of
SEM Images. Macromolecular Materials and Engineering.
2004;289(2004):864-871.
18. Adler C, Teleki A, Kuentz M. Multifractal and mechanical analysis of amorphous solid dispersions. International Journal of Pharmaceutics. 2017;523(1):91-101.
19. Harte D. Multifractals: Theory and Applications. London: Chapman
and Hall; 2001.
20. Halsey TC, Jensen MH, Kadanoff LP, Procaccia I, Shraiman BI.
Fractal measures and their singularities: The characterization of strange sets. Physical Review A. 1986;33(2):1141-1151.
21. Chhabra A, Jensen RV. Direct determination of the f(a) singularity spectrum. Physical Review Letters. 1989;62(12):1327-1330.
22. Lam L, ed. Introduction to Nonlinear Physics. New York: Springer; 2003.
23. Stauffer D, Aharony A. Introduction to Percolation Theory.
Philadelphia: Taylor and Francis; 1991.
24. Grimmett GR. Percolation. Berlin-Heidelberg: Springer-Verlag;
1999.
25. Blacher S, Brouers F, Anathakrishna G. Multifractal analysis, a method to investigate the morphology of materials. Physica A: Statistical Mechanics and its Applications. 1992;185(1-4):28-34.
26. Nascimento E, Ramos A, Windmoller D, Rodrigo PR, Teruel Juanes RT, Greus AR, et al. Breakdown, free-volume and dielectric behavior of the nanodielectric coatings based on epoxy/metal oxides. Journal of Materials Science: Materials in Electronics.
2016;27(9):9240-9254.
27. Dissado LA, Hill RM. Anomalous low frequency dispersion. Near direct current conductivity in disordered low dimensional materials. Journal of the Chemical Society, Faraday Transactions 2: Molecular and Chemical Physics. 1984;80(3):291-319.