Brazilian Journal of Physics, vol. 33, no. 3, September, 2003 637
Anisotropy and Percolation Threshold in a Multifractal Support
L. S. Lucena, J. E. Freitas, G. Corso, and R. F. Soares
International Center for Complex Systems and Departamento de F´ısica Te´orica e Experimental,
Universidade Federal do Rio Grande do Norte, Campus Universit´ario 59078 970, Natal, RN, Brazil
Received on 16 May, 2003
Recently a multifractal object,Qmf, was proposed to allow the study of percolation properties in a multifractal
support. The area and the number of neighbors of the blocks ofQmf show a non-trivial behavior. The value
of the probability of occupation at the percolation threshold,pc, is a function ofρ, a parameter ofQmfwhich
is related to its anisotropy. We investigate the relation betweenpcand the average number of neighbors of the
blocks as well as the anisotropy ofQmf.
I
Introduction
Due to the work of many physicists, and particularly to the contributions of Dietrich Stauffer, percolation theory has be-came a powerful tool in Science describing phenomena in many areas as geology, biology, magnetism, or social phe-nomena [1, 2]. Despite the enormous success of percolation it has been a theory studied in a support (lattice) that has a single dimension. The only references relating percolation and multifractality concern to the multifractal properties of some quantities of the spanning cluster at the percolation threshold [3, 4].
Recently, a model to study percolation in a multifractal was proposed [5] in the literature. In fact, the authors have created an original multifractal object,Qmf, and an efficient
way to estimate its percolation properties. In this work we study in detail the method to estimatepcfor this multifractal
and discuss the relation betweenpc, some topologic
charac-teristics, and the anisotropy ofQmf.
The multifractal object we develop,Qmf, is an intuitive
generalization of the square lattice [5]. Suppose that in the construction of the square lattice we use the following algo-rithm: take a square of size1and cut it symmetrically with vertical and horizontal lines. Repeat this processn-times; at thenthstep we have a regular square lattice with2n×2n
cells. The setup algorithm ofQmf is quite similar, the main
difference is that we do not cut the square in a symmetric way. In section2we explain in detail this algorithm.
The development of Qmf has a twofold motivation.
Firstly, there are systems like oil reservoirs that show mul-tifractal properties [6] and are good candidates to be mod-eled by such object. Secondly, there is indeed a much more general scope: we want to study percolation phenomena in lattices that are not regular, but that are multifractal in the geometrical sense. It is important to know how site percola-tion transipercola-tion happens in lattices in which the cells vary in size and also in the number of neighbors.
In this work we analyse some geometric and topologic properties of the percolation cluster generated onQmfat the
percolation threshold. The paper is organized as follows: in
Section II we present the process of construction ofQmf
and the algorithm for the estimation ofpc, in Section III
we show the numerical simulations concerning the percola-tion thresholdpcand the topologic properties ofQmf; and
finally in Section IV we present our final remarks and com-ments.
II
The model
In this section we show the process of building the multifrac-talQmfand the key concepts to estimatepc. We start with a
square of linear size1and a partition parameter0< ρ <1. For reasons that will be clear later,ρ= s
r, wheresandrare
integers. We call the multifractal built from this parameterρ
as the ”ρ−Qmf”, or ”(r, s)−Qmf”.
The first step, n = 1, consists of two sections of the square: a vertical and an horizontal. Initially the square is cut in two pieces of area s+rr = 1+1ρ and s+sr = 1+ρρ by a vertical line. This process is shown in Fig. 1(a), where we use as an exampleρ= s
r =
2
3. The horizontal cut in which
we use the same partitionρis shown in Fig. 1(b). The first partition of the square generates four rectangular blocks: the largest one of area(1+ρρ)2, two of area(1+ρρ)2 and the small-est one of area( 1
1+ρ)
2. The difference between the largest
area and the smallest one increases asρ→0, moreover, the blocks get more and more stretched in this limit. Therefore
ρmeasures the anisotropy ofQmf.
In the second step,n = 2, we repeat the same process of vertical and horizontal sections as in step1. Generically we get22nblocks after thenth-step. The partition process
produces a set of blocks with a variety of areas. We call a set of all elements with the same area as ak-set. At thenth-step
of the algorithm the partition of the square in blocks follows the binomial rule:
A=
n
k=0
Cn k
ρ
1 +ρ
k 1
1 +ρ
n−k =
ρ+ 1
ρ+ 1 n
= 1.
638 L. S. Lucenaet al.
(a)
(b)
Figure 1. The initial step,n= 1, in the formation ofQmf. In (a) a
vertical line cut the square in two pieces according toρ. Two hori-zontal lines sectioning the rectangles by the same ratio are depicted in (b).. The underlying square lattice is depicted with thin lines.
The number of elements of ak-set isCn
k. In reference [5]
we see that asn→ ∞all thek-sets determine a monofractal whose dimension isdk =limn→∞
log Ck n s
k r(n−k)
log(s+r)
n
2 . In this limit, the ensemble of allk-sets engenders the multifractal objectQmf itself.
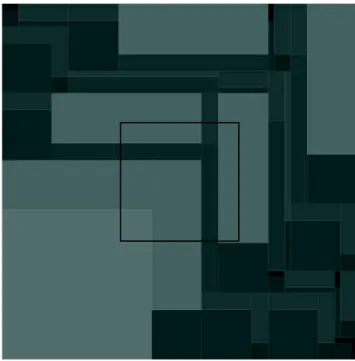
Figure 2 shows a picture ofQmf forρ= 13 andn= 4.
We use the following code color: blocks of equal area have the same tonality. In other words, all the blocks of a same
k-set share a common gray-tone. The general view of the object shows an anisotropic, heterogeneous lattice with a non-trivial topology. The anisotropy ofQmf will change
the percolation threshold as we investigate in the next sec-tion. Before that we study in more detail the problem of percolation.
Figure 2. The objectQmf forρ= 13 andn = 4, we introduce a
square inside the figure to help the visualization.
The main subject of this work is the study of percolation properties ofQmf. To perform such a task we develop a
per-colation algorithm. The perper-colation algorithm forQmf start
mapping this object into the square lattice. The square lat-tice should be large enough that each line segment ofQmf
coincides with a line of the lattice, this condition imposes thatρis a rational number (it means,randsare integers). Therefore we consider that the square lattice is more finely divided thanQmf. In this way all blocks of the
multifrac-tal are composed by a finite number of cells of the square lattice. To explain the percolation algorithm we suppose thatQmf construction is at stepn. We proceed the
perco-lation algorithm by choosing at random one among the22n
blocks ofQmf independent of its size or number of
neigh-bors. Once a block is chosen all the cells in the square lat-tice corresponding to this block are considered as occupied. Each time a block ofQmf is chosen the algorithm check if
the occupied cells at the underlying square lattice are con-nected in such a way to form a spanning percolation cluster. The algorithm to check percolation is similar to the one used in [7, 8, 9, 10].
III
Numerical results
In this section we show numerical results concerning the percolation threshold. Before the numerics we introduce some definitions. We call lattice the square lattice under-lyingQmf. Following the literature [1] we callpthe
prob-ability of occupation of a lattice site. RL is the probability
that for a site occupationpthere exists a contiguous clus-ter of occupied sites which crosses completely the square lattice of sizeL. pc is the probability of occupation at the
Brazilian Journal of Physics, vol. 33, no. 3, September, 2003 639
RL. We use two of them: ReL is the probability that there
exits a cluster crossing either the horizontal or the vertical direction, andRb
Lis the probability that there exits a cluster
crossing both directions. At the limit of infinite lattice size
Re
LandRbLconverge to a common value for the square
lat-tice case. Besides we callpe
cthe value ofpcestimated from
Re
L, it means, the averagepcover lattices that percolate in
one direction, the horizontal or the vertical. And, similarly,
pb
cthe value ofpcestimated fromRbL.
(a)
(b)
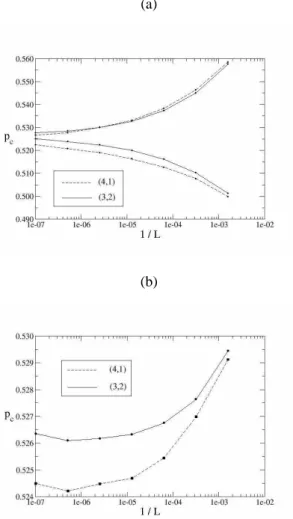
Figure 3. In (a) we showpcversusL1 forρ= 23 (solid line) and
ρ = 1
4 (dashed line). The upper values correspond top
b cand the
lower values tope
c; it is used4 ≤ n ≤ 10. In (b) we plotpave
versus L1 for the same data.
Figure 3 illustrates the behavior ofpe
c andpbc for7
dif-ferent lattice sizes. Two typical values ofρare used:ρ= 2 3
(solid line) andρ= 1
4 (dashed line). In Fig. 3(a) we show
bothpc versus L1, the upper values corresponds topbc and
the bottom values to pec. The lattice size, L = (r+s)n,
corresponds to4≤n ≤10, in both casesr+s= 5. The data of the upper branch of the figure collapse into a sin-gle curve, diversly from the lower branch. In other words, the curves of(2,3)−Qmf and(4,1)−Qmf share roughly
the same pe
c but diversepbc. The reason for this feature is
the strong anisotropy of(4,1)−Qmf compared to the case
(2,3)−Qmf. The anisotropy of the percolation cluster does
not affectpcin both directions, but it affectspcin one
direc-tion. In fact, the percolation in both directions comes from
an average over both directions, in such situation, any even-tual anisotropy effect of the percolation cluster vanishes be-cause of the average.
An useful way to definepc is to take the average value
pcave = p e c+p
b c
2 . In Fig. 3(b) we plotpcave versus 1
L
cor-responding to the same data Fig. 3(a). We observe in this figure that both curves converge to a saturation value that is not the same. The difference between the two cases is related to the curve of pb
c. The anisotropy (stretching of
the blocks) due toρimplies an anisotropy in the percola-tion cluster. Such anisotropy determines that the percolapercola-tion cluster does not have a correlation length independent of the direction. Because the percolation cluster is anisotropic the symmetry betweenpe
c andpbcshould fail. Therefore, we
ex-pect that for smallerρ(more anisotropy in the multifractal) a greater difference inpcave will appear. Fig. 4 confirm this
tendency for diverse values ofρ.
Figure 4 showsp¯c versusρ. To obtainp¯c we make an
average ofpcave after the saturation process, it means, for
n ≥ 8. The parameterρis indicated in the figure. These values are also shown in Table I. The straight line in the fig-ure is the linear fitting of the data. We focus our attention on two features of the figure: the general tendency of decreas-ingpc withρ, and the anomalous case(3,1)−Qmf. The
main tendency of decreasingpc withρwe have discussed
in connection with anisotropy. We comment the anomalous situation of(3,1)−Qmfin relation to topologic properties
ofQmf which are analyzed in what follows.
Figure 4. Thep¯cversusρ. The chosen values ofρare indicated in
the figure. The straight line corresponds to the linear fitting.
The objectQmf is build of a set of blocksi with
dif-ferent areas,Ai, and number of neighbors,ζi. The number
ζiis a central quantity in the study of topology. A topologic
quantity, that is important in the investigation of the percola-tion threshold, isζavewhich is an average ofζioverQmf. It
meansζave =
iζi
N whereN = 2
2nis the total number of
blocks and the sum in the numerator is performed over the full multifractal. Typicallyζave is a number that does not
640 L. S. Lucenaet al.
Table I
(s, r) (1,1) (4,3) (3,2) (2,1) (5,2) (3,1) (4,1) (5,1)
pc 0.5929 0.5262 0.5262 0.5256 0.5252 0.5253 0.5243 0.5241
ζave 999 5.436 5.436 5.434 5.436 5.426 5.436 5.436
We observe in the row ofζave that all these values are
roughly the same, the exception corresponds to the case of the(3,1)−Qmf. The conclusion we take is that the
varia-tion of the average number of neighbors causes the fluctua-tion in percolafluctua-tion threshold observed in Fig. 4. Thepc of
the(3,1)−Qmfis a little bit greater than the other cases
be-cause it has a smaller average number of neighbors. In other words, because each block of the(3,1)−Qmf, in the
av-erage, has less neighbors, it percolates with more difficulty than the tendency among its group.
IV
Final remarks
To summarize we analyze in this work the role of the anisotropy and the average number of neighbors of Qmf
on its percolation threshold,pc. The multifractal object is
composed by a set of blocks with different areas and num-ber of neighbors. As the parameter definingQmf,ρ, goes to
zero, the multifractal becomes more and more anisotropic. This anisotropy reflects in the percolation cluster creating an asymmetry betweenpe
candpbc.
The anisotropy ofQmf is evident when we comparepec
andpb
c. The observed curves ofpec show a similar
behav-ior, in contrast to the curves ofpb
c. Actually, the measure of
pb
cmakes an average over both directions which erases any
anisotropic effect of the percolation cluster. This erasing ef-fect does not exist when we measurepe
c. The anisotropy of
Qmf decreases withρ(withρ→0the blocks became more
stretched).
A special case in our analysis is the(3,1)−Qmf. This
case is singular compared to others analyzed cases. For a same number of blocks, the(3,1)−Qmfcase has less
neigh-bors than the multifractal blocks corresponding to other val-ues ofρ. This phenomenon is intrinsic to the topology of
Qmf. It implies that the(3,1)−Qmf is less connected,
and, as a consequence, it shows more difficulty to
perco-late. Therefore the case of the(3,1)−Qmf has a
perco-lation threshold slightly higher than its neighbors in the ρ
sequence. In a future work we intend to study in more detail the effect of other topologic characteristics on the percola-tion properties.
The authors gratefully acknowledge the financial sup-port of Conselho Nacional de Desenvolvimento Cient´ıfico e Tecnol´ogico (CNPq)-Brazil, FINEP and CTPETRO.
References
[1] D. Stauffer and A. Aharony, Introduction to Percolation The-ory, (Taylor&Francis, London, 1994)
[2] M. Sahimi, Applications of Percolation Theory, (Taylor & Francis, Bristol, 1994).
[3] K.P.N. Murthy, L.K. Gallos, P. Argyrakis, and K. N. Kehr, Phys. Rev. E, 54 6922 (1996).
[4] O. Stenull and H. K. Jenssen, Phys. Rev. E, 65 045104 (2002).
[5] G. Corso, J. E. Freitas, L. S. Lucena, and R. F. Soares, Phys. Rev. E, in press.
[6] F. Herrmann, A Scaling Medium Representation, a Discus-sion on Well-logs, Fractals and Waves. PhD Thesis, Delft University of Technology, (1997).
[7] J. E. de Freitas, L. S. Lucena, and S. Roux, Physica A 266 81 (1999).
[8] M. E. J. Newman and R. M. Ziff, Phys. Rev. Lett. 85 4104 (2000).
[9] J. E. de Freitas and L. S. Lucena, IJMPC, 11 1581 (2000).