1Departamento de Geologia, Universidade Federal de Ouro Preto – Ouro Preto (MG), Brazil. E-mails: [email protected]; [email protected]
*Corresponding author.
Manuscript ID: 20170127. Received on: 03/04/2017. Approved on: 01/09/2018.
ABSTRACT: In this study, the crystallization dynamics and the fingerprints of two topaz crystals from the Ouro Preto region (Brazil), two from the Eastern Brazilian Pegmatite Province (EBPP), one from the Western part of the United States (US) and one from Pakistan were characterized. The combination of scanning electron microscope-cathodoluminescence (SEM-CL) and laser ablation inductively coupled plasma mass spectrometry (LA-ICP-MS) data allowed for the characterization of these samples. Samples from the Ouro Preto region showed primary crystallization and recrys-tallization processes, which were demonstrated by a CL-heterogeneous core and CL-homogeneous rims in the SEM-CL images. Their fingerprint was composed of Ca, Ti, V, Cr, Mn, Fe, Cu and Zn. Samples from the EBPP showed both dark and CL-homogeneous SEM-CL images, implying slow and late-stage crystallization, typical of pegmatites. Their fingerprints were composed of Li, Nb, LREE, Ta and W, and of Ti, Nb and HREE. A sample from a Western part of the US displayed CL-heterogeneity with growth and resorption events and well-preserved growth zones, which were noticeable through the SEM-CL images. Its fingerprint was composed of Li, Ti, V, Mn, Nb, LREE, Ta and W. A sample from Pakistan showed an evident metamorphic re-crystallization process, which was visible by the incipient and CL-homogeneous luminescence given by the SEM-CL images. Its fingerprint was composed of Ca, Cr, V, Zn, LREE, HREE and W.
KEYWORDS: topaz; trace elements; cathodoluminescence; crystallization dynamics; fingerprint.
A cathodoluminescence-assisted
LA-ICP-MS study of topaz
from different geological settings
Teodoro Gauzzi1,*, Leonardo Martins Graça1
ARTICLE
INTRODUCTION
Topaz is a F/OH-bearing nesosilicate, Al2SiO4(F,OH)2, that is usually found as an accessory and late-stage crystal-lisation mineral in rocks from different geological settings. These include F-rich felsic magmatic rocks (rhyolites and granites), late-magmatic rocks (pegmatites) and post-mag-matic rocks (greisens), hydrothermal veins and, finally, in high-temperature and high- to ultrahigh-pressure meta-morphic rocks, specifically kyanite topaz-bearing quartz-ites (Zhang et al. 2002, Marshall & Walton 2007, Agangi
et al. 2014, 2016).
The main chemical composition of topaz, with regard to its major elements, is constant, and its chemical variation is only related to its OH/F concentration ratio (Skvortsova
et al. 2013). With respect to the trace element concentra-tions of topaz in other studies, Ti, V, Cr, Mn, Fe, Cu, Zn, Nb, LREE, HREE, Ta and W showed relevant variations
(Leroy et al. 2002, Wasim et al. 2011, Wu et al. 2011, Breiter
crystallization dynamics, as well as the fingerprint of each studied topaz crystal.
GEOLOGICAL SETTING
The topaz samples used in this study were from a wide variety of provenances (Fig. 1): two from the Ouro Preto region (Minas Gerais state, Brazil), specifically Dom Bosco and Antônio Pereira mines; two from the Eastern Brazilian Pegmatite Province, namely from Toca da Onça and Ponto de Marambaia (both located in Minas Gerais state) pegmatite bodies; one from Thomas Range (Utah, the United States); and the last one from Ghundao Hill (Mardan District, Pakistan).
Dom Bosco and Antônio Pereira mines
(Ouro Preto, Minas Gerais, Brazil)
The Ouro Preto region is located in the Southeastern part of the state of Minas Gerais, Brazil, and is geologically related to the Quadrilátero Ferrífero District. In this region, the topaz mineralizations occur essentially in the Northeastern area of the Dom Bosco Syncline and in the Northeastern flank of the Mariana Anticline (Dorr II 1969, Gandini 1994, Morteani
et al.2002, Rojas 2008, Rojas et al. 2009, Gauzzi et al.2018). The Dom Bosco mine is geologically related to the Northeastern area of the Dom Bosco Syncline hinge zone and is associated with the Brasiliano tectonothermal event that happened around 600 Ma (Dorr II 1969, Morteani et al. 2002). The topaz-bearing veins essentially crosscut the altered
phyllites of the Piracicaba Group rocks and the dolomitic marbles of the Gandarela Formation rocks. Because they have a syncline structure, the topaz-bearing veins crosscut the Quadrilátero Ferrífero District rocks according to the following inverse lithological sequence: Sabará and Piracicaba Groups, and the Gandarela Formation of the Itabira Group (Dorr II 1969).
The Antônio Pereira mine is geologically related to the Northeastern flank of the Mariana Anticline and is associ-ated with the Brasiliano tectonothermal event that happened around 600 Ma (Morteani et al.2002, Rojas 2008, Rojas
et al.2009). The topaz-bearing veins essentially crosscut the altered rocks of the Cauê and Gandarela Formations of the Itabira Group, and the Cercadinho Formation rocks of the Piracicaba Group. Because it has an anticline structure, the topaz-bearing veins crosscut the Quadrilátero Ferrífero District rocks according to the following normal litholog-ical sequence: Quebra Ossos, Nova Lima, Caraça, Itabira and Piracicaba Groups (Dorr II 1969).
Due to the tropical weathering, the imperial topaz-bear-ing veins originate from a halo of strongly altered rock in the crosscut rocks, which are intensively altered. This alteration originates from a brownish clay-like material, locally des-ignated by the miners as “borra de café” or coffee grounds (Olsen 1971). Due to this very intense alteration, there is no reliable information about the primary country rock related to the imperial topaz mineralization. Additionally, in both mines, the primary mineral assemblage related to the topaz-bearing veins is composed of kaolinite, quartz,
muscovite, rutile and, rarely, euclase (Gandini 1994, Morteani
et al.2002, Gauzzi et al.2018).
Toca da Onça Pegmatite (Minas Gerais, Brazil)
The Toca da Onça pegmatite is situated in the Northeastern area of the state of Minas Gerais, and is geologically related to the Eastern Brazilian Pegmatite Province. This pegma-tite body belongs to the Coronel Murta-Virgem da Lapa Pegmatite Field in the Pegmatite District of Araçuaí. The Toca da Onça pegmatite is intruded in the micaschists of the Salinas Formation (Pedrosa-Soares et al.1990, Morteani
et al.2000, Pedrosa-Soares et al.2011). The micaschists of the Salinas Formation are banded and are a primary mineral assemblage composed of predominant biotite, muscovite and plagioclase (albite). Their accessory mineral assemblage is composed of garnet, sillimanite and kyanite (Lima et al. 2002). Finally, the Toca da Onça pegmatite body is essen-tially zoned and complex and its primary mineral assem-blage is composed of K-feldspar, quartz and muscovite. The accessory mineral assemblage is composed of tourmaline, cleavelandite, lepidolite, topaz, apatite, columbite-tantalite, amblygonite, spodumene and morganite (Correia-Neves
et al.1980, Pinho-Tavares 2004).
Ponto de Marambaia
Pegmatite (Minas Gerais, Brazil)
The Ponto de Marambaia pegmatite is situated in the Northeastern area of the state of Minas Gerais, and is geo-logically related to the Eastern Brazilian Pegmatite Province. This pegmatite belongs to the Padre Paraíso Pegmatite Field in the Pegmatite District of Padre Paraíso. The Ponto de Marambaia pegmatite is specifically intruded in the Caladão granite, which is a porphyritic biotite granitoid, classified as a type-I granite that is metaluminous and K-rich. Its primary mineral assemblage is composed of K-feldspar, quartz, pla-gioclase, biotite and hornblende. Its accessory mineral assem-blage is composed of zircon, apatite, allanite, carbonate, mus-covite, chlorite, magnetite, rutile and ilmenite (Ferreira et al. 2005). Intruded in the Caladão granite is the Padre Paraíso charnockite, which is a porphyritic biotite granitoid that has a greenish color. Its primary mineral assemblage is composed of K-feldspar, plagioclase, biotite, hornblende and hyperstene. Its accessory mineral assemblage is composed of zircon, apa-tite, epidote, titanite, carbonate, muscovite, chlorite and mag-netite (Ferreira et al.2005). Finally, the Ponto de Marambaia pegmatite body can be zoned or homogeneous, an its primary mineral assemblage is composed of K-feldspar, quartz, bio-tite, muscovite, beryl (gem-varieties aquamarine, heliodor and goshenite), topaz, schörl and magnetite. The accessory mineral assemblage is composed of sericite, kaolinite, topaz, goethite and Mn-oxides (Ferreira et al.2005).
Thomas Range mine (Utah, United States)
The Thomas Range topaz occurrences are situated in the West-Central part of the state of Utah, and are emplaced in a Cenozoic extensive fault zone, and have ages varying between 0.06–50.00 Ma (Christiansen et al. 1986, 2007). Topaz crys-tals from the Thomas Range occur in topaz rhyolites, as groups of coalesced lava domes and flows with interlayered tephra deposits, whose ages vary between 6.00–7.00 Ma and whose volume is 50 km3 (Christiansen et al.1986, Duffield
& Dalrymple 1990). The topaz rhyolites from the Thomas Range mainly show an aphyric texture and are composed 20% by phenocrysts (Lindsey 1982). Their primary mineral assemblage is composed of quartz, plagioclase, K-feldspar, Fe-Ti oxides, biotite, Fe-hornblende, Fe-augite, garnet, and their accessory mineral assemblage is composed of fluorite, pseudobrookite, bixbyite, magnetite, hematite, cassiterite, topaz, ilmenite, zircon, F-titanite, allanite and apatite (Burt
et al. 1982, Christiansen et al.1986, 2007).
Ghundao Hill mine (Mardan, Pakistan)
The Ghundao Hill topaz mines are situated close to the small town of Katlang (District of Mardan, Pakistan). According to Jan (1979), the topaz-bearing veins were geo-logically related to the Lower Swat Buner Schistose Group, namely to the unit of Marbles and Calcareous Schists, which was classified by Martin et al. (1962). However, after the studies carried out by DiPietro et al. (1993), the men-tioned group corresponds to the Alpurai Group, which is composes, along with others, the Kashala Formation. The topaz-bearing veins occur in the rocks of the Kashala Formation, which are essentially composed of a sequence of garnet- and/or epidote-bearing calcareous schist that grade into schistose marble and into a coarse grey to brown calcite marble (DiPietro et al.1993). These veins cross-cut the schistosity of the aforementioned marbles and are mainly composed of coarse sparry calcite, whose colors can be white, grey and brownish, quartz and, rarely, laths of muscovite (Jan 1979, Morteani & Voropaev 2007). Finally, according to Morteani and Voropaev (2007), the topaz mineralization resulted from metamorphic fluids, which occurred during an Eocene Himalayan tectonother-mal event (43.20 ± 1.70 Ma).
MATERIALS AND METHODS
Samples preparation
a euhedral to subhedral prismatic habit, and had striae along the well-preserved lateral faces, which were parallel to the
c-axis and were free of inclusions (Tab. 1). All of these sam-ples were cut parallel to (001) and perpendicular to the
c-axis. After this procedure, the samples were mounted in an epoxy resin, and then polished using a 0.25 µm diamond powder until the topaz crystals were exposed. The samples were cleaned with HNO3 before the analysis in order to avoid contamination.
Analytical methods
Scan electron microscopy-cathodoluminescence (SEM-CL)
Panchromatic SEM-CL images were obtained using a JEOL JSM-6510 equipped with a CL detector, with a wave-length range of 200–800 nm, in the Microanalysis Laboratory of the Department of Geology at the Federal University of Ouro Preto (Brazil). The accelerating voltage was 20 kV.
Laser ablation inductively coupled plasma mass spectrometry (LA-ICP-MS)
Trace elements were analyzed by (LA-ICP-MS) using a Thermo-Finnigan Element II, a single collector sector field (SF) ICL1-MS, coupled with a CETAC UV Nd:YAG 213 nm laser with a Helix ablation cell in the Isotopic Geochemistry Laboratory (LOPAG) of the Department of Geology at the Universidade Federal de Ouro Preto (Brazil). The spot size was 40 µm. Helium combined with argon was a carrier gas and ablation was carried out with a pulse rate of 10 Hz and an energy density of 3.60 J/cm2.
The LA-ICP-MS analyses were punctually performed on the topaz crystals and 20 s of background acquisition was followed by 60 s of ablation. The software GLITTER 4.0 (Macquarie University) was used for data reduction with NIST SRM610 as a primary external standard and Si as the internal standard (using the average SiO2 content for
each sample). The secondary external standard was NIST SRM612. Limits of detection were about 0.91–3.57 ppm (Li), 222.58–276.19 ppm (Ca), 4.80–5.90 ppm (Ti), 0.04–0.08 ppm (V), 1.60–3.60 ppm (Cr), 0.20–0.40 ppm (Mn), 131.05–300.53 ppm (Fe), 0.06–0.12 ppm (Cu), 0.27–0.50 ppm (Zn), 0.02–0.08 ppm (Nb), 0.08–0.62 ppm (LREE), 0.03–0.12 ppm (HREE), 0.04–0.26 ppm (Ta), 0.07–0.13 ppm (W), and the external reproducibility of the results was 2 to 7%.
RESULTS AND DISCUSSION
Crystallization dynamics
In order to understand the crystallization dynamics of each sample, it was necessary to relate the textural data, obtained by SEM-CL, and the compositional data, obtained by LA-ICP-MS.
To understand the CL textures and their influence on the crystallization dynamics of the minerals according to their geological setting, studies on SEM-CL images, found in the literature, were essential (Boggs et al.2002, Van der Kerkhof et al.2004, Rusk et al.2008, Götte et al. 2011, Agangi et al.2014, Frelinger et al. 2015, Agangi et al.2016). As observed in Figure 2, samples DB, AP and TR show marked CL-heterogeneity, while samples GH, TO and PM show CL-homogeneity.
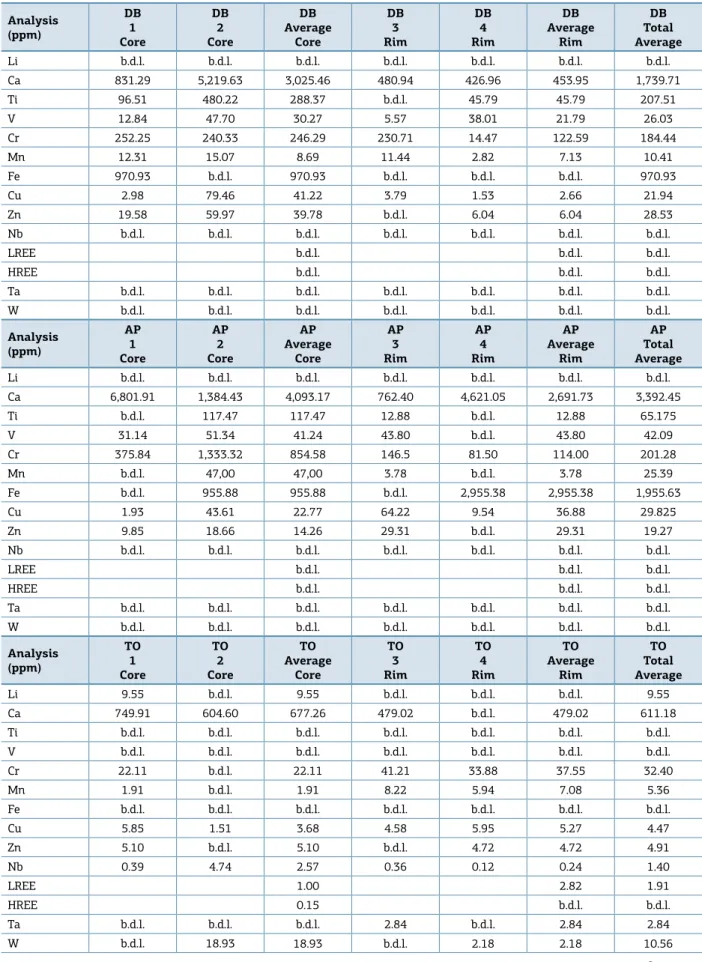
The role of Li, Ca, Ti, V, Cr, Mn, Fe, Cu, Zn, Nb, LREE, HREE, Ta and W in the core and rims of topaz crystals was crucial to distinguish the different geological settings (Tab. 2) and to understand their crystallization dynamics. Also, asso-ciating the concentrations of these elements with the CL
Provenance Color Dimensions
(width x height; mm) Dom Bosco (DB) Orange-pinkish 11.50 × 15.00
Antônio
Pereira (AP) Orangish 7.50 × 4.00
Toca da
Onça (TO) Colorless 9.00 × 12.50
Ponto de
Marambaia (PM) Colorless 14.00 × 12.00
Thomas
Range (TR) Brownish 7.00 × 9.50
Ghundao
Hill (GH) Pinkish 6.00 × 13.00
Table 1. Features of the samples used in this study.
Figure 2. SEM-CL panchromatic images of the
different topaz crystals: (1) central rhombic pattern
Table 2. Trace element concentrations obtained in the studied topaz crystals by LA-ICP-MS (in ppm).
Analysis (ppm)
DB 1 Core
DB 2 Core
DB Average
Core
DB 3 Rim
DB 4 Rim
DB Average
Rim
DB Total Average
Li b.d.l. b.d.l. b.d.l. b.d.l. b.d.l. b.d.l. b.d.l.
Ca 831.29 5,219.63 3,025.46 480.94 426.96 453.95 1,739.71
Ti 96.51 480.22 288.37 b.d.l. 45.79 45.79 207.51
V 12.84 47.70 30.27 5.57 38.01 21.79 26.03
Cr 252.25 240.33 246.29 230.71 14.47 122.59 184.44
Mn 12.31 15.07 8.69 11.44 2.82 7.13 10.41
Fe 970.93 b.d.l. 970.93 b.d.l. b.d.l. b.d.l. 970.93
Cu 2.98 79.46 41.22 3.79 1.53 2.66 21.94
Zn 19.58 59.97 39.78 b.d.l. 6.04 6.04 28.53
Nb b.d.l. b.d.l. b.d.l. b.d.l. b.d.l. b.d.l. b.d.l.
LREE b.d.l. b.d.l. b.d.l.
HREE b.d.l. b.d.l. b.d.l.
Ta b.d.l. b.d.l. b.d.l. b.d.l. b.d.l. b.d.l. b.d.l.
W b.d.l. b.d.l. b.d.l. b.d.l. b.d.l. b.d.l. b.d.l.
Analysis (ppm)
AP 1 Core
AP 2 Core
AP Average
Core
AP 3 Rim
AP 4 Rim
AP Average
Rim
AP Total Average
Li b.d.l. b.d.l. b.d.l. b.d.l. b.d.l. b.d.l. b.d.l.
Ca 6,801.91 1,384.43 4,093.17 762.40 4,621.05 2,691.73 3,392.45
Ti b.d.l. 117.47 117.47 12.88 b.d.l. 12.88 65.175
V 31.14 51.34 41.24 43.80 b.d.l. 43.80 42.09
Cr 375.84 1,333.32 854.58 146.5 81.50 114.00 201.28
Mn b.d.l. 47,00 47,00 3.78 b.d.l. 3.78 25.39
Fe b.d.l. 955.88 955.88 b.d.l. 2,955.38 2,955.38 1,955.63
Cu 1.93 43.61 22.77 64.22 9.54 36.88 29.825
Zn 9.85 18.66 14.26 29.31 b.d.l. 29.31 19.27
Nb b.d.l. b.d.l. b.d.l. b.d.l. b.d.l. b.d.l. b.d.l.
LREE b.d.l. b.d.l. b.d.l.
HREE b.d.l. b.d.l. b.d.l.
Ta b.d.l. b.d.l. b.d.l. b.d.l. b.d.l. b.d.l. b.d.l.
W b.d.l. b.d.l. b.d.l. b.d.l. b.d.l. b.d.l. b.d.l.
Analysis (ppm)
TO 1 Core
TO 2 Core
TO Average
Core
TO 3 Rim
TO 4 Rim
TO Average
Rim
TO Total Average
Li 9.55 b.d.l. 9.55 b.d.l. b.d.l. b.d.l. 9.55
Ca 749.91 604.60 677.26 479.02 b.d.l. 479.02 611.18
Ti b.d.l. b.d.l. b.d.l. b.d.l. b.d.l. b.d.l. b.d.l.
V b.d.l. b.d.l. b.d.l. b.d.l. b.d.l. b.d.l. b.d.l.
Cr 22.11 b.d.l. 22.11 41.21 33.88 37.55 32.40
Mn 1.91 b.d.l. 1.91 8.22 5.94 7.08 5.36
Fe b.d.l. b.d.l. b.d.l. b.d.l. b.d.l. b.d.l. b.d.l.
Cu 5.85 1.51 3.68 4.58 5.95 5.27 4.47
Zn 5.10 b.d.l. 5.10 b.d.l. 4.72 4.72 4.91
Nb 0.39 4.74 2.57 0.36 0.12 0.24 1.40
LREE 1.00 2.82 1.91
HREE 0.15 b.d.l. b.d.l.
Ta b.d.l. b.d.l. b.d.l. 2.84 b.d.l. 2.84 2.84
W b.d.l. 18.93 18.93 b.d.l. 2.18 2.18 10.56
Analysis (ppm)
PM 1 Core
PM 2 Core
PM Average
Core
PM 3 Rim
PM 4 Rim
PM Average
Rim
PM Total Average
Li b.d.l. b.d.l. b.d.l. b.d.l. b.d.l. b.d.l. b.d.l.
Ca 449.08 b.d.l. 449.08 912.4 b.d.l. 912.4 680.74
Ti 48.33 b.d.l. 48.33 20.49 78.26 49.38 49.03
V b.d.l. b.d.l. b.d.l. b.d.l. b.d.l. b.d.l. b.d.l.
Cr 16.51 b.d.l. 16.51 20.28 48.24 34.26 28.34
Mn 2.99 b.d.l. 2.99 b.d.l. b.d.l. b.d.l. 2.99
Fe b.d.l. b.d.l. b.d.l. b.d.l. b.d.l. b.d.l. b.d.l.
Cu 3.08 b.d.l. 3.08 3.8 b.d.l. 3.8 3.44
Zn 3.33 b.d.l. 3.33 b.d.l. b.d.l. b.d.l. 3.33
Nb b.d.l. 3.04 3.04 b.d.l. b.d.l. b.d.l. 3.04
LREE b.d.l. b.d.l. b.d.l.
HREE 1.14 1.42 1.28
Ta b.d.l. 0.48 0.48 b.d.l. b.d.l. b.d.l. 0.48
W 0.49 1.01 0.75 b.d.l. b.d.l. b.d.l. 0.75
Analysis (ppm)
TR 1 Core
TR 2 Core
TR Average
Core
TR 3 Rim
TR 4 Rim
TR Average
Rim
TR Total Average
Li 23.95 b.d.l. 23.95 b.d.l. 13.61 13.61 18.78
Ca b.d.l. 295.03 295.03 479.00 b.d.l. 479,00 387.02
Ti 46.17 b.d.l. b.d.l. 11.39 57.00 34.20 38.19
V b.d.l. 22.76 22.76 b.d.l. b.d.l. b.d.l. 22.76
Cr 8.95 5.50 7.23 41.21 b.d.l. 41.21 18.55
Mn b.d.l. b.d.l. b.d.l. 8.22 b.d.l. 8.22 8.22
Fe b.d.l. b.d.l. b.d.l. b.d.l. b.d.l. b.d.l. b.d.l.
Cu 1.12 2.68 1.90 4.98 b.d.l. 4.98 2.93
Zn 4.34 4.69 4.52 b.d.l. 6.38 6.38 5.14
Nb 77.10 7.47 42.29 0.36 2.79 1.58 21.93
LREE 2.05 b.d.l. 2.05
HREE b.d.l. b.d.l. b.d.l.
Ta 15.51 6.45 10.98 b.d.l. 9.19 9.19 10.38
W 29.99 2.60 16.30 0.18 58.31 29.25 22.77
Analysis (ppm)
GH 1 Core
GH 2 Core
GH Average
Core
GH 3 Rim
GH 4 Rim
GH Average
Rim
GH Total Average
Li b.d.l. b.d.l. b.d.l. b.d.l. b.d.l. b.d.l. b.d.l.
Ca 697.80 b.d.l. 697.8 1,192.85 b.d.l. 1,192.85 945.33
Ti b.d.l. 2.39 b.d.l. b.d.l. b.d.l. b.d.l. 2.39
V 26.81 b.d.l. 26.81 4.62 82.23 43.43 37.89
Cr 61.58 336.58 199.08 80.80 171.46 126.13 162.61
Mn b.d.l. b.d.l. b.d.l. b.d.l. b.d.l. b.d.l. b.d.l.
Fe b.d.l. b.d.l. b.d.l. b.d.l. b.d.l. b.d.l. b.d.l.
Cu 2.56 7.56 5.06 3.65 8.60 6.13 5.59
Zn b.d.l. 7.41 7.41 8.01 15.37 11.69 10.26
Nb b.d.l. b.d.l. b.d.l. b.d.l. b.d.l. b.d.l. b.d.l.
LREE 1.68 3.10 2.39
HREE b.d.l. 3.16 3.16
Ta b.d.l. b.d.l. b.d.l. b.d.l. b.d.l. b.d.l. b.d.l.
W b.d.l. b.d.l. b.d.l. 2.10 2.30 2.20 2.20
images shows how they are incorporated and whether or not they play a role as hypothetical CL-activators.
In sample DB, SEM-CL images show a central rhombic pattern, which develops along [110], in its core. In the api-ces of this central rhombic pattern, especially along [010], there is a common tendency to form a triangular area of very strong luminescence (see Fig. 2, DB). This CL-heterogeneity demonstrates that this area was marked by multiple pre-cipitation-dissolution textures, which are representative of physicochemical changes within the hydrothermal system. In the rims, it is possible to observe very dark and incipi-ent luminescence areas, which are truncated by some irreg-ular-shaped areas. These textures can be related to meta-morphic activity, shown by lower CL along the rims of the grain, which can imply recrystallization and removal of impurities, thus generating a homogeneous CL response. In addition, all these crystallization features, showed by the CL-panchromatic images, lead one to infer that a primary process of crystallization took place followed by recrystalli-zation process (Gauzzi et al.2018). The sample AP, besides being just part of a rhombic pattern and showing less lumi-nescence, displays the same luminescence features of the sample DB (see Fig. 2, AP).
According to Morteani et al.(2002) and Morteani and Voropaev (2007), the crystallization dynamics of samples
DB and AP could be related to the metamorphic tectono-thermal event that occurred during the Brasiliano orogeny in the region of Ouro Preto in about 600 Ma. In comparison with the study carried out by Gauzzi et al.(2018) on impe-rial topaz crystals related to the Dom Bosco mine, the same CL behavior was observed as in the samples of our study (Figs. 3A and 3B). According to the chemical composition data, in both samples, the high Ca, Ti, Cr and Mn concen-trations are observable in the cores (see Tabs. 2 and 3, and Figs. 3C, 3D and 3E). However, V, Fe, Cu and Zn concen-trations are higher in the core than in the rims, namely in sample DB (Fig. 3D), which is corroborated by the results obtained by Gauzzi et al. (2018) and in Table 3. Meanwhile, the opposite can be observed in sample AP (Fig. 3E).
Considering that crystallization dynamics can be related to primary crystallization and recrystallization processes in imperial topaz, which is corroborated by the SEM-CL images and by Gauzzi et al.(2018), the incorporation of Ca, Ti, Cr and Mn may have been very intense during the first stages of crystallization in both samples. On the other hand, the incorporation of V, Fe, Cu and Zn allows for both samples to be distinguished from one another. In the sample DB, these elements were intensively aggregated to its crystal structure during the first stages of crystallization, while the opposite occurred in sample AP. Also, the timing of incorporation
Figure 3. A combination of the SEM-CL image and the chemical composition in samples DB and AP: (A) and (B) SEM-CL images with the LA-ICP-MS spots in samples DB and AP, respectively; (C) the relation between the Cu and Zn concentrations and the CL-intensities observed in (A) and (B); (D) and (E) concentrations of Ca, Ti, V, Cr, Mn, Fe, Cu and Zn (in ppm) in the core and in the rims of both samples, respectively.
D
E B
A
Table 3. A comparison between the trace element composition of topaz crystals from our study (i.e. DB) and from
different geological environments found in the literature (average values in ppm).
Geological setting
Ca (average; ppm) Ti (average) V (average) Cr (average) Mn (average)
Core Rim Core Rim Core Rim Core Rim Core Rim
Agangi et al.
(2014, 2016) Ongonite 588.50 1,293.05 18.32 30.22 0.27 1.47 b.d.l. b.d.l. 7.68 24.10
Gauzzi et al. (2018)
Hydrotherrmal
veins n.a. n.a. 215.74 161.92 28.71 23.70 319.42 300.87 5.09 3.65
Our study
DB Hydrotherrmal
veins 3,025.46 453.95 288.37 45.79 30.27 21.79 246.29 12.59 8.69 2.13
AP Hydrotherrmal
veins 4,093.17 2,691.73 117.47 12.88 41.24 40.80 854.58 114.00 47.00 3.78
TO Pegmatite 677.26 479.02 b.d.l. b.d.l. b.d.l. b.d.l. 22.11 37.55 1.91 7.08
PM Pegmatite 449.08 912.40 48.33 49.38 b.d.l. b.d.l. 16.51 34.26 2.99 b.d.l.
TR Rhyolite 295.03 479.00 43.75 34.20 22.76 b.d.l. 7.23 41.21 b.d.l. 8.22
GH
Hydrothermal veins (metamorphism)
697.80 1,192.85 b.d.l. b.d.l. 26.81 43.43 199.08 126.13 b.d.l. b.d.l.
Geological setting
Fe (average; ppm) Cu (average) Zn (average) Nb (average) LREE (average)
Core Rim Core Rim Core Rim Core Rim Core Rim
Agangi et al.
(2014, 2016) Ongonite 60.64 132.97 2.00 10.84 1.90 13.98 1.36 20.14 0.50 2.63
Gauzzi et al. (2018)
Hydrotherrmal
veins 799.07 691.73 13.73 10.35 19.75 11.33 n.a. n.a. n.a. n.a.
Our study
DB Hydrotherrmal
veins 970.93 b.d.l. 41.22 2.66 24.78 6.04 b.d.l. b.d.l. b.d.l. b.d.l.
AP Hydrotherrmal
veins 955.88 2,955.38 22.77 36.88 14.26 29.31 b.d.l. b.d.l. b.d.l. b.d.l.
TO Pegmatite b.d.l. b.d.l. 3.68 5.27 5.10 4.72 2.57 0.24 1.00 2.82
PM Pegmatite b.d.l. b.d.l. 3.08 3.80 3.33 b.d.l. 3.04 b.d.l. b.d.l. b.d.l.
TR Rhyolite b.d.l. b.d.l. 1.90 4.98 4.52 6.38 42.29 1.58 2.05 b.d.l.
GH
Hydrothermal veins (metamorphism)
b.d.l. b.d.l. 5.06 6.13 7.41 11.69 b.d.l. b.d.l. 1.68 2.39
Geological setting
HREE (average; ppm)
Ta (average)
W (average)
Core Rim Core Rim Core Rim
Agangi et al.
(2014. 2016) Ongonite 0.03 0.74 0.64 3.73 1.69 18.42
Gauzzi et al. (2018) Hydrotherrmal veins n.a. n.a. n.a. n.a. n.a. n.a.
Our study
DB Hydrotherrmal veins b.d.l. b.d.l. b.d.l. b.d.l. b.d.l. b.d.l.
AP Hydrotherrmal veins b.d.l. b.d.l. b.d.l. b.d.l. b.d.l. b.d.l.
TO Pegmatite 0.15 b.d.l. b.d.l. 2.84 18.93 2.18
PM Pegmatite 1.14 1.42 0.48 b.d.l. 0.75 b.d.l.
TR Rhyolite b.d.l. b.d.l. 5.98 9.19 16.30 29.25
GH Hydrothermal veins
(metamorphism) b.d.l. 3.16 b.d.l. b.d.l. b.d.l. 2.20
of the trace elements can be observed in the CL intensity. In agreement with Gauzzi et al.(2018), Cu and Zn could be considered important CL-activators in imperial topaz from the Ouro Preto region and, thus, Figures 3A, 3B and 3C show that high concentrations of these elements are related to high-CL areas. In this case, because the incorporation of these elements has been much more significant in the first stages of crystallization of sample DB, due to their high con-centrations in the core (Fig. 3D), the CL intensity is much more marked and evident (Fig. 3A). Notwithstanding, in sample AP, Cu and Zn must have been incorporated in its last stages of crystallization, due to their high concentrations in the rims (Fig. 3E), and thus the CL intensity is more dis-crete (Fig. 3B) than the one observed in sample DB.
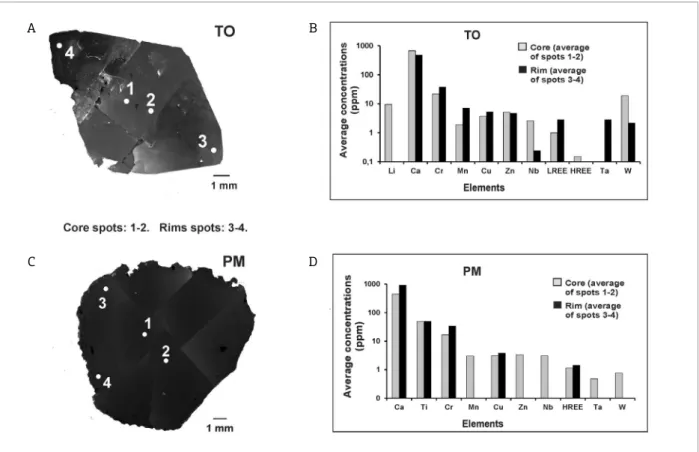
Both samples TO and PM show low luminescence areas and are predominantly dark and completely homogeneous (Fig. 2, TO and PM). In both samples, no difference was noticed between the core and the rim in terms of lumines-cence. This can imply a slow and late crystallization, typ-ical of late-stage minerals that crystallize in pegmatites. Moreover, this homogeneity allows for the reduction of structural defects, the removal of impurities of the crystal structure, and a homogeneous CL response to be observed.
In agreement with the chemical composition data, in sample TO, higher Ca, Zn, Nb, HREE and W concen-trations are more observable in the core than in the rims (Tabs. 2 and 3, and Figs. 4A and 4B). However, the opposite can be observed with elements such as Cr, Mn, Cu, LREE and Ta. On the other hand, in sample PM, higher Mn, Zn, Nb, Ta and W concentrations are more evident in the core than in the rims, while the opposite can be noticed with elements such as Ca, Ti, Cr, Cu and HREE (Tabs. 2 and 3, and Figs. 4C and 4D).
The crystallization dynamics can be very similar in these samples due to the slow crystallization processes, and the dark and homogeneous images obtained by SEM-CL. Nonetheless, the chemical composition is a very relevant dis-tinguishing aspect. The incorporation of Li, Zn, Nb, HREE and W may have been very intense during the first stages of crystallization in sample TO, while elements such as Cr, Mn, Cu, LREE and Ta were aggregated to its crystal struc-ture during the final stages (Fig. 4B). On the other hand, in sample PM, elements such as Mn, Zn, Nb, Ta and W may have been strongly incorporated during its first stages of crystallization, while Ca, Ti, Cr, Cu and HREE were more likely to enter its crystal structure during the final
Figure 4. A combination of the SEM-CL image and the chemical composition in samples TO and PM: (A) and (C) SEM-CL images with the LA-ICP-MS spots; concentrations of (B) Li, Ca, Cr, Mn, Cu, Zn, Nb, LREE, HREE, Ta and W, and of (D) Ca, Ti, Cr, Mn, Cu, Zn, Nb, HREE, Ta and W (both in ppm) in the core and in the rims.
B A
stages (Fig. 4D). Moreover, as both samples show dark and homogeneous CL intensities (Figs. 4A and 4C), no rela-tion between the concentrarela-tions of these trace elements and CL-activation has been found.
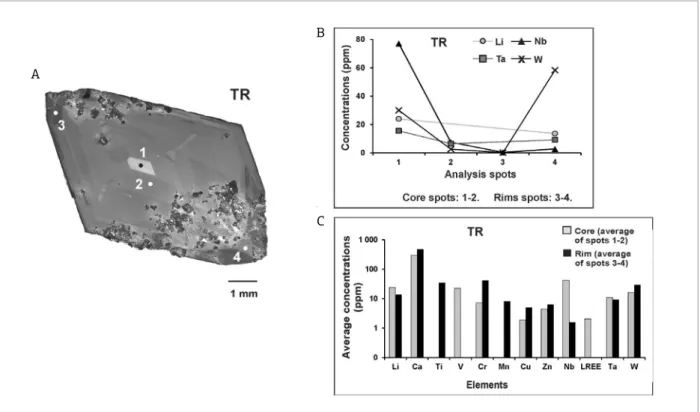
Sample TR displays high CL intensities. In its core, it is possible to observe a growth sector boundary, specifically a very high luminescence central rhombic pattern develop-ing along [110]. In the rims, it is possible to observe some straight growth zones with oscillating, but discrete, CL inten-sities, which are aligned with [110] (Fig. 2, TR). In mag-matic topaz, it is possible to observe well-preserved growth zones of oscillating CL intensities that can be truncated by high luminescence irregular areas. This can be explained by the periods of crystal growth, resorption and the subsequent growth again of late-stage topaz in rhyolitic magmas of the Thomas Range (Christiansen et al. 1986, 2007). Sample TR can be compared to the ongonite topaz samples, studied by Agangi et al.(2014, 2016), due to the fact that it is a magmatic topaz (ongonite from Ary-Bulak Massif, Russia). The SEM-CL image of sample TR shows very high lumines-cence in the core and well-defined growth zones according to [110]. Also, the weak luminescence areas show a marked grey that is not dark. As observed in the studies carried out by Agangi et al.(2014, 2016), truncated irregular areas are observable. However, while the topaz samples of the latter
studies show CL-variations that define euhedral to lobed growth textures, the sample TR only shows euhedral and growth textures.
In sample TR, the chemical composition data allow for higher Li, V, Nb, LREE and Ta concentrations to be observed in the core than in the rims, while the opposite can be noticed with elements such as Ca, Ti, Cr, Mn, Cu, Zn and W (Tabs. 2 and 3, and Figs. 5A, 5B and 5C).
In agreement with Figure 5C and Agangi et al.(2014, 2016), the crystallization dynamics may have been marked by a strong incorporation of Li, V, Nb, LREE and Ta during its first stages of crystallization. Meanwhile, Ca, Ti, Cr, Mn, Cu, Zn and W were aggregated to its crystal structure during the final stages (Fig. 5C). In agreement with Agangi et al. (2014, 2016), Li, Nb, Ta and W could be considered import-ant CL-activators in magmatic topaz and, thus, Figures 5A and 5B show that high concentrations of these elements are related to high intensity CL areas. Moreover, because of the high concentrations of these CL-activator elements, above tens of ppm (Fig. 5C), the SEM-CL image shows high CL intensity and an absence of dark areas.
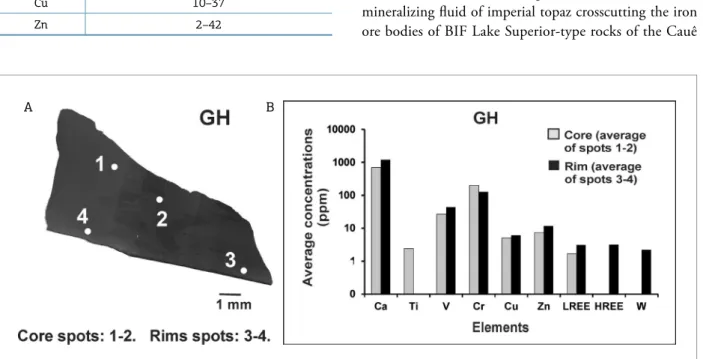
Sample GH shows weak and dull luminescence areas, and homogeneous CL response (Fig. 2, GH). This is related to metamorphism, especially to recrystallization, which increases the crystal structure order, reducing the structural
Figure 5. A combination of the SEM-CL image and the chemical composition in sample TR: (A) a SEM-CL image with the LA-ICP-MS spots; (B) the relation between the Li, Nb, Ta and W concentrations and the CL-intensities observed in (A); (C) concentrations of Li, Ca, Ti, V, Cr, Mn, Cu, Zn, Nb, LREE, Ta and W (in ppm) in the core and in the rims.
B
defects in the crystal and removing the impurities from the crystal structure. Also, according to Morteani and Voropaev (2007), topaz crystallization is related to the metamorphic fluids that originated from the Eocene Himalayan tectono-thermal event (43.20 ± 1.70 Ma).
The chemical composition data, in sample GH, show higher Ti and Cr concentrations in the core than in the rims, while the opposite can be observed with elements such as Ca, V, Cu, Zn, LREE, HREE and W (Tabs. 2 and 4, and Figs. 6A and 6B).
According to Figure 6B, the crystallization dynamics may have been marked by an intense incorporation of Ti and Cr during the first stages of crystallization, while ele-ments such as Ca, V, Cu, Zn, LREE, HREE and W were aggregated to its crystal structure during the final stages. Furthermore, this sample shows weak and homogeneous CL intensity (Fig. 6A), and the relation between element concentrations and CL-activation is the same as in sam-ples TO and PM.
Elements BIF Lake Superior-type (ppm)
Ti 160–1,900
V 30–124
Cr 102–122
Mn 3,400–4,600
Cu 10–37
Zn 2–42
Table 4. Concentrations of Ti, V, Cr, Mn, Cu and Zn as trace elements in the BIF Lake Superior-type of the Quadrilátero Ferrífero District (Selmi et al.2009,
Adekoya et al. 2012).
The influence of primary and accessory
mineral assemblages in the fingerprint
of the studied topaz crystals
The Li, V, Cr, Mn, Cu, Zn, Nb, LREE, HREE, Ta and W concentrations can occur as part of the chemical formula, or as relevant trace elements of the minerals that constitute the primary and/or accessory mineral assemblages of the rocks in which the studied topaz crystals occurred. Ti concentra-tions can be related to primary/accessory mineral assemblages (e.g. rutile). The Ca and Fe concentrations can be associated with the enrichment of these elements in some of the lithol-ogies (e.g. Fe in BIF). Moreover, the concentrations and the combinations of these elements are essential to characterize the fingerprint of each topaz crystal of this study.
The chemical composition data show that in sample DB, high Ca concentrations should have resulted from the topaz mineralizing fluid crosscutting the following sequences: dolomitic marbles, dolomitic phyllites and dolomitic itabir-ites of the Gandarela Formation in addition to carbon-ate-bearing phyllites and dolomitic marbles of the Piracicaba Group. And in sample AP, the following sequences: carbon-ate-bearing phyllites and dolomitic marbles of the Piracicaba Group in addition to dolomitic marbles, dolomitic phyl-lites, and dolomitic itabirites of the Gandarela Formation. Furthermore, Ca abundance in the mineralizing fluids can be explained, not only by the carbonate host rocks, but also, according to Gandini (1994), by the presence of dolomite as a mineral assemblage and the presence of calcite crystals as mineral microinclusions. The high Ti, V, Cr, Mn, Fe, Cu and Zn concentrations in sample AP, can be related to the mineralizing fluid of imperial topaz crosscutting the iron ore bodies of BIF Lake Superior-type rocks of the Cauê
Figure 6. A combination of the SEM-CL image and the chemical composition in sample GH: (A) a SEM-CL image with the LA-ICP-MS spots; (B) concentrations of Ca, Ti, V, Cr, Cu, Zn, LREE, HREE and W (in ppm) in the core and in the rims.
Formation (sample AP). On the other hand, the concentra-tions of these elements in sample DB can be related to the dolomitic itabirites, which are Fe-rich (FeO concentrations of up to 42.50 wt.%; Spier et al.2003), of the Gandarela Formation. In both cases, the percolation and capture of Fe by the mineralizing fluid explains how the topaz originated. In the case of Ti, this enrichment can be related to these iron ores that originate from sediments, which, according to Correns (1978), are Ti-rich. Cr tends to accumulate in the sedimentary Fe- and Al-rich rocks (Shiraki 1978), and has a high affinity with Fe-oxides (Yu et al.2001). Mn, accord-ing to Baioumy et al.(2013), has a strong chemical affin-ity with iron ore deposits, especially in this case with the occurrence of Mn-oxides in these iron deposits (Gandini 1994). Also, the fluid should be Fe-, Cr-, Mn- and Ti-rich, not only because of the crosscutting of the aforementioned BIF rocks and the capturing of their respective Fe and Ti, but also because of the Mn-oxide, hematite, and rutile crystals existent in the main mineral assemblage. The Cr enrichment can be related to the Fe-oxides, specifically hematite and magnetite, and to the already mentioned affinity between Cr and Fe, due to the fact that there is no Cr-bearing min-eral in the main minmin-eral assemblage. High V, Cu and Zn concentrations can be related to their presence as trace ele-ments in banded iron formations, which could have been captured during imperial topaz crystallization. In the case of BIF Lake Superior-type rocks, the Ti, V, Cr, Mn, Cu and Zn concentrations range widely (Tab. 4). The concentra-tions of Ca, V, Cr, Mn, Fe, Cu and Zn are higher in sam-ple AP than in samsam-ple DB (Tab. 2 and Fig. 7). Due to the
influence of the mineral assemblages (e.g. rutile) and the rocks of the surrounding geological setting (e.g. carbonate rocks), the fingerprint of both samples is characterized by Ca, Ti, V, Cr, Mn, Cu and Zn (Fig. 7).
In sample TO, Cr, Cu, Zn and HREE mainly occur as relevant trace elements in the minerals of the primary and accessory mineral assemblages, such as biotite, garnet, pyroxene and amphibole (Herrmann 1978, Shiraki 1978, Wedepohl 1978a, 1978d) in the Salinas Formation rocks. The high Ca concentrations can be related to apatite, plagioclase and titanite, which are part of the primary and accessory min-eral assemblages of the Salinas Formation rocks. The high Li concentrations are related to the lepidolite, amblygonite and spodumene, which are part of the accessory mineral assem-blage of this pegmatite. The relatively low Mn, Nb and Ta concentrations can be related to the main incorporation of these elements into crystallize columbite-tantalite (Wedepohl 1978b, 1978c, Heinrich 1978). The LREE concentrations can be associated with the crystallization of allanite. Also, the Mn concentrations are relevant enough to act as a chromophore element of morganite. The W concentrations, according to Krauskopf (1978), are associated with the Nb-Ta-bearing minerals such as columbite-tantalite, whose W concentra-tions can reach up to 1.00 wt.%, due also to the substitution of W6+ for Nb5+ and Ta5+. Also, the W concentrations can be
associated with the muscovite. According to the influence of the mineral assemblages (e.g. columbite-tantalite) and to the rocks of the surrounding geological setting (e.g. pegma-tites), the fingerprint of this sample is characterized by Li, Nb, LREE, Ta and W (see Fig. 7).
In sample PM, the Ti and Cr concentrations could be related to the Fe-oxides, especially the goethite. The Mn concentrations could be related to the Mn-oxides. Both Fe- and Mn-oxides occur as part of the accessory mineral assemblage of this pegmatite. The Ti concentrations could also be related to the rutile and ilmenite, which occur as part of the accessory mineral assemblage of the Caladão Granite, and to the titanite, which occurs as part of the accessory mineral assemblage of the Padre Paraíso Chernockite. Ca, Cu, Zn, Nb, HREE, Ta and W mainly occur as relevant trace elements in the minerals of the following primary and accessory mineral assemblages of the Caladão Granite. Ca concentrations are related to apatite, allanite and epidote. Cu and HREE are related to biotite, hornblende, hyperstene and plagioclase (Herrmann 1978, Wedepohl 1978a). Zn is related to magnetite and muscovite (Wedepohl 1978d). Nb is related to hyperstene and titanite (Heinrich 1978). W is related to muscovite (Krauskopf 1978). The mineral assemblages (e.g. titanite) and the rocks of the surrounding geological setting (e.g. pegmatites) were very relevant for the fingerprint of this sample, characterized by Ti, Nb and HREE (Fig. 7).
In sample TR, the low Ca and high Li concentrations could be related to the low CaO (below 0.80 wt.%; Christiansen
et al.1984, 1986) and to the Li concentrations (between 37.00–60.00 ppm) in the rhyolites from the Thomas Range. Part of this Ca should have been incorporated in the crystal-lization of Ca-bearing minerals such as apatite, fluorite and F-titanite, which are among the accessory mineral assem-blage of these rhyolitic rocks. Ti, Cr and Mn concentrations can be related to TiO2 (average 0.10 wt.%), MnO (average 0.06 wt.%) and Cr (average 2.00 ppm) concentrations in the rhyolites from the Thomas Range (Christiansen et al. 1986). Part of this Ti and Mn should have been used in the crystallization of the primary (Fe-oxides) and accessory (ilmenite and F-titanite) mineral assemblage that occurs with topaz in the rhyolitic rocks of the Thomas Range. The rela-tively high Ti concentrations could be related to Ti-bearing minerals such as ilmenite, Fe-Ti oxides, pseudobrookite and F-titanite, which are Ti-bearing minerals. Cr and Mn have a high affinity with Fe-oxides (Yu et al.2001), such as hematite and magnetite, and with the minerals of the primary mineral assemblage such as Fe-augite and Fe-hornblende. V, Cu, Zn, and W mainly occur as relevant trace elements in the miner-als of the primary and accessory mineral assemblages such as apatite, biotite, F-titanite, Fe-augite, Fe-hornblende, Fe-Ti oxides and ilmenite (Landergren 1978, Wedepohl 1978a, 1978d, Krauskopf 1978). Concentrations of Nb (between 53.00–64.00 ppm), LREE (between 7.50–73.00 ppm) and Ta (between 2.30–6.40 ppm) could be related to Nb, LREE and Ta concentrations in the rhyolites from the Thomas
Range. The LREE concentrations could be associated with the main incorporation of these elements to crystallize allanite (Christiansen et al.1984, 1986). The mineral assemblages (e.g. ilmenite) and the surrounding rhyolitic rocks influenced the fingerprint of this sample, which is characterized by Li, Ti, V, Mn, Nb, LREE, Ta and W (Fig. 7).
In sample GH, the high Ca concentrations are also directly related to the topaz mineralizing fluid that cross-cuts the following carbonate rocks: calcareous schists, schis-tose marbles, calcite marbles, and dolomitic marbles of the Kashala Formation. The Zn and W concentrations, accord-ing to Wedepohl (1978d) and Krauskopf (1978), can be associated with the muscovite that occurs in the topaz-bear-ing veins, as part of their mineral assemblage with quartz and topaz crystals. Elements such as V, Cr, Cu, LREE and HREE mainly occur as relevant trace elements in the min-erals of the primary mineral assemblages of the rocks of the Kashala Formation such as garnet, ilmenite, muscovite and plagioclase (Herrmann 1978, Landergren 1978, Shiraki 1978, Wedepohl 1978a). In accordance with the influence of the mineral assemblages (e.g. muscovite) and of the surround-ing carbonate rocks, the fsurround-ingerprint of this sample is char-acterized by Ca, Cr, V, Zn, LREE, HREE and W (Fig. 7).
CONCLUSIONS
Samples DB and AP allow for primary crystallization and recrystallization processes to be observed. They are probably associated with the metamorphic tectonother-mal event that occurred during the Brasiliano orogeny, about 600 Ma. This is suggested by the SEM-CL images, in which the cores are CL heterogeneous, and the rims are dark and homogeneous. In both cases, their crystallization dynamics may have been marked by an intense incorpora-tion of Ca, Ti, Cr and Mn during the first stages of crystal-lization. The aggregation of V, Fe, Cu and Zn in the crystal structure allows both samples to be distinguished. In sam-ple DB, this is evident in the first stages of crystallization, while the opposite is observable in sample AP. In both cases, Cu and Zn could play an important role as CL-activators. However the difference of timing and in intensity of how these elements are incorporated could distinctly highlight the brightness of CL intensities. The high CL central area is more evident in sample DB than AP.
In sample TO, the first stages of crystallization may have been marked by an intense incorporation of Li, Zn, Nb, HREE and W. Nonetheless, Cr, Mn, Cu, LREE and Ta are strongly aggregated in the final stages. On the other hand, sample PM shows the first stages of crystallization marked by the incorporation of significant Mn, Zn, Nb, Ta and W. Nevertheless, in the final stages, Ca, Ti, Cr, Cu and HREE enter the crystal structure intensively. Even though both samples show dark and homogeneous CL intensities, no relation between the concentrations of these trace elements and CL-activation has been found.
The SEM-CL images of sample TR display well preserved growth zones of oscillating CL intensities, suggesting peri-ods of crystal growth, resorption, and subsequent growth of late-stage topaz in rhyolitic magmas. The crystallization dynamics of this sample may have been marked by a strong incorporation of Li, V, Nb, LREE and Ta during its first stages of crystallization. However, elements such as Ca, Ti, Cr, Mn, Cu, Zn and W have been aggregated to its crystal structure during the final stages. Li, Nb, Ta and W can be considered important CL-activators in magmatic topaz and thus their high concentrations allow for high CL intensity and a lack of dark areas to be observed in the SEM-CL image. Sample GH allows for a recrystallization process to be observed. It is probably related to the metamorphic activity that occurred during the Eocene Himalayan tectonothermal event (43.20 ± 1.70 Ma). This is suggested by the SEM-CL images, in which the topaz shows weak, dull and homoge-neous luminescence areas. The crystallization dynamics may have been marked by a strong incorporation of Ti and Cr during the first stages of crystallization, while elements such as Ca, V, Cu, Zn, LREE, HREE and W may have entered
its crystal structure during the final stages. Similar to sam-ples TO and PM, this sample shows weak and homogeneous CL intensity, which prevents making a relation between the trace element concentrations and CL-activation.
Finally, the fingerprint of each studied topaz crystal can be characterized by the combination of the following elements:
■ Ca, Ti, V, Cr, Mn, Cu and Zn, for samples DB and AP;
■ Li, Nb, LREE, Ta and W, for sample TO;
■ Ti, Nb and HREE, for sample PM;
■ Li, Ti, V, Mn, Nb, LREE, Ta and W, for sample TR;
■ Ca, Cr, V, Zn, LREE, HREE and W, for sample GH.
ACKNOWLEDGEMENTS
The authors thank Mr. Edmar Silva, Mr. André Silva, Mr. Hélio Bezerra and Mr. Marco António Silva (Ouro Preto, Brazil), and Mr. Khalid Khan (Peshawar, Pakistan) for providing sample material for our study. The authors thank Prof. Dr. Cristiano Lana and M.Sc. Ana Ramalho Alkmim (Federal University of Ouro Preto) for the ana-lytical assistance they provided on the LA-ICP-MS. This project acknowledges support from the Laboratório de Geoquímica Isotópica of the Universidade Federal de Ouro Preto (APQ03943). The authors thank the Microanalysis Laboratory of the Universidade Federal de Ouro Preto, a member of the Microscopy and Microanalysis Network of Minas Gerais State/Brazil/FAPEMIG, for the SEM-CL analyses. The authors also thank Prof. Dr. Ricardo Scholz (Universidade Federal de Ouro Preto, Brazil) for literature suggestions and for very helpful comments in the writing of this manuscript.
Adekoya J.A., Okonkwo C.T., Adepoju M.O. 2012. Geochemistry of Muro Banded Iron-Formation, Central Nigeria. International Journal of Geosciences, 3:1074-1083. DOI: 10.4236/ijg.2012.35108
Agangi A., Gucsik A., Nishido H., Ninagawa K., Kamenetsky V.S. 2016. Relation between cathodoluminescence and trace-element distribution of magmatic topaz from the Ary-Bulak massif, Russia. Mineralogical Magazine, 80(5):881-899. https://doi.org/10.1180/ minmag.2016.080.023
Agangi A., Kamenetsky V.S., Hofmann A., Przybyłowicz W., Vladykin N.V. 2014. Crystallisation of magmatic topaz and implications for Nb-Ta-W
mineralisation in F-rich silicic melts – The Ary-Bulak ongonite massif. Lithos, 202-203:317-303. https://doi.org/10.1016/j.lithos.2014.05.032 Baioumy H.M., Khedr M.Z., Ahmed A.H. 2013. Mineralogy, geochemistry and origin of Mn in the high-Mn iron ores, Bahariya Oasis, Egypt. Ore Geology Reviews, 53:63-76. https://doi. org/10.1016/j.oregeorev.2012.12.009
Boggs S.J., Kwon Y.-I., Goles G.G., Rusk B.G., Krinsley D., Seyedolali A. 2002. Is quartz cathodoluminescence color a reliable provenance
REFERENCES
tool? A quantitative examination. Journal of Sedimentary Research, 72:408-415. https://doi.org/10.1306/102501720408
Breiter K., Gardenová N., Vaculovič T., Kanický V. 2013.
Topaz as an important host for Ge in granites and greisens. Mineralogical Magazine, 77(4):403-417. https://doi.org/10.1180/ minmag.2013.077.4.01
Burt D.M., Sheridan M.F., Bikun J.V., Christiansen E.H. 1982. Topaz
Rhyolites – Distribution, origin, and significance for exploration.
Economic Geology, 77:1818-1836. https://doi.org/10.2113/ gsecongeo.77.8.1818
Christiansen E.H., Bikin J.V., Sheridan M.F., Burt D.M. 1984. Geochemical evolution of topaz rhyolites from the Thomas Range and Spor Mountain, Utah. The American Mineralogist, 69:223-236. DOI: 0003-004X/84/0304-0223$02.00
Christiansen E.H., Sheridan M.F., Burt D.M. 1986. The geology and geochemistry of Cenozoic topaz rhyolites from the Western United States: U.S. Geological Society of America Special Paper 205. Boulder (CO), The Geological Society of America, Inc., 90 p.
Correia-Neves J.M., Pedrosa-Soares A.C., Valle R.R. 1980. Geoquímica e gênese do Pegmatito Limoeiro (Virgem da Lapa – Minas Gerais). In: Congresso Brasileiro de Geologia, 31, Camboriú (SC). Anais..., p. 2134-2148.
Correns C.W. 1978. Titanium. In: Wedepohl K.H. (Ed.). Handbook of Geochemistry II-2. Heidelberg, Springer-Verlag, p. 22-B-O.
DiPietro J.A., Pogue K.R., Lawrence R.D., Baig M.S., Hussain A., Ahmad I. 1993. Stratigraphy south of the Main Mantle Thrust, Lower Swat, Pakistan. Geological Society of London, Special Publications, 74:207-220. https://doi.org/10.1144/GSL.SP.1993.074.01.15 Dorr II J.V.N. 1969. Physiographic, stratigraphic and structural development of the Quadrilátero Ferrífero, Minas Gerais, Brazil:
U.S. Geological Survey Professional Paper 641-A. Washington D.C., United States Government Printing Office, 109 p.
Duffield W.A. & Dalrymple G.B. 1990. The Taylor Creek rhyolite of New Mexico: a rapidly emplaced field of lava domes and flows.
Bulletin of Volcanology, 52:475-487.
Ferreira M.S.F., Fonseca M.A., Pires F.R.M. 2005. Pegmatitos mineralizados em água-marinha e topázio do Ponto do Marambaia, Minas Gerais: tipologia e relações com o granito Caladão. Revista Brasileira de Geociencias, 35(4):463-473.
Frelinger S.N., Ledvina M.D., Kyle J.R., Zhao D. 2015. Scanning electron microscopy cathodoluminescence of quartz: principles, techniques and applications in ore geology. Ore Geology Reviews, 65:840-852. https://doi.org/10.1016/j.oregeorev.2014.10.008 Gandini A.L. 1994. Mineralogia, inclusões fluidas e aspetos genéticos
do topázio imperial da região de Ouro Preto, Minas Gerais. Master Dissertation, University of São Paulo, São Paulo, 212 p.
Gauzzi T., Graça L.M., Lagoeiro L., Mendes I.C., Queiroga G.N.
2018 (in print). The fingerprint of imperial topaz from Ouro Preto
region (Minas Gerais state, Brazil) based on cathodoluminescence properties and chemical composition. Mineralogical Magazine. DOI: https://doi.org/10.1180/minmag.2017.081.078
Götte T., Pettke T., Ramseyer K., Koch-Müller M., Mullis J. 2011. Cathodoluminescence properties and trace element signature of
hydrothermal quartz: a fingerprint of growth dynamics. The American Mineralogist, 96:802-813. https://doi.org/10.2138/am.2011.3639
Heinrich E.W. 1978. Niobium. In: Wedepohl K.H. (Ed.). Handbook of Geochemistry II-4. Heidelberg, Springer-Verlag, p. 41-D.
Herrmann A.G. 1978. Yttrium and Lamthanides. In: Wedepohl K.H.
(Ed.). Handbook of Geochemistry II-5. Heidelberg, Springer-Verlag, p. 39,57-71-B-O.
Jan M.Q. 1979. Topaz occurrence in Mardan, north-west Pakistan. Mineralogical Magazine, 43:175-176. DOI: 10.1180/ minmag.1979.043.325.20
Krauskopf K.B. 1978. Tungsten (Wolfram). In: Wedepohl K.H. (Ed.).
Handbook of Geochemistry II-3. Heidelberg, Springer-Verlag, p. 74-B-O. Landergren S. 1978. Vanadium. In: Wedepohl K.H. (Ed.). Handbook of Geochemistry II-2. Heidelberg, Springer-Verlag, p. 23-B-O.
Leroy J.L., Rodríguez-Rios R., Dewonck S. 2002. The topaz-bearing rhyolites from the San Luis Potosi area (Mexico): characteristics of the lava and growth conditions of topaz. Bulletin de la Société Géologique
de France, 173(6):579-588. https://doi.org/10.2113/173.6.579 Lima S.A.A., Martins-Neto M., Pedrosa-Soares A.C., Cordani U.G., Nutman A. 2002. A Formação Salinas na área-tipo, NE de Minas
Gerais: uma proposta de revisão da estratigrafia da Faixa Araçuaí com base em evidências sedimentares, metamórficas, e idades U-Pb
SHRIMP. Revista Brasileira de Geociências, 32:491-500.
Lindsey D.A. 1982. Tertiary volcanic rocks and uranium in the Thomas Range and Northern Drum Mountains, Juab County, Utah:
U.S. Geological Survey Professional Paper 1221-A. Washington D.C., United States Government Printing Office, 71 p.
Marshall D. & Walton L. 2007. Topaz. In: Groat L.A. (Ed.). Geology of gem deposits: Short Course Series, 37. Vancouver, Mineralogical Association of Canada, p. 161-168.
Martin N.R., Siddiqu S.F.A., King B.H. 1962. A geological reconnaissance of the region between Lower Swat and Indus rivers in Pakistan. Geological Bulletin of Punjab University, 2:1-14. Morteani G., Bello R.M.S., Gandini A.L., Preinfalk C. 2002. P, T, X conditions of crystallization of Imperial Topaz from Ouro Preto (Minas
Gerais, Brazil): fluid inclusions, oxygen isotope thermometry and
phase relations. Schweizerische Mineralogische und Petrographische Mitteilungen, 82:455-466. http://doi.org/10.5169/seals-62375
Morteani G. & Voropaev A. 2007. The pink topaz-bearing calcite, quartz, white mica veins from Ghundao Hill (North West Frontier
Province, Pakistan): K/Ar age, stable isotope and REE data. Mineralogy and Petrology, 89:31-44. DOI: 10.1007/s00710-006-0136-6
Morteani G., Pfeinfalk C., Horn A.H. 2000. Classification and
mineralization potential of the pegmatites of the Eastern Brazilian Pegmatite Province. Mineralium Deposita, 35:638-655.
Olsen D.R. 1971. Origin of topaz deposits near Ouro Preto, Minas Gerais, Brazil. Economic Geology, 66(4):627-631. https://doi. org/10.2113/gsecongeo.66.4.627
Pedrosa-Soares A.C., Campos C.P., Noce C., Silva L.C., Novo T., Roncato J., Medeiros S., Castañeda C., Queiroga G., Dantas E., Dussin I., Alkmim F. 2011. Late Neoproterozoic-Cambrian granitic magmatism in the Araçuaí orogen (Brazil), the Eastern Brazilian Pegmatite Province and related mineral resources. In: Sial A.N., Bettencourt J.S., Campos C.P., Ferreira V.P. (Eds.). Granite-related ore deposits, Special Publications, 350:25-51.
Pedrosa-Soares A.C., Correia-Neves J.M., Leonardos O.H. 1990. Tipologia dos pegmatitos de Coronel Murta-Virgem da Lapa, Médio Jequitinhonha, Minas Gerais. Revista Escola de Minas, 43:44-59. Pinho-Tavares S. 2004. O feldspato industrial de Coronel Murta, MG: caracterização de lavras em pegmatitos e do feldspato potássico na perspectiva de aplicações à indústria cerâmica e vidreira. Master Dissertation, Instituto de Geociências, Universidade Federal de Minas Gerais, Belo Horizonte, 241 p.
Rojas A.J. 2008. Estudos químico-mineralógicos e microtermométricos
do topázio imperial da região de Antônio Pereira, Ouro Preto, Minas Gerais. Master Dissertation, Departamento de Geologia, Universidade Federal de Ouro Preto, Ouro Preto, 111 p.
Rojas A.J., Bello R.M.S., Endo I., Gandini A.L. 2009. Estudio mineralógico, microtermométrico y aspectos estructurales de la mineralización de topacio imperial de Antônio Pereira, Distrito de Ouro Preto (Minas Gerais) – Brasil. Revista Escola de Minas, 62(1):9-16. http://dx.doi.org/10.1590/S0370-44672009000100003 Rusk B.G., Lowers H.A., Reed M.H. 2008. Trace elements in hydrothermal quartz: relationships to cathodoluminescent textures and insights into vein formation. Geology, 36, 547-550. https://doi. org/10.1130/G24580A.1
Selmi M., Lagoeiro L.E., Endo I. 2009. Geochemistry of hematitite and itabirite, Quadrilátero Ferrífero, Brazil (Geoquímica de hematitito e itabirito, Quadrilátero ferrífero, Brasil). Revista Escola de Minas, 62(1):35-43. http://dx.doi.org/10.1590/S0370-44672009000100006 Shiraki K. 1978. Chromium. In: Wedepohl K.H. (Ed.). Handbook of Geochemistry II-3. Heidelberg, Springer-Verlag, p. 24-B-O.
Spier C.A., Oliveira C.M.B., Rosière C.A. 2003. Geology and geochemistry of the Águas Claras and Pico Iron Mines, Quadrilátero Ferrífero, Minas Gerais, Brazil. Mineralium Deposita, 38:751-774. DOI: 10.1007/s00126-003-0371-2
Van der Kerkhof A.M., Kronz A., Simon K., Scherer T. 2004. Fluid-controlled quartz recovery in granulite as revealed by cathodoluminescence and trace element analysis (Bamble sector, Norway). Contributions to Mineralogy and Petrology, 146:637-652.
Wasim M., Zafar W.A., Tufail M., Arif M., Daud M., Ahmad A. 2011.
Elemental analysis of topaz from northern areas of Pakistan and
assessment of induced radioactivity level after neutron irradiation
for color induction. Journal of Radioanalytical and Nuclear Chemistry, 287:821-826. DOI: 10.1007/s10967-010-0879-8
Wedepohl K.H. 1978a. Copper. In: Wedepohl K.H. (Ed.). Handbook of Geochemistry II-3. Heidelberg, Springer-Verlag, p. 29-B-O.
Wedepohl K.H. 1978b. Manganese. In: Wedepohl K.H. (Ed.). Handbook of Geochemistry II-3. Heidelberg, Springer-Verlag, p. 25-B-O.
Wedepohl K.H. 1978c. Tantalum. In: Wedepohl K.H. (Ed.). Handbook of Geochemistry II-5. Heidelberg, Springer-Verlag, p. 73-B-O.
Wedepohl K.H. 1978d. Zinc. In: Wedepohl K.H. (Ed.). Handbook of Geochemistry II-3. Heidelberg, Springer-Verlag, p. 30-B-O.
Wu C.-Z., Liu S.-H., Gu L.-X., Zhang Z.-Z., Lei R.-X. 2011. Formation mechanism of the lanthanide tetrad effect for a topaz- and amazonite-bearing leucogranite pluton in eastern Xinjiang, NW China. Journal of Asian Earth Sciences, 42:903-916. DOI: 10.1016/ j.jseaes.2010.09.011 Yu K.-C., Tsai L.-J., Chen S.-H., Chang D.-J., Ho S.-T. 2001. Multivariate correlations of geochemical binding phases of heavey metals in contaminated river sediment. Journal of Environmental Science and Health, Part A, 36(1):1-16. https://doi.org/10.1081/ESE-100000467 Zhang R.Y., Liou J.G., Shu J.F. 2002. Hydroxyl-rich topaz in high-pressure and ultrahigh-high-pressure kyanite quartzites, with retrograde woodhouseite, from the Sulu terrane, eastern China. 2002. The American Mineralogist, 87:445-453. https://doi.org/10.2138/ am-2002-0408

![Figure 2. SEM-CL panchromatic images of the different topaz crystals: (1) central rhombic pattern developing along [110]; (2) triangular area with strong luminescence; (3) straight growth zones aligned with [110]; (4) [110] direction.](https://thumb-eu.123doks.com/thumbv2/123dok_br/16163118.707028/4.892.86.423.886.1125/panchromatic-different-crystals-developing-triangular-luminescence-straight-direction.webp)