Bhimjee, D. C. P., & Leão, E. R. (2020). Public debt, GDP and the Sovereign Debt Laffer curve: A country-specific analysis for the Euro Area. Journal of International Studies, 13(3), 280-295. doi:10.14254/2071-8330.2020/13-3/18
Public debt, GDP and the Sovereign Debt
Laffer curve: A country-specific analysis
for the Euro Area
Diptes Bhimjee
Department of Economics, Iscte Business School (IBS), Instituto Universitário De Lisboa (ISCTE-IUL), Lisbon, Portugal Diptes_Bhimjee@iscte-iul.pt
ORCID 0000-0003-4065-5805
Emanuel Leão
Department of Economics, Iscte Business School (IBS), Instituto Universitário De Lisboa (ISCTE-IUL), Lisbon, Portugal Emanuel.Leao@iscte-iul.pt
ORCID 0000-0002-9586-7365
Abstract. This article analyses the non-linear association between public debt and GDP for the Euro Area since the introduction of the euro. It draws on a theoretical concept – the sovereign debt Laffer curve - previously proposed in literature. Our empirical research design contemplates: (i) estimating a public debt Laffer curve for each Euro Area country; (ii) computing country thresholds from the estimated Laffer curves, i.e., the points beyond which further increases in public debt have damaging effects on output; (iii) analyzing the deviations of the current debt position of each country relative to the respective optimal threshold. We conclude that certain Member States have already gone beyond their optimal thresholds, meaning public debt is already limiting output growth. Our contribution to the field consists in the estimation of country-specific thresholds for each Euro Area Member State. To do this we ran a separate quadratic regression for each country, instead of aggregating multiple countries in a single estimation.
Keywords: Euro Area sovereign debt crisis, global financial crisis, sovereign debt Laffer curve, sovereign debt threshold.
JEL Classification: G01, E62, E44, F34
Received: December, 2019 1st Revision: May, 2020 Accepted: August, 2020 DOI: 10.14254/2071- 8330.2020/13-3/18 Journal of International Studies
Sci
en
tif
ic
Pa
pe
rs
© Foundation of International Studies, 2020 © CSR, 20201. INTRODUCTION
1The Euro Area sovereign debt crisis constitutes a cumbersome epilogue to the global financial crisis (hereinafter GFC), a systemic event that has deeply scarred international financial markets and affected the performance of real economies.
In order to countervail the GFC’s economic impact, the Euro Area economies have adopted a common expansionary monetary policy (e.g., the ECB’s quantitative easing program) whilst pursuing heterogeneous fiscal policies that have ultimately endeared each Member State’s public purse.
Where the pursuit of heterogeneous expansionary fiscal policies is concerned, the corresponding financing burden has mainly fallen upon the public debt instrument. Accordingly, the public debt-to-GDP ratios have soared in the aftermath of the GFC (Figures 1 and 2), leading to the inevitable breach of the conservative principles proposed by the Stability and Growth Pact (SGP). In the specific case of the GIIPS economies, the latter have had to implement tough and demanding economic reforms, in order to countervail severe macroeconomic/fiscal imbalances in this specific sub-set of the Euro Area economies (Correia & Martins, 2019).
The present article investigates to what extent the public debt financing instrument has been strained in the aftermath of the GFC. The article’s research question is the following: Is excessive sovereign debt
accumulation by the Euro Area Member States associated with the decline of the said Member States’ GDP schedules? In the affirmative case, how so? The main aim of this article is to quantitatively investigate whether optimal public
debt levels have been surpassed in the Euro Area in the context of the Global Financial Crisis and the ensuing Euro Area Sovereign Debt Crisis. In order to achieve this research goal, the article employs a quadratic econometric specification, so that the impact of non-linearities related to public debt might be properly determined for each Euro Area Member State.
More generally, we address the important policy question of determining the thresholds above which public debt becomes an obstacle to output growth. Recent empirical evidence characterizing the relation between public debt and economic growth suggests that countries presenting low public debt levels are associated with higher economic growth rates; while lower economic growth rates are associated with higher public debt levels (Ramos-Herrera & Sosvilla-Rivero, 2017).
In order to answer our research question we use the sovereign debt Laffer curve, an inverted U-shaped concept initially proposed by Krugman (1988) and Sachs (1990). This conceptual curve describes a quadratic relationship association between public debt and GDP, thus accounting for the non-linear impact of the former variable on the latter. Accordingly, we employ an OLS quadratic specification on public debt, using data available from the AMECO database.
Our contribution to the field is thus quite clear: by ascertaining whether the quadratic fit between public debt and GDP describes the non-linear association between these variables, the corresponding thresholds can be estimated. These thresholds signal, for each Member State, the optimal level beyond which ‘debt intolerance’ starts to exert its influence. Thus, our findings expand the body of literature addressing the non-linear impact of public debt on GDP. For example, Caner, Grennes and Koehler-Geib (2010), Cecchetti, Mohanty and Zampolli (2011), Checherita-Westphal and Rother (2012), Baum, Checherita-Westphal and Rother (2013) and Reinhart and Rogoff (2010) illustrate the importance of estimating thresholds as turning points beyond which the negative effects of excessive public debt become harmful. In order to further extend this literature strand, we will investigate the possibility that the
thresholds are idiosyncratic across the Euro Area. Previous research has focused mainly on aggregate macro-regional data, whereas we essentially discuss country-specific thresholds.
Adopting a timeline which focuses on the period 1995-2016, our findings suggest that in several Euro Zone countries optimal public debt levels have already been surpassed.
Our study is important for policy formulation on two counts: (i) it observes an important non-linear association between public debt and G.D.P.; and (ii) it identifies some countries where excessively high public debt levels may inhibit the country’s ability to respond to future economic shocks. Accordingly, two policy recommendations are suggested: (i) promote Euro Area public debt sustainability in the Member States that already have excessive public debt levels; (ii) explore common ways through which the European Commission could use joint policy instruments to support the efforts of individual Member States.
The Eurozone’s continuity crucially rests on the design of a common and flexible fiscal policy response to accommodate future shocks of systemic magnitude. For example, should the present COVID-19 pandemic situation lead to sharp increases in Euro Area national governments’ deficits (i.e., higher expenditures accompanied by lower tax collection revenues), Member States with pre-pandemic excessive public debt may find themselves further fiscally burdened. This would make the management of the existing public debt especially difficult which, in turn, would inhibit each country’s ability to persevere in responding to the present pandemic economic crisis. As a consequence, the need for a joint/common Euro Area fiscal response to the present pandemic would most likely emerge. In fact, the European Commission has already launched a massive recovery package worth €750bn. To fund this initiative, the European Commission will borrow in international debt markets.
The article is structured as follows: section 2 provides a review of the relevant literature, highlighting the estimation of sovereign threshold levels; section 3 introduces the empirical methodology and data herein used; section 4 presents the empirical findings pertaining to the Euro Area; finally, section 5 concludes.
2. THE IMPORTANCE OF PUBLIC DEBT THRESHOLD ESTIMATION
Public debt thresholds have typically been portrayed in the sovereign debt literature as ‘optimal’ threshold points beyond which excessive public debt starts to exert a negative influence on economic activity. According to the latter literature, these thresholds represent a point beyond which public debt becomes excessive and unmanageable. A showcase of selected articles addressing this fundamental topic is presented in the following paragraphs.
Caner, Grennes and Koehler-Geib (2010) analyses a broad sample of 101 countries within the 1980– 2008 period, employing a threshold least squares regression model involving real GDP growth and public debt variables. They identify a unique threshold level - 77.1 per cent (of public debt-to-GDP ratio) for a sub-sample of 79 countries - beyond which public debt starts to impact negatively on economic growth. Each additional percentage point of sovereign debt-to-GDP ratio costs the economy 0.0174 percentage points in annual average real growth (Caner, Grennes & Koehler-Gieb, 2010:5)2.
Cecchetti, Mohanty and Zampolli (2011) use a database comprised of 18 OECD countries for the 1980–2010 period and conclude that public debt is harmful for output growth when the public debt-to-GDP ratio is beyond the 80 per cent - 100 per cent range. These authors also draw attention to two
2 The threshold for the sub-set of developing countries is much lower (64 per cent), confirming the presence of a lower ‘debt
term important facts: first, impending ageing demographic profiles will further strain Member States’ fiscal policy instruments in the long run; and second, reducing public debt profligacy would reinforce Member States’ ability to respond to future economic shocks of uncertain magnitude.
Checherita-Westphal and Rother (2012) directly assess the average impact of sovereign debt on per capita GDP growth in twelve Euro Area countries collectively addressed during the 1970-2011 period, by employing a quadratic econometric specification in debt. A non-linear impact of public debt on growth is specified, and this impact becomes negative after a given turning point has been reached. The authors observe a concave (inverted U-shape) relationship between the variables, with a sovereign debt-to-GDP ratio turning-point between 90 per cent – 100 per cent (although further evidence is found at much lower levels of 70 per cent - 80 per cent). These authors also conclude that the impact of public debt on economic growth is conveyed through the following channels: private saving, public investment, total factor productivity and sovereign long-term nominal and real interest rates.
Using data from 44 countries spanning the last two centuries, Reinhart and Rogoff (2010) conclude that, on average, when public debt goes above 90% of GDP, growth slows by one percentage point. Égert (2015) further tests the latter authors’ dataset for the existence of non-linear thresholds, although the findings are somewhat mixed.
The estimation of public debt thresholds further prompts the research issue pertaining to the channels through which the impact of excessive public debt on output is transmitted.
Kumar and Woo (2010) provide a comprehensive review of growth-distortionary channels which include: the adverse effect of public debt on capital accumulation and growth through higher long-term interest rates, the onset of future inflation corroding growth, the prospect of greater macroeconomic uncertainty affecting growth, the constraints imposed by high levels of debt on the scope of countercyclical fiscal policy, and the ‘debt overhang’ channel3. Evidence suggests that these channels
become manifest once certain thresholds are breached.
Baum, Checherita-Westphal and Rother (2013) focus on the Euro Area in the 1990-2010 period. These authors conclude that, for Member States exhibiting debt ratios above 70 per cent, higher long-term interest rates are observable. For highly indebted Member States (those exhibiting public debt-to-GDP ratios in excess of 95 per cent), further public debt harms economic activity. A simple connection between public debt and output growth has been advanced by Robert Barro; according to this channel, future debt sustainability strongly depends on rising taxes, which inevitably end up being raised in the long-term. This originates a subsequent distortionary impact on long-term output growth, ultimately straining the ensuing redemption of existing public debt (Reinhart & Rogoff, 2010).
According to the literature herein reviewed, estimates for threshold points range from 77.1 per cent up to a value as high as 100 per cent, notwithstanding the fact that these values refer to medium-to-long historical cycles for sets of countries. Our innovative approach centers on estimating individual
country-specific thresholds for the Euro Area. This is in accordance with the Chudik, Mohaddes, and Pesaran (2017),
Eberhardt and Presbitero (2015), as well as Égert (2015), who side with the line of argumentation opposing the existence of a universal (i.e., valid for all countries) threshold point4.
The literature also examines the possible link – suggested by the Ricardian Equivalence Theorem (RET) – between higher public debt and current private consumption. Kusairi, Maulina and Margaretha
3 There is also a growing literature on the transfer of private sector losses to the public purse (e.g., through sizeable financial
sector bailouts). For example, a pre-Crisis theoretical framework, known as the credit risk transfer hypothesis, is described in Allen and Carletti (2006), while Acharya, Drechsler and Schnabl (2014), Attinasi, Checherita and Nickel (2009), Barrios, Iversen, Lewandowska and Setzer (2009), and Ejsing and Lemke (2009) empirically confirm the said credit risk transfer hypothesis.
(2019) and Gogas, Plakandaras and Papadimitriou (2014) empirically test the RET, but generally fail to find unequivocal empirical support to the RET for Asia Pacific and OECD countries, respectively. Although following different lines of enquiry, Insukindro (2018) and Tung (2020) analyze the pressing issue of fiscal sustainability, highlighting the importance of upholding fiscal balance, especially in an environment characterized by frequent economic shocks.
In light of the afore-mentioned studies, we believe it is important to investigate the possible existence of relevant country-specific public debt thresholds in the Euro Area. These thresholds would constitute important reference points to policy-makers.
3. METHODOLOGY AND DATA
Krugman (1988) and Sachs (1990) propose the overall architecture of the sovereign debt Laffer curve by endorsing the view that excessive public debt accumulation above a certain threshold point over-burdens GDP. This setting can be tested using a quadratic specification. This specification constitutes a sounder alternative to the method used by Reinhart and Rogoff (2010), insofar as the threshold levels are determined by an optimization process (instead of being chosen in a discretionary way). In the present case, due to data limitations, it’s not feasible to use more extensive long-term causality methods.
The Laffer curve is a quadratic curve composed of two sections: an ‘advantageous’ section wherein low levels of public debt enhance GDP; and a ‘disadvantageous’ section wherein high levels of public debt harm GDP. The two sections are thus divided by an optimal threshold point. This ‘optimality’ is solely considered from a leverage perspective and should not be regarded from an economic welfare maximization perspective. A quadratic econometric fit thus seems an appropriate tool to test this theoretical framework.
We employ a specific model design within the classical linear regression model, namely a polynomial regression of order two (i.e., a quadratic specification). This allows us to capture the linear and the non-linear effects of public debt on output. We then compute the public debt thresholds as the optimal points (i.e., the maximum points) of the estimated curves5.
We run a separate quadratic regression for each Euro Zone country, instead of aggregating multiple countries in a single estimation. The main idea is to verify if it’s possible to obtain a more idiosyncratic (i.e., country-specific) set of results, as opposed to providing a more unified aggregate view6.
Our adopted regression specification is:
Yt i = α i + β i Xt i + γ i X2t i + ε t i (1)
where Yt i represents Gross Domestic Product (GDP) for each Member State i in real terms, Xti
the linear impact of sovereign debt for each Member State i, X2t i the squared impact of sovereign debt
for each Member State i, α i , the constant term, β i , γ i the estimated coefficients for the linear and
squared variable terms, respectively, ε i t the error term, t the time subscript and i each Euro Area
Member State. The existence of a concave function (if it exists) would demonstrate the existence of a unique threshold for each Member State.
Although the above-mentioned specification incorporates a squared term, the principles of the classical normal linear regression model are nevertheless applicable, insofar as the OLS linear model requires linearity in the coefficients (and not in the variables) (Gujarati, 2003). We expect each γi to be
negative, so that the fitted curves possess an inverted U-shape, each with a corresponding maximum
5 An estimation for the entirety of the Euro Area using data aggregated from the individual series is also conducted. 6 This unified perspective will nevertheless be checked when we address the regression for the Euro Area as a whole.
separating the two curve sections. This is in agreement with most of the GDP – sovereign debt trajectories of the Member States depicted in Figure 1.
Our choice of the quadratic specification is due to: (i) the theoretical framework advanced by Krugman (1988) and Sachs (1990); (ii) the non-linear build-up of sovereign debt stress in many countries which is visible in Figure 1; (iii) the aim of adopting a simple estimation framework that avoids the divergence latent in the literature concerning control variables (see, for example, Caner, Grennes and Koehler-Geib (2010)); (iv) the dynamics of the heterogeneous fiscal policies pursued by each Member State (see, for example, Petrovic and Tutsch, (2009)); and finally (v) the quadratic model is quite flexible to national fiscal specificities, allowing us to obtain country-specific (i.e., idiosyncratic) thresholds.
The framework seems adequate to provide an empirical analysis for the theoretical sovereign debt Laffer curve initially proposed by Krugman (1988) and Sachs (1990).
Our methodological approach has the following limitations: (i) it focuses on the exclusive relationship between public debt and real GDP since the adoption of the Euro; (ii) it depicts an association relationship (and does not address causality); (iii) cross-border sovereign contagion is not addressed in the estimations; (iv) the estimations are sensitive to the adoption of more aggressive solutions by policy makers to tackle the Member States’ sovereign debt problems7.
Our data set includes the following variables for each Member State: GDP at constant prices (base year: 2010) and nominal gross sovereign debt. We have opted to include the former variable using constant prices in order to disregard the impact of inflation on growth, thus following the procedure previously adopted by Caner, Grennes and Koehler-Gieb (2010).
The data set was extracted from the AMECO database, compiled by the European Commission, and collected for the 19958–2016 period (thus comprising 22 annual9 observations for each country). The
evolution of GDP is relatively stable until 2007, and is thereafter negatively impacted by the Global Financial Crisis and ensuing Eurozone Sovereign Debt Crisis. On the other hand, public debt is relatively stable until 2009 but increases significantly thereafter, in the period corresponding to the Eurozone Sovereign Debt Crisis.
Our estimation sample includes the following Euro Area countries: Austria, Belgium, Cyprus, Estonia, Finland, France, Germany, Greece, Ireland, Italy, Latvia, Lithuania, Luxembourg, Malta, Netherlands, Portugal, Slovakia, Slovenia and Spain.
4. EMPIRICAL FINDINGS
The first stage of our empirical study involves estimating polynomial regressions of second order (i.e., quadratic specifications) for each Member State of the Euro Area (sub-section 4.1.). The second stage involves computing thresholds (i.e., maximum points) from the estimated curves which reflect the maximum leverage that public debt confers on GDP (sub-section 4.2.). The third stage involves analyzing the deviations of the current debt position of each country relative to the respective optimal threshold (sub-section 4.3.).
7 The debt restructuring which Greece carried out in 2012 had a strong impact on our estimation of the Laffer curve for Greece
(this debt restructuring is visible in Figure 1, Subfig. labeled ‘Greece’).
8 Although the Euro was introduced as an accounting currency in 1999, the beginning point of our series starts in 1995, in order
to include the maximum number of available annual data points.
4.1. Quadratic estimations
Our findings for the estimation of quadratic regressions for Euro Area Member States are in Table 110. Hereinafter, we first convey a general appreciation of the overall results, followed by a closer
inspection of the specific findings pertaining to each Member State.
According to Table 1, the quadratic specification is quite effective in capturing the dynamics of the sovereign debt Laffer curve, thus effectively addressing the impact of the non-linearities of sovereign debt on GDP. The overall goodness-of-fit is manifested in the following supporting evidence: the highly significant ‘p-values’ associated with the corresponding coefficients for each estimated quadratic regression; and robust ‘R-squared’ and ‘Adjusted R-squared’ values. Our empirical findings thus seem to support the theoretical perspective first advanced by Krugman (1988) and Sachs (1990).
Where the quality of the individual coefficients α, β and γ is concerned, the corresponding p-values pertaining to the estimated regressions are, overwhelmingly, quite statistically significant, which attests to the importance of the public debt variable expressed in a linear and quadratic form. In some estimations, the constant term (α) was not statistically significant, thus indicating that, in the absence of sovereign debt, the corresponding output level would theoretically be void, suggesting that low sovereign debt deeply favors economic expansion. This lack of statistical significance of the constant term occurs only in a small number of estimations.
In terms of goodness-of-fit, the R-squared (Adjusted R-squared) values are quite high, revealing the estimated quadratic equations’ expressive explanatory power. In fact, R-squared (Adjusted R-squared) range from a low value of 52.2611 per cent (44.9166 per cent) for Latvia to 95.0755 per cent (94.7238 per cent) for Malta. In itself, this variability strongly justifies our use of country-specific estimations. To sum up, a high proportion of the variation in output is explained by the quadratic specification on public debt for each Member State. Equally, the computed F-statistics also indicate the overall robustness of the estimations. These results give empirical support to the theoretical perspective proposed by Krugman (1988) and Sachs (1990) regarding the sovereign debt Laffer curve.
Regarding the normality of residuals, the Jarque-Bera Test Statistic was applied to the residuals resulting from our regression estimations. The said residuals were found to follow a normal distribution in all of the computed estimations.
We next examine, based on Table 1, the following issues: serial correlation, heteroscedasticity and multicollinearity. Priority is given to serial correlation, given our sample’s use of time series variables, although all potential assumptions violations are carefully checked.
Where the potential presence of serial correlation is concerned, both the DW Statistic and the Breusch–Godfrey Serial Correlation LM Test were performed. Initially, an autoregressive residual component is added to the adopted quadratic specification, whenever serial correlation was initially found to be expressive. A first-order component was initially used (in the cases of Belgium, Finland and Slovakia), while a second-order was also added to the first-order component, whenever the latter’s incorporation into our initial specification failed to fully achieve its intended goal (for Spain).
Furthermore, Newey-West Consistent Standard Errors & Covariances were employed whenever serial correlation still persisted, thereby correcting the corresponding standard errors in the affected estimations. This procedure is adopted in order to use the most appropriate standard errors and p-values
10 We initially tested for the significance of a baseline linear vs. quadratic specification using the Ramsey RESET Test. We
conclude that the linear specification is more adequate for the following countries: Finland, Germany, Lithuania, Luxembourg and Malta; while the quadratic specification is more suitable to: Austria, Belgium, Cyprus, Estonia, France, Greece, Italy, Latvia, Netherlands, Portugal, Slovakia, Slovenia, Spain and the Euro Area (as a whole). Ireland is misspecified for both the linear and the quadratic specification.
for regression validation, which appropriately support our findings. Notwithstanding, residual serial correlation might still persist, given our exclusive reliance on the public debt variable. Gujarati (2003) notes that the omission of relevant independent variables might lead to estimation results which are prone to the excluded variable specification bias. This explains the persistent presence of serial correlation in our final estimations, although this ends up being inconsequential11. Our overall findings suggest that
goodness-of-fit is achieved without major breaches to the model’s assumptions, once the serial correlation issue is properly addressed (although it cannot be entirely dismissed, due to the referred excluded variable specification bias).
Regarding the potential violation of homoscedasticity, the White Heteroscedasticity Test was applied. Only Greece, Slovakia and Spain were found to be affected by heteroscedasticity. In these cases, the adoption of White Heteroskedasticity-Consistent Standard Errors and Covariances was adopted. This procedure allows for the proper use of the most appropriate standard errors and p-values for regression validation.
As for the potential presence of multicollinearity, Gujarati (2003) observes that the adoption of a quadratic specification does not, strictly speaking, lead to the presence of multicollinearity. This is due to the fact that there prevails an explicitly functional relationship between X and X2 which is clearly
non-linear. We adopt the latter author’s guidelines on this matter, also taking into account that a widely used method of detecting multicollinearity – the existence of a high R-Squared statistic but few significant t Ratios – is not present in any of our estimations (Gujarati, 2003).
In order to complement country-specific estimations, a quadratic estimation was also performed for the Euro Area as a whole, using Euro Area aggregate data for sovereign debt and GDP12. Specifically, a
quadratic estimation without a constant term was obtained, with a R-squared (Adjusted R-squared) equal to 83.5007 per cent (82.3222 per cent). Existing residual serial correlation was dealt with by employing Newey-West Consistent Standard Errors & Covariances.
The goodness-of-fit of the quadratic estimations can be observed in the sound explanatory power of the regressions, as well as in the overall compliance with the regression model’s assumptions, especially through the use of appropriate standard errors.
We conclude that a majority of the Member States’ public debt and GDP trajectories are in compliance with the existence of underlying country-specific sovereign debt Laffer curves in the Euro Area. Our research brings further empirical support to the idea that significant increases in public debt might start to harm economic growth. This is a line of argumentation initially explored by Reinhart & Rogoff (2010), although our findings suggest the existence of country-specific thresholds (as opposed to a universal threshold valid for all countries).
4.2. Sovereign debt – output thresholds
The second stage of our analysis involves computing optimal public debt-to-GDP thresholds from the previously estimated quadratic equations. This optimality is associated with the sovereign debt variable’s maximum leveraging power over GDP. In the context of the sovereign debt Laffer curve
11 Ireland is the main exception due to the estimation’s poor goodness-of-fit, which is indicative of misspecification. Neither this
country’s scatter plot (Figure 1, sub-figure entitled ‘Ireland’) nor the RESET test mentioned above support the case for either a linear or a quadratic specification. Whelan (2011) observes that the Irish public debt instrument was decisive in supporting the country’s stricken banking industry, threatening the creditworthiness of Irish sovereign debt in the aftermath of the systemic shock, although pre-Crisis debt levels were quite moderate.
12 The results for the Euro Area are probably influenced by the fact that Germany - the Euro Area’s biggest economy – does not
framework, the thresholds constitute the turning point separating the advantageous and the disadvantageous sections of the curve. That is, each threshold separates the two sub-sets of combination points between public debt and G.D.P. that yield either an under-leveraged or an over-leveraged association between these two variables.
We compute the first and second order conditions for the existence of an optimal point pertaining to the quadratic equations previously estimated13. The latter quadratic estimations clearly point to the
existence of an inverted U-shaped association between public debt and output for each Member State, given that the coefficient pertaining to the squared debt term is negative in all our quadratic estimations, and thus, the corresponding optimal point is necessarily a maximum14 (Table 1, column entitled
‘Coefficients of quadratic specification’, sub-column ‘γi’)15. This adequately reflects the fact that, from a
macroeconomic standpoint, each threshold represents the point of maximum economic leverage derived from public debt. The coordinates of the optimal (maximum) points are shown in Table 2, for every case in which a quadratic specification was empirically validated. These coordinates represent the values of sovereign debt (x-axis) and GDP (y-axis). They also represent the maximum leveraging power of sovereign debt on GDP.
Furthermore, by dividing the optimal level of the sovereign debt by the optimal level of the GDP, we arrive at the optimal sovereign debt-to-GDP threshold for each Member State. This ratio constitutes the threshold point separating both sides of the curve (i.e, the under-leveraged from the over-leveraged sections of the Laffer curve).
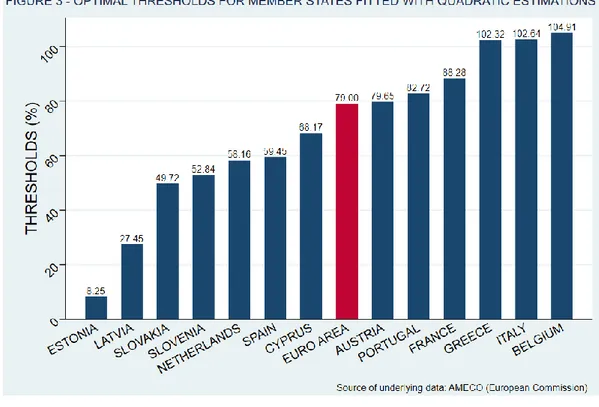
Our findings suggest that debt-to-GDP country thresholds are quite heterogeneous within the Euro Area. They range from 8.250021 per cent (Estonia) to 104.910658 per cent (Belgium), thus indicating a high degree of heterogeneity at a country-specific level. Our findings clearly extend previous research, which mainly addressed the existence of thresholds at an aggregate macro-regional level, which didn’t reveal this diversity across the Euro Area. This is actually confirmed through the comparison between the country-specific findings and the aggregate finding for the Euro Area as a whole.
Furthermore, a sub-set of Member States composed by Estonia, Latvia, Slovenia and Slovakia (the ‘New EU Member States’) exhibits very low thresholds; whereas the sub-set comprised by mostly Mediterranean Member States (the ‘GIIPS’) exhibits higher thresholds. These higher thresholds obtained for the GIIPS sub-set might be explained by the structural weakness of private expenditure - private consumption and investment – in their economies, which makes extra debt-financed public expenditure marginally more valuable.
From an economic standpoint, our findings suggest a significant variability in terms of Member States’ fiscal policy positions, which most likely depend on each country’s historic fiscal traditions. Moreover, the significant range between extreme thresholds (i.e., the difference between the maximum and the minimum thresholds) might further indicate that EU-wide fiscal policy harmonization might be difficult to achieve, in the case a joint fiscal framework might be pursued in the future, as fiscal coordination might be difficult to implement.
For example, the sub-set of the ‘New EU Member States’ is historically associated with very low sovereign debt profiles. By contrast, the sub-set of the GIIPS Member States has typically been associated with high public debt-to-GDP ratios.
13 For this purpose, it should be observed that the expected value of the error terms is zero.
14 Optimal threshold maximums are obtained by computing the first derivative to each of the quadratic equations, equaling each
of the latter to zero and then finding the optimal sovereign debt – output solutions that satisfy the latter equations.
15 In the remaining estimations (i.e., those fitted with a linear specification), rising public debt is considered to be associated with
On the other hand, the dichotomy between Northern and Southern Member States is currently being addressed through the pursuit of sounder macroeconomic policies that require the stabilization of public debt-to-GDP ratios in the Southern Member States (De Grauwe & Ji, 2013).
The optimal thresholds we obtained vary widely across Euro Area countries. This heterogeneity in the computed thresholds might also be explained on two counts: (i) the existence of Member States’ idiosyncratic fiscal policy practices16; and (ii) the differing nature of the sovereign debt problem in the
various countries17. Lastly, our individual country estimates are entirely consistent with the historical
country values advanced by Égert (2015), which also reveal a high level of cross-country heterogeneity, not observable in aggregate threshold studies. In clear contrast with those findings suggesting common single aggregate thresholds for a given set of countries (Caner, Grennes & Koehler-Geib (2010); Cecchetti, Mohanty & Zampolli (2011); Baum, Checherita-Westphal & Rother (2013); and Reinhart & Rogoff (2010)), our country-specific findings suggest that Member States’ thresholds are significantly different across the Euro Area. An explanation for this is associated with the existence of heterogeneous fiscal policy traditions, which are essentially observable through significantly different public debt ratios18.
That is, our findings suggest that both country-specific and aggregate estimations can be performed, but country-specific estimations are more reflective of a given Member States’ fiscal position as signaled by the respective individual threshold19. Whereas the estimation of aggregate thresholds does not reveal
heterogeneity in the presence of significant variability across country-specific thresholds.
In terms of fiscal policy implications, these findings are important in three ways: (i) each country’s individual threshold represents an optimal combination point between public debt and GDP, and thus constitutes a reference point in terms of fiscal policy design and implementation; (ii) this reference point’s strategic importance is highlighted in a monetary union (such as the Euro), where the role of fiscal policy is especially important; and (iii) if and when a common fiscal is adopted, it should be carefully designed in order to accommodate heterogeneous fiscal policy practices and procedures within the Euro Area.
4.3. Deviations
Our final step was to compute the deviations of the current debt position of each country relative to the respective threshold (Table 2, last column). These deviations range from 2.90 per cent (Estonia) to 67.65 per cent (Greece). The larger two-digit deviations are typically associated with those Member States that have been under pressure from sovereign debt markets.
We conclude that, post-GFC, several Euro Area economies have been in the over-leveraged section of the Laffer curve, where the corresponding levels of GDP are burdened by large public debt schedules. Many Euro Area Member States thus seem to suffer from the condition previously described in the literature as ‘debt vulnerability’. In other words, many sovereign debt schedules seem to be on an
16 Pending ratification, the ‘Treaty on Stability, Coordination and Governance in The Economic And Monetary Union’ (a.k.a. the
‘European Fiscal Compact’) constitutes a fundamental step in addressing this heterogeneity issue, by stipulating a more disciplined view of each Signatory’s fiscal position (European Council, 2012).
17 For example, Hellwig (2011) observes that there co-exist not one but three distinct manifestations of the sovereign crisis, each
being clearly predominant in a given Member State. This author thus distinguishes among a pure fiscal crisis (Greece and Portugal), a banking solvency crisis (Ireland and Spain) and a latent (sovereign debt-derived) banking solvency crisis (France and Germany).
18 A given country’s current sovereign debt position essentially depends on two main variables, namely past budget balances and
interest rates (apart from the economic growth rate); the existence of overall fiscal sustainability is thus assessed by different combinations involving these two variables, originating the diversity of fiscal trajectories which are captured in our findings, and which are reflected in the thresholds we obtain.
19 As opposed to the aggregate Euro-wide common threshold herein estimated that provides an average threshold that might not
unsustainable trajectory – leading to growth drag -, a problem that should be clearly addressed by policy makers.
The Euro Area as a whole exhibits a 19.66 per cent deviation from its optimal threshold point. The country-specific results show variability which is not visible in the aggregate results for the Euro Area, thus highlighting the relevance of our adopted research approach.
Our findings suggest that a critical point has already been reached in several Euro Area countries which should prompt some sort of corrective fiscal measures. Although this does not take into account the relative weights of the different economies, it seems to us interesting to mention that, according to our results, 13 out of the 19 Euro Zone countries have already gone beyond the respective optimal threshold. These countries will probably find themselves in a fragile position if and when a crisis occurs that requires extra government action and borrowing to fund that action. In fact, we are already in such a situation due to the current pandemic economic crisis.
5. CONCLUDING REMARKS
This article answers a most fundamental question pertaining to the Eurozone sovereign debt crisis. This question addresses whether the public debt fiscal instrument has been overused in the aftermath of the Global Financial Crisis20.
Public debt thresholds representing the maximum level of leverage public debt lends to GDP were estimated for each Member State (and for the Euro Area as a whole). Excessive accumulation of public debt beyond the threshold is associated with declining GDP levels for the corresponding Member States.
Our approach is theoretically supported by the dynamics of the sovereign debt Laffer curve, a concept previously proposed in the literature by Krugman (1988) and Sachs (1990).
We used country-specific data instead of aggregate macro-regional data and then performed the following steps. First, quadratic equations depicting the relationship between sovereign debt and GDP were estimated for each Eurozone country. Second, sovereign debt thresholds were computed as the maximum point beyond which further increases in public debt harm output. Estimated thresholds range from 8.250021 per cent (Estonia) to 104.910658 per cent (Belgium), thus indicating a high degree of heterogeneity at a country-specific level which did not come to the surface in previous macro-regional research. Third, deviations from these debt thresholds were computed and suggest that many Euro Area Member States have already surpassed their optimal thresholds, highlighting the transversal excessive use of the public debt instrument in the aftermath of the GFC. This suggests that excessive Euro Area sovereign debt trajectories might need to be adequately curtailed.
Further research should contemplate: (i) assessing the impact of excessive public debt on long-term GDP; (ii) accounting for the root causes of the Euro Area threshold heterogeneity across countries; (iii) the optimal design of a common and centripetal European fiscal framework aimed at reducing/diluting future idiosyncratic sovereign policy uncertainty. Moreover, for research purposes, it would be useful to promote the publication of intra-annual (e.g., half-yearly or quarterly) time series for public debt since the adoption of the Euro. For example, recently existing quarterly data on public debt do not encompass the whole period since the adoption of the Euro. This dataset would be quite valuable for public debt
20 It should be noted that the economic events herein portrayed are still unfolding, as the recent fiscal policy debate around
COVID-19 demonstrates. This fact conditions the underlying research efforts and denies the benefits traditionally associated with the adoption of a more balanced historical perspective, especially in view of the limited dataset available since the birth of the common currency.
threshold estimation, by allowing for a greater number of observations, leading to greater knowledge about thresholds that might be useful for public debt policy formulation.
There are a number of limitations to the approach adopted in this article: (i) our quadratic estimations are focused on the role of public debt as the explanatory variable, thus not taking into account the possible role of other variables; (ii) higher frequency data points (e.g., half-yearly or quarterly data on public debt) are not available since the beginning of the Euro, something which forced us to use annual data; and (iii) our estimations are data-sensitive because of the relatively small number of data points we used.
A novel and more efficient common fiscal framework might ultimately avoid the exposure of the Euro Area (and its individual constituents) to less economic growth in the aftermath of systemic financial episodes and the negative impact of distortionary channels on GDP (Kumar & Woo, 2010). Ultimately, these instruments should help dilute heterogeneous Member States’ frailties in the aftermath of systemic financial shocks, making them - individually and collectively - more resilient to these shocks under a solid common fiscal architecture. This novel fiscal framework, along with the centripetal monetary policy already in place, would hopefully ensure the much needed stability and cohesion of the European economy.
REFERENCES
Acharya, V., Drechsler, I., & Schnabl, P. (2014). A Pyrrhic Victory? Bank Bailouts and Sovereign Credit Risk. The
Journal of Finance, 69(6), 2689–2739. https://doi.org/10.1111/jofi.12206
Allen, F., & Carletti, E. (2006). Credit Risk Transfer and Contagion. Journal of Monetary Economics, 53(1), 89–111.
https://doi.org/10.1016/j.jmoneco.2005.10.004
Attinasi, M.-G., Checherita, C., & Nickel, C. (2009). What Explains the Surge in Euro Area Sovereign Spreads During the Financial Crisis of 2007–2009. European Central Bank, Working Paper Series, Working Paper 1131.
Barrios, S., Iversen, P., Lewandowska, M., & Setzer, R. (2009). Determinants of intra-euro area government bond spreads during the financial crisis. European Commission, Directorate-General for Economic and Financial Affairs, Economic Paper 388.
Baum A., Checherita-Westphal, C., & Rother, P. (2013). Debt and growth: New evidence for the euro area. Journal of
International Money and Finance, 32, 809–821. https://doi.org/10.1016/j.jimonfin.2012.07.004
Caner, M., Grennes, T., & Koehler-Geib, F. (2010). Finding the Tipping Point – When Sovereign Debt Turns Bad. World Bank, Economic Policy Sector, Policy Research Working Paper 539.
Cecchetti, S.G., Mohanty, M.S., & Zampolli, F. (2011). The Real Effects of Debt. Bank of International Settlements Working Paper Nº 352.
Checherita-Westphal, C., & Rother, P. (2012). The impact of high government debt on economic growth and its channels: An empirical investigation for the euro area. European Economic Review, 56(7), 1392–1405.
https://doi.org/10.1016/j.euroecorev.2012.06.007
Chudik, A., Mohaddes, K., & Pesaran, M.H. (2017). Is there a debt-threshold effect on output growth? The Review of
Economics and Statistics (MIT Press), 99(1), 135-150.
Correia, L., & Martins, P. (2019). The European crisis: Analysis of the macroeconomic imbalances in the rescued euro area countries. Journal of International Studies, 12(2), 22-45. https://doi.org/10.14254/2071-8330.2019/12-2/2
De Grauwe, P., & Ji, Y. (2013). From Panic-Driven Austerity to Symmetric Macroeconomic Policies in the Eurozone. Journal of Common Market Studies, 51(Annual Review), 31-41. https://doi.org/10.1111/jcms.12042 Eberhardt, M., & Presbitero, A.F. (2015). Public debt and growth: heterogeneity and non-linearity. Journal of
International Economics, 97(1), 45-58. http://dx.doi.org/10.1016/j.jinteco.2015.04.005
Égert, B., 2015. The 90% public debt threshold: the rise and fall of a stylized fact. Applied Economics, 47(34–35), 3756–3770. https://doi.org/10.1080/00036846.2015.1021463
Ejsing, J. W., & Lemke, W. (2009). The Janus-Headed Salvation: Sovereign and Bank Credit Risk Premia During 2008–2009. European Central Bank, Working Paper Series, Working Paper 1127.
European Council (2012). Treaty on Stability, Coordination and Governance in The Economic And Monetary Union.
Gogas, P., Plakandaras, V., & Papadimitriou, T. (2014). Public debt and private consumption in OECD countries.
The Journal of Economic Asymmetries, 11(2014), 1–7. http://dx.doi.org/10.1016/j.jeca.2014.03.001
Gujarati, D. N. (2003). Basic Econometrics (Fourth edition). United States: McGraw-Hill Higher Education.
Hellwig, M. (2011). Quo Vadis, Euroland? European Monetary Union between Crisis and Reform. In F. Allen, E. Carletti, & G. Corsetti (Eds.), Life in the Eurozone With or Without Sovereign Default? (pp. 59–76). Philadelphia: FIC Press and Wharton Financial Institutions Center.
Insukindro (2018). The Effect of Twin Shock on Fiscal Sustainability in Indonesia. Economics and Sociology, 11(1), 75-84. https://doi.org/10.14254/2071-789X.2018/11-1/5
Krugman, P. (1988). Financing vs. Forgiving a Debt Overhang. National Bureau of Economic Research (NBER), Working Paper 2486.
Kumar, M. S., & Woo, J. (2010). Public Debt and Growth. International Monetary Fund, Working Paper WP/10/174.
Kusairi, S., Maulina, V., & Margaretha, F. (2019). Public debt and private consumption in Asia Pacific countries: Is there evidence for Ricardian equivalence? Journal of International Studies, 12(1), 50-64.
https://doi.org/10.14254/2071-8330.2019/12-1/3
Petrovic, A., & Tutsch, R. (2009). National Rescue Measures In Response To The Current Financial Crisis. European Central Bank, Legal Working Paper Series, Working Paper No 8.
Ramos-Herrera, M. C., & Sosvilla-Rivero, S. (2017). An empirical characterization of the effects of public debt on economic growth. Applied Economics, 49(35), 3495–3508. https://doi.org/10.1080/00036846.2016.1262522 Reinhart, C.M., & Rogoff, K.S. (2010). Growth in a Time of Debt. American Economic Review, 100(2), 573-578.
https://doi.org/10.1257/aer.100.2.573
Sachs, J. (1990). A Strategy for Efficient Debt Reduction. The Journal of Economic Perspectives, 4(1), 19-29.
Tung, L. T. (2020). Can public debt harm social development? Evidence from the Asian-Pacific region. Journal of
International Studies, 13(2), 48-61. https://doi.org/10.14254/2071-8330.2020/13-2/4
Whelan, K. (2011). Ireland’s Sovereign Debt Crisis. In F. Allen, E. Carletti, & G. Corsetti (Eds.). Life in the Eurozone
With or Without Sovereign Default? (pp. 41-58). Philadelphia: FIC Press and Wharton Financial Institutions
α i (t-ratio) [p-value] β i (t-ratio) [p-value] γ i (t-ratio) [p-value] 1st and\or 2nd order autoregressive residual component coefficient (whenever applicable)
AUSTRIA without constant 2.511079 (64.66597) [0.0000] -0.005153 -30.02708 [0.0000] not applicable 90.4863% 89.8068% 13943.92 [0.0000] 3.162830 [0.205684] 1.193498 2 Do not reject H0 [0.0672] Do not reject H0 [0.2867]
Adopt quadratic spec. 0.0017
BELGIUM without constant 1.906384 (11.46194) [0.0000] -0.002421 --6.157607 [0.0000] AR(1): 0.767798 (5.008851) [0.0003] 92.8233%
91.6272% n\a [0.324349]2.251872 1.653486 Do not reject H0[0.2002]
Do not reject H0 [0.6087]
Adopt quadratic spec. 0.0145
CYPRUS without constant 2.933960 (44.92085) [0.0000] -0.108640 (-23.57146) [0.0000] not applicable 78.9941% 77.4937% 2840.78 [0.0000] 0.688944 [0.708595] 0.921158 2 Do not reject H0 [0.0567] Do not reject H0 [0.7613]
Adopt quadratic spec. 0.0000 ESTONIA 3 7.722378 (3.336534) [0.0054] 13.60086 (2.469100) [0.0282] -4.685525 (-1.994806) [0.0675] not applicable 59.5936%53.3772% 9.586557 [0.002766] 0.972915
[0.614801] 0.691776 New ey-West Consistent Standard Errors & Covariance
Do not reject H0 [0.5101]
Adopt quadratic spec. 0.0383 FINLAND 4 285.1712 (2.758704) [0.0173] -0.563602 (-1.810587) [0.0953] not applicable AR(1): 0.925356 (11.37064) [0.0000] 85.0816% 82.5952% 32.21885 [0.000011] 5.991336 [0.050003] 2.201244 Do not reject H0[0.0873] Do not reject H0 [0.2522]
Adopt linear spec. 0.0529 FRANCE 1008.423 (7.035088) [0.0000] 1.151976 (5.373734) [0.0001] -0.000318 (-4.242310) [0.0010] not applicable 90.8375% 89.4279% 64.44171 [0.000000] 0.162993 [0.921736] 1.156146 5 Do not reject H0 [0.0589] Do not reject H0 [0.0759]
Adopt quadratic spec. 0.001 GERMANY 1920.355 (35.33314) [0.0000] 0.354000 (11.80062) [0.0000]
not applicable not applicable 82.7701% 81.5394%
67.25429 [0.000001]
0.994898 [0.608080] 1.304192
New ey-West Consistent Standard Errors & Covariance
Do not reject H0 [0.0836]
Adopt linear spec. 0.4223
GREECE without constant 1.954607 (32.17620) [0.0000] -0.004030 (-14.48165) [0.0000]
not applicable 52.5068%49.1144% n\a [0.527781]1.278149 0.716896 Standard Errors & Covariance New ey-West Consistent 6
New ey-West Consistent
Standard Errors & Covariance 6
Adopt quadratic spec. 0.0025 IRELAND 4 146.1305 (11.91838) [0.0000] 0.132153 (2.027441) [0.0621]
not applicable not applicable 25.4728%20.1494% 4.785085 [0.046170]
0.087785
[0.957057] 0.247925 New ey-West Consistent Standard Errors & Covariance
Do not reject H0 [0.1446]
Adopt linear spec. 0.2670
ITALY without constant 1.948587 (73.76503) [0.0000] -0.000578 (-38.42379) [0.0000] not applicable 71.2724%69.2204% 26541.47 [0.0000] 0.779200 [0.677328] 1.321246 Do not reject H0[0.3224] Do not reject H0
[0.6005] Adopt quadratic spec. 7
LATVIA 3 11.90024 (5.215376) [0.0002] 3.367173 (2.426272) [0.0375] -0.277281 (-2.062445) [0.0597] not applicable 52.2611%44.9166% 7.1157726 [0.008178] 1.317872
(0.517402) 0.631116 New ey-West Consistent Standard Errors & Covariance
Do not reject H0 [0.7959]
Adopt quadratic spec. 0.0462 LITHUANIA 20.65927 (6.895747) [0.0000] 0.842459 (3.556586) [0.0032]
not applicable not applicable 49.3480% 45.7300%
13.63956 [0.002410]
0.833915 [0.659049] 0.364717
New ey-West Consistent Standard Errors & Covariance
Do not reject H0 [0.1681]
Adopt linear spec. 0.1157 LUXEMBOURG 31.34201 (17.98993) [0.0000] 1.057482 (5.310399) [0.0001]
not applicable not applicable 70.7423% 68.6524%
33.85058 [0.000045]
0.223489 [0.894273] 0.393107
New ey-West Consistent Standard Errors & Covariance
Do not reject H0 [0.2732]
Adopt linear spec. 0.0640 MALTA 3.614441 (22.50510) [0.0000] 0.675211 (16.44066) [0.0000]
not applicable not applicable 95.0755% 94.7238% 270.2952 [0.000000] 2.206445 [0.331800] 1.214960 Do not reject H0 [0.3022] Do not reject H0 [0.2208]
Adopt linear spec. 0.4280
NETHERLANDS without constant
3.438878 (50.44364) [0.0000] -0.004579 (-24.35840) [0.0000] not applicable 76.1864% 74.4855% 7550.85 [0.0000] 2.713391 [0.257510] 1.125344 2 Do not reject H0 [0.0892] Do not reject H0 [0.3913]
Adopt quadratic spec. 0.0103 PORTUGAL 133.8452 (29.67343) [0.0000] 0.622800 (8.775875) [0.0000] -0.002088 (-8.555781) [0.0000] not applicable 85.6776%83.4742% 38.88355 [0.000003] 1.084916 [0.581318] 1.921828 Do not reject H0[0.1418] Do not reject H0 [0.0806]
Adopt quadratic spec. 0.0000
SLOVAKIA without constant 4.022182 (8.222427) [0.0000] -0.057023 (-5.097462) [0.0003] AR(1): 0.754806 (2.923938) [0.0127] 88.8804% 87.0271% n\a 0.598319 [0.741441] 1.294975 2 Do not reject H0 [0.3894] White Consistent
Standard Errors & Covariance Adopt quadratic spec. 0.0102
SLOVENIA 23.88328 (7.755940) [0.0000] 1.401760 (3.200036) [0.0070] -0.034971 (-2.842469) [0.0139] not applicable 55.7143%48.9011% 8.177410 [0.005020] 3.568866
[0.167892] 0.693958 New ey-West Consistent Standard Errors & Covariance
Do not reject H0 [0.8129]
Adopt quadratic spec. 0.0141
SPAIN without constant 3.364242 (24.16551) [0.0000] -0.002327 (-11.91319) [0.0000] AR(1): 1.367267 (4.383607) [0.0014] AR(2): -0.812207 (-2.480344) [0.0325] 59.8860% 47.8518% [0.000000] 0.528878 [0.767637] 2.104996 Do not reject H0 [0.3924] White Consistent
Standard Errors & Covariance 4 Adopt quadratic spec.
8 0.0828
EURO AREA without constant
2.531705 (84.02354) [0.0000] -0.000162 (-38.60577) [0.0000] not applicable 83.5007%82.3222% 14647.32 [0.0000] 0.741720 [0.690141] 1.152930 2 Newey-West Consistent
Standard Errors & Covariance
Do not reject H0 [0.2811]
Adopt quadratic spec. 0.0004
COUNTRIES
COEFFICIENTS OF QUADRATIC SPECIFICATION GOODNESS-OF-FIT R-SQUARED ADJUSTED R-SQUARED F-Statistic 1 [p-value] (whenever available) Residuals JB Statistic [p-value] DW Statistic Breusch–Godfrey Serial Correlation LM Test
up to 2 lengths YES\NO [p-value F(.)] White's Heteroskedasticity Test YES\NO [p-value F(.)]
TABLE 1 - QUADRATIC ESTIMATION FOR EURO AREA MEMBER STATES AND EURO AREA
RAMSEY RESET TEST (Linear → Quadratic)
Decision [p-value F(.)]