Palavras chave: Modelos espaciais Estatística descritiva Conservação do solo Sustentabilidade Histórico: Recebido 31/03/2016
Aceito 22/09/2016 Keywords: Spatial models Descriptive statistics Soil conservation Sustainability
1 Universidade Federal Rural do Rio de Janeiro - Seropédica, Rio de Janeiro, Brasil +Correspondência:
DOI: 10.1590/01047760201622042159
Camila Santos da Silva
1, Marcos Gervasio Pereira
1+, Rafael Coll Delgado
1, Eduardo Vinícius
da Silva
1SPATIALIZATION OF SOIL CHEMICAL AND PHYSICAL ATTRIBUTES IN AN
AGROFORESTRY SYSTEM, SEROPÉDICA, BRAZIL
ABSTRACT:
The purpose of this study was to spatialize the chemical and physical
attributes of the soil in an agroforestry system in Seropédica, Rio de Janeiro, Brazil.
Thirty-one soil samples were collected from 0–10 cm, 10–20 cm, and 20–40 cm depths, and each
sampling point was georeferenced. The pH (in H
2O), potential acidity (H+Al), calcium
(Ca
+2), magnesium (Mg
+2), aluminum (Al
+3), sodium (Na
+), potassium (K
+), phosphorus
(P), organic carbon (C), cation exchange capacity of the soil (T value), base saturation (V
value), total clay, total sand, silt, and density of fine roots were measured. The software
ArcGIS 10.2 was used to perform the semivariogram analysis and the fitting of the models,
and spatial interpolation was performed using a first-order trend ordinary kriging process
with spherical, exponential, and Gaussian spatial models. Based on the results, only the
exponential and Gaussian models were fitted to the variables, except for the Mg
2+and V
value variables, which presented no spatial dependence, thus showing a pure nugget effect
(PNE). Distribution maps were generated for the variables (except for those exhibiting
PNE), which showed correlation between the variables pH and Al
3+, organic carbon and
cations, phosphorus and total clay, and silt and sand. Overall, geostatistics could be applied
to spatialize the chemical and physical attributes of the soil in the agroforestry system,
except in the case of Mg
2+and the V value.
ESPACIALIZAÇÃO DOS ATRIBUTOS QUÍMICOS E FÍSICOS DO SOLO EM UM
SISTEMA AGROFLORESTAL, SEROPÉDICA, BRASIL
RESUMO:
Neste trabalho, objetivou-se espacializar os atributos químicos e físicos do
solo em um sistema agroflorestal no município de Seropédica, Rio de Janeiro. Foram
coletadas 31 amostras de terra, nas profundidades de 0-10 cm, 10-20 cm e 20-40 cm,
sendo cada ponto de coleta georreferenciado. Foram determinados pH (em H
2O), acidez
potencial (H+Al), cálcio (Ca
2+), magnésio (Mg
2+), alumínio (Al
3+), sódio (Na
+), potássio
(K
+), fósforo (P), carbono orgânico (C), capacidade de troca catiônica do solo (Valor T),
saturação por bases (Valor V), argila total, areia total, silte e densidade de raízes finas.
O software ArcGIS 10.2 foi utilizado para fazer a análise semivariográfica e o ajuste dos
modelos, e posteriormente, foi empregado a interpolação espacial através da Krigagem
Ordinária de primeira ordem de três modelos espaciais, esférico, exponencial e gaussiano.
De acordo com os resultados, apenas os modelos exponencial e gaussiano foram
ajustados para as variáveis, exceto para as variáveis Mg
2+e Valor V, pois não apresentaram
dependência espacial, assim expressando efeito pepita puro (EPP). Foram gerados os
mapas de distribuição para as variáveis (exceto para aquelas que exibiram EPP), onde
ocorreu uma correlação entre as variáveis pH e Al
3+, carbono orgânico e cátions, fósforo
e argila total, e silte e areia. A geoestatística pode ser aplicada para espacializar os atributos
AGROFORESTRY SYSTEM, SEROPÉDICA, BRAZIL
INTRODUCTION
Agroforestry systems (AFSs) are a sustainable form
of production and are recommended as an alternative
system for family farms (LIMA et al., 2011). They are also
an effective way to promote soil conservation, as they
restore degraded areas, protect soils and water basins,
increase carbon sequestration, improve the climate, and
increase biodiversity (MÉIER et al., 2011).
Owing to the various vegetation strata that
can form from the species in the AFS, there may be
management difficulties due to the complexity of
providing light, water, and nutrients for all species
(DONATO; LIMA, 2013). Thus, it is essential to
determine how management practices may interfere
with nutrient availability. Nutrient concentrations can be
quantified in order to simulate the results of these factors
in these production systems (LIMA et al., 2011).
In order to increase productivity by using different
fertilizers, and soil and crop management practices,
a careful analysis of the variability of soil attributes
is needed so that management alternatives can be
recommended to reduce the effects of the variability on
crop production (DALCHIAVON et al., 2012).
Geostatistical studies, with the objective of
understanding spatial variability of soil attributes, have
recently been gaining prominence and importance in
Brazil (BOTTEGA et al., 2013; ZONTA et al., 2014).
This tool has been widely used in soil science and other
sciences to characterize and analyze the spatial variation
of characteristics (BOTTEGA et al., 2013; GOIS et al.,
2015), and enables the production of maps through
kriging (DALCHIAVON et al., 2012).
Currently, there are no geostatistical studies on
the spatialization of soil attributes in the agroforestry
system of the Integrated Agroecological Production
System, and this knowledge could help optimize the
system’s labor and management requirements. Thus, the
purpose of this study was to spatialize the chemical and
physical attributes of the soil in an agroforestry system in
Seropédica, Rio de Janeiro, Brazil.
MATERIAL AND METHODS
Area of Study
The study was performed in an AFS of
approximately 3,397 m
2, located in the Integrated
Agroecological Production System (SIPA), also known
as the Km 47 Agroecological Farm, on the Embrapa
Agrobiology grounds in Seropédica, Rio de Janeiro,
Brazil (Figure 1).
The climate of the region is Aw (Köppen
classification), with rains concentrated between November
and March, an annual average precipitation of 1,213 mm,
and an average annual temperature of 23.9°C (CARVALHO
et al., 2011). The maximum and minimum altitude of the
AFS is 41.0 m and 26.3 m, respectively. The land relief is
predominantly soft-wavy (< 5% declivity), and the soil is
classified as Haplic Planosol (SANTOS et al., 2013).
The area had monocultures of
Musa sapientum
L. and
Carica papaya
L. before the AFS is implemented,
which were fertilized only with cattle manure.
The agroforestry system implementation started
in 2000 with a multilayered arrangement. Species such
as açaí (
Euterpe oleracea
Mart.), cupuaçu (
Theobroma
grandiflorum
), grumixama (
Eugenia brasiliensis
Lam.),
citrus (
Citrus
sp.) and guapuruvu (
Schizolobium parahyba
(Jacq.) Walp.) were planted along with cabbage and
forage peanut crops, the latter as green manure. Some
species that previously existed on the site were used,
such as the flamboyant (
Delonin regia
Bojer ex Hook.),
due to its beauty in the landscape.
New species, such as gliricidia (
Gliricidia sepium
(Jacq.) Walp.), jaca (
Artocarpus beterophyllus
Lam.),
carrapeta (
Guarea Guidonia
(L.) Sleumer), tucandeiro
(
Citharexylum myrianthum
Cham.) and some species of
the Arecaceae family were planted from 2002 to 2008.
The most intense management was carried out in
the first two years, with the aforementioned plantings;
pruning; mowing; manuring; harvesting and weeding.
After the first eight years, there are no reports of
management practices used in the area.
Sampling and Georeferencing
The area was divided into 10 × 10 m (100 m
2)
plots in which 31 sampling units were installed. Soil samples
FIGURE 1 Location of the agroforestry system, in the
were collected from the center of each plot at the depths
of 0–10 cm, 10–20 cm, and 20–40 cm using of a probe that
was 4.5 cm in diameter and 130 cm in length.
The soil samples were taken to the laboratory,
dried in the shade, and then crushed and screened
through a 2-mm sieve, thus obtaining air-dried fine earth
(ADFE) that was used to perform the analyses.
After the soil collections, each point was
georeferenced with a Promark 2 geodetic GPS device.
Analyses of the Chemical and Physical Attributes
The ADFE samples were used to evaluate the
chemical and physical attributes of the soil, namely:
pH (in H
2O), potential acidity (H+Al), calcium (Ca
+2),
magnesium (Mg
+2), aluminum (Al
+3), sodium (Na
+),
potassium (K
+), phosphorus (P), organic carbon (C),
cation exchange capacity of the soil (T value), and base
saturation for the chemical attributes (V value). For the
physical attributes, a particle size analysis was performed,
and the values of total clay (g.
kg
-1), total sand (g.
kg
-1), and
silt (g.
kg
-1) were quantified. All laboratory procedures
followed the protocols established by Embrapa (1997).
Determination of Fine Root Density
The ADFE was obtained with a digital caliper ruler
and the roots with a maximum diameter of 2 mm were
separated, and weighed and placed in an oven at 65°C for
three days. After the fine roots were dry, they were again
weighed to obtain the dry biomass. The density of the fine
roots (g.cm
-3) was calculated for each sample, based on
the ratio between the dry weight of the fine roots and the
volume of the probe. The sum of the roots with density of
up to 40 cm depth were considered for the analysis.
Geostatistical Analysis
The data obtained in the analyses of the chemical
and physical attributes of the soil, and the density of
the fine roots, were entered into Microsoft Excel 2013
spreadsheets, and the weighted averages were calculated
for each plot based on the thickness of the soil layer
collected. Next, geographic coordinates were associated
with each sample, enabling data spatialization.
The software program ArcGIS 10.2 was used
for the spatialization and preparation of the variable
distribution maps, and a first-order trend ordinary kriging
process was used as the spatial interpolation method.
Three transitive theoretical models (exponential,
spherical, and Gaussian) were fitted to the variables, in order
to verify which model best represented the distribution of
the variables studied, based on the equations and the three
physical models presented by Gois et al. (2015).
Semivariogram model fitting was conducted for
the analysis of the models, using the degree of spatial
dependence (DSD%) for choosing the best model.
The DSD used in this study was based on the
method proposed by Cambardella et al. (1994), where:
DSD values ≤ 25% suggest data with strong spatial
dependence; between 25% and 75%, moderate
spatial dependence; ≥ 75%, weak spatial dependence;
and for a DSD equal to 100%, the variable is spatially
independent—the semivariogram shows a pure nugget
effect (PNE). The DSD was calculated using equation 1,
where DSD is the degree of spatial dependence, C
0is the
nugget effect, and C
0+ C is the baseline.
0
0
C
DSD 100
C C
= ´
+
[1]
Statistical Analysis
Statistical analysis was applied to the AFS in order
to assess the performance of the transitive theoretical
models based on the following parameters presented by
Vieira (2011) and Gois et al. (2015): root-mean-square
error (RMSE), index of agreement (d), standard error of
the estimate (SEE), Pearson correlation coefficient (r),
and coefficient of determination (r
2), as shown in [2], [3],
[4], [5] and in which O
iis equal to the observed values,
P
iis equal to the predicted values,
Ois the average of
the observed values,
Pis the average of the predicted
values, and n is equal to the number of data analyzed.
( )
n 2
i i
i 1O P
RMSE
n
=
-=
å
[2]
( ) ( ) n 2 i i i 1 2 i i P O d 1
P O O O = = -- + -å å
[3]
( ) n 2 i i i 1O P SEE n 2 = -=-å
[4]
( ) ( ) ( ) ( ) n i i i 1 2 2 n n i ii 1 i 1
P P O O r
P P O O
= = = - ´ -= - ´ -å
å å
[5]
( ) ( ) ( ) ( ) 2 n i i i 1 2 2 2 n n i i
i 1 i 1
P P O O
r
P P O O
=
= =
æ ö÷
ç ÷
ç - ´ - ÷
ç ÷
ç
=çç ÷÷÷÷
ç - ´ - ÷
ç ÷
çè ø
å
å å
[6]
RESULTS AND DISCUSSION
Semivariogram
The exponential and Gaussian models were
AGROFORESTRY SYSTEM, SEROPÉDICA, BRAZIL
In other words, their semivariograms exhibited a pure
nugget effect (PNE). The variables Na
+, C, total clay, silt,
and density of fine roots showed strong DSD, while the
variables pH, H+Al, Ca
2+, Al
3+, K
+, P, total sand, and T
value showed moderate DSD.
According to Cambardella et al. (1994), the
PNE indicates that the variability was not explained or
the variation was not detected, which may occur due
to measurement or sampling errors, or undetected
microvariation. The sample spacing was probably
another factor that influenced this result, due to the
distances between the sampling points, once this distance
may have been overestimated, contributing to the
non-expression of spatial dependence.
Using precision agriculture to establish
management strategies in Boa Vista das Missões in Rio
Grande do Sul, Cherubin et al. (2011) found results that
differed from those observed in this study. The authors
noted that spatial dependence was moderate for the
V value (%) and strong for Mg
2+, and the exponential
model was fitted to both attributes. The saturation by
aluminum (m%) variable and Al
3+showed a PNE.
In Nossa Senhora do Livramento (Mato Grosso,
Brazil), geostatistics were used to characterize the
spatial variability of the chemical attributes of the soil in a
population of
Tectona grandis
over two evaluation periods
(PELISSARI et al. 2014). Their results differed from the
results of this current study, specifically: the Gaussian and
exponential models were fitted to the variable pH; the
spherical and Gaussian models were fitted to Ca
+, Mg
2+,
and Al
3+; and the spherical model for the second and
ninth year of cultivation was fitted to K
+.
In Angatuba, São Paulo, Vieira et al. (2011) studied
the spatial variability of the physical and chemical attributes
of two Latosols in a no-tillage system and their relationship
with the stability of the aggregates. Similar to this current
study, they noted that the fitted exponential model was
the model that best fit the clay physical attribute, with a
degree of spatial dependence of 29.80%. On the other
hand, the spherical model was fitted to the total sand
variable for Angatuba and Campos Novos Paulista.
Using geostatistical methods to study the variability
of the particle size fractions of soil in Fortaleza, Cajazeira
and Assis Júnior (2011) noted that the spherical model was
the model that best fitted to the analysis of
the sand, silt,
and clay attributes at the depths of 0–20 cm and 20–40 cm.
Statistical Analysis
According to the statistical analysis of the soil
attributes (Table 2), the index of agreement (d) was lower
for Mg
2+(0.33) and V value (0.44), and higher for the T
value (0.78) and Na
+(0.74), than for the other variables.
The Pearson correlation coefficient (r) was lower
for the V value (-0.18) and Mg
2+(-0.21) than for the
other variables, and indicated a negative correlation
between the real and predicted values. This parameter
(r) was closer to 1 for Na
+(0.85) and total clay (0.60)
than for the other variables, indicating that there was a
strong positive correlation between the observed and
estimated values for these variables.
Similarly, Vieira et al. (2011) studied the spatial
variability of the physical and chemical attributes of two
Latosols (São Paulo) and noted that the r parameter
was low for Mg
2+— (0.1583 and 0.3550 for the cities of
Angatuba and Campos Novos Paulista, respectively) —
and that the values for the textural attributes of the soil
(total clay and sand) were high.
The coefficient of determination (r²) ranged
between 0.03 and 0.72, where the lowest value
corresponded to the V value and the highest to Na
+.
This result indicates that the closer this parameter is
to one, the higher the correlation between the found
and estimated data. These results differed from those
TABLE 1 Parameters of semivariance models for soil variables,
in the Integrated Agroecological Production System in Seropédica, Rio de Janeiro, Brazil.
Variable Model C0(1) C0 + C(2) DSD (3)
(%) Class
pH Exp(4) 0.21 0.37 56.26 Moderate
H+Al
(cmolc.dm-3) Exp 0.60 1.46 41.46 Moderate
Ca2+
(cmolc.dm-3) Exp 1.08 2.54 42.72 Moderate
Mg2+
(cmolc.dm-3) PNE
(5) 0.37 0.37 100.00 PNE
Al3+
(cmolc.dm-3) Exp 0.02 0.03 58.80 Moderate
Na+
(cmolc.dm-3) Gau
(6) 0.00 0.01 6.27 Strong
K+
(cmolc.dm-3) Gau 0.00 0.00 52.49 Moderate
P
(mg.dm-3) Exp 504.18 1752.88 28.76 Moderate
C (g.kg-1) Gau 81.14 409.17 19.83 Strong
Total clay
(g.kg-1) Exp 858.92 4708.22 18.24 Strong
Total sand
(g.kg-1) Exp 4852.60 13004.30 37.32 Moderate
Silt
(g.kg-1) Gau 3679.60 16978.60 21.67 Strong
Density of fine roots
(g.dm-3) Exp 0.00 0.00 25.30 Strong
T value
(cmolc.dm-3) Gau 1.69 4.59 36.79 Moderate
V value
(%) PNE 125.65 125.65 100.00 PNE
(1)nugget effect; (2) baseline; (3) degree of spatial dependence;(4) exponential; (5)
obtained by Zucoloto et al. (2011), who used classical
statistics and geostatistics to evaluate the correlation
and spatial variability of soil chemical attributes, and
the production of dwarf lady finger bananas in Espírito
Santo. They found a higher value, close to 0.92, for the
coefficient of determination for the V value.
The SEE exhibited high variation among the
variables studied, where the lowest error of 0 g.cm
-3was
observed for the density of fine roots; no error occurred
between the observed and estimated data. On the other
hand, the highest SEE, 46.92 g
.
kg
-1, was noted for total
sand, indicating a greater error between the real and
predicted data.
All variables showed low values of Root Mean
Square Error (RMSE), demonstrating the quality of the
fitting of the models, as described by Martins et al. (2014).
In their study in Piracicaba, they noted the potential
of using hyperspectral data, originating from samples
from the field and oven-dried fine earth conditions, to
determine certain chemical and physical attributes of
soil that had been subjected to different applications of
vinasse doses.
Spatial distribution
Based on the statistical parameters, spatial
distribution maps of the chemical and physical attributes
of the soil were generated (Figures 2 and 3), except for
PNE variables, Mg
2+and V value.
An analysis of Figures 2A and 2D revealed that
there was a negative correlation between pH and Al
3+,
with the areas with the lowest pH having the highest
concentrations of aluminum. According to Sousa et
al. (2007), the pH decreases with the increase of Al
3+ions in the soil solution, affecting the availability of some
nutrients to plants and the activity of microorganisms.
In the areas with the highest concentrations of
organic carbon (Figure 2H) the highest values of Ca
2+,
Na
+, and K
+(Figures 2C, 2E, and 2F) were also found
and, consequently, a higher T value (Figure 3E). According
to a study performed by Artur et al. (2014) in Chapada
do Apodi, Ceará, Brazil, this correlation between carbon
content and concentration of positive ions is related
to the high capacity of cation retention by the organic
matter due to the increase of negative charges, which
contribute to the nutrient retention.
TABLE 2 Statistical analysis of the soil chemical and physical
attributes in the agroforestry system of the Integrated Agroecological Production System.
Variable d(1) r(2) r²(3) SEE(4) RMSE(5)
pH 0.61 0.36 0.13 0.22 0.93
H+Al (cmolc.dm-3)
0.63 0.41 0.17 0.53 0.98
Ca2+
(cmolc.dm-3)
0.61 0.21 0.05 0.63 1.07
Mg2+
(cmolc.dm-3)
0.33 -0.21 0.04 0.12 1.01
Al3+
(cmolc.dm-3)
0.64 0.33 0.11 0.07 0.95
Na+
(cmolc.dm-3)
0.74 0.85 0.72 0.03 1.16
K+
(cmolc.dm-3)
0.68 0.46 0.21 0.03 0.98
P (mg.dm-3)
0.64 0.31 0.10 20.20 1.03
C (g.kg-1)
0.59 0.31 0.10 6.18 1.22
Total clay (g.kg-1)
0.65 0.60 0.36 26.62 0.94
Total sand (g.kg-1)
0.59 0.43 0.18 46.92 1.00
Silt (g.kg-1)
0.58 0.41 0.16 42.08 1.15
Density of fine roots
(g.dm-3)
0.64 0.32 0.10 0.00 1.07
T value (cmolc.dm-3)
0.78 0.54 0.29 1.10 1.04
V value (%)
0.44 -0.18 0.03 2.21 1.00
(1) index of agreement; (2) Pearson correlation coefficient; (3) coefficient of determination; (4) standard error of the estimate; (5) root-mean-square error.
FIGURE 2 Spatial distribution maps of pH (A), H+Al (B),
AGROFORESTRY SYSTEM, SEROPÉDICA, BRAZIL
The results of the present work, in which the
regions with higher carbon contents were the ones
with the AFS of lower altitudes, may be related to the
type of soil (Planosol), since it presents sandy texture
in the surface, abruptly changing to a clayey texture
in the subsurface, where it is compact and almost
impermeable (SOUSA et al., 2013), thus compromising
the decomposition of soil organic matter.
The previous results are corroborated by those
obtained by Ebeling et al. (2011), Briedis et al. (2012),
and Matias et al. (2015), who found a positive correlation
between organic carbon (or organic material) and the
cation exchange capacity (CEC), where carbon is the
main contributor to the increase in the CEC and the
increase in nutrient adsorption.
An analysis of Figure 2G showed that the regions
with higher concentrations of P are those that showed
lower quantities of total clay (Figure 3A) and the highest
quantities of total sand (Figure 3B), corroborating the
results of Corrêa et al. (2011), Tokura et al. (2011), and
Bezerra et al. (2013). According to Novais et al. (2007),
this result is due to the adsorption of phosphorus by
oxyhydroxides of Fe and Al, which are present in greater
quantities in weathered tropical soils, especially in more
clayey soils.
High concentrations of phosphorus were found
in the agroforestry system. The laboratory method
for extracting this nutrient may have resulted in an
overestimation, given that the area studied was fertilized
with natural phosphate and the extractant used was
Mehlich 1, which is the standard method of extraction by
Embrapa in the State of Rio de Janeiro.
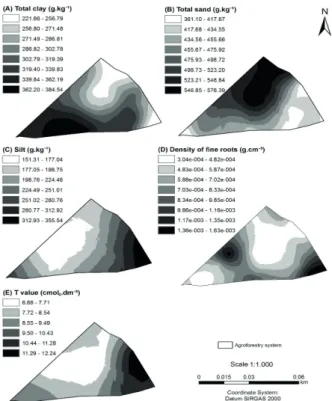
The clay fraction (Figure 3A) showed higher
concentrations in areas with medium altitude, while
higher sand concentrations (Figure 3B) were found in the
highest altitudes, and higher silt concentrations (Figure
3C) in locations with the lowest altitudes. This may be
due to the soil texture distribution being correlated with
the topography and declivity of the terrain (LEÃO et al.,
2011). These results corroborate the study performed by
Castione et al. (2015), who found higher concentrations
of sand in the upper third, higher concentrations of clay
in the lower third, and higher concentrations of silt in the
middle and lower third.
In the regions where the highest concentrations
of silt were observed, the lowest values of sand were
found. Bottega et al. (2013) found similar results in an
agricultural production area under a no-tillage system, in
which the geospatialization of the silt showed an inverse
distribution to that of the concentrations of coarse and
fine sand.
The highest values for density of fine roots
(Figure 3D) showed a heterogeneous distribution in the
agroforestry system, both in higher and lower altitudes.
This result may have been influenced by the types of
plant species in the AFS, since in these areas there are
species belonging to the Arecaceae family, which have a
fasciculated and superficial root system.
Christina et al. (2011), in a study performed in
Itatinga, São Paulo, confirmed that root development
can be influenced by the type of species planted, or
by the genetic material and its relationship with the
edaphoclimatic conditions.
The results of this work showed the efficiency and
viability of applying geostatistics to spatial distribution of
soil chemical and physical attributes in the agroforestry
system studied, which can be also used in other systems.
CONCLUSIONS
The geostatistic analysis allowed spatialize the
soil chemical and physical attributes, except the variables
T Value and Mg
2+, in the agroforestry system of the
Agroecological Farm.
FIGURE 3 Spatial distribution maps of total clay (A), total sand
Geostatistics enables the developing of maps,
assisting in decision-makings and promotes a specific and
rational soil management through the precise placement
of soil conditioners and organic fertilizers, providing the
input of nutrients to resume the management of the area.
REFERENCES
ARTUR, A. G.; OLIVEIRA, D. P.; COSTA, M. C. G.; ROMERO, R. E.; SILVA, M. V. C.; FERREIRA, T. O. Variabilidade espacial dos atributos químicos do solo, associada ao microrrelevo.
Revista Brasileira de Engenharia Agrícola e
Ambiental, v. 18, n. 2, p. 141-149, 2014.
BEZERRA, A. L. L.; LIMA, I. M. A.; NASCIMENTO, B. L. M.; AQUINO, B. F. Influência da calagem na adsorção de fósforo em diferentes solos do estado do Ceará. Agropecuária
Científica no Semiárido, v. 9, n. 4, p. 01-05, 2013.
BOTTEGA, E. L.; QUEIROZ, D. M.; PINTO, F. A. C.; SOUZA, C. M. A. Variabilidade espacial de atributos do solo em sistema de semeadura direta com rotação de culturas no cerrado brasileiro. Revista Ciência Agronômica, v. 44, n. 1, p.1-9, 2013.
BRIEDIS, C.; SÁ, J. C. M.; CAIRES, E. F.; NAVARRO, J. F.; INAGAKI, T. M.; FERREIRA, A. O. Carbono do solo e atributos de fertilidade em resposta à calagem superficial em plantio direto. Pesquisa agropecuária brasileira, v. 47, n. 7, p.1007-1014, 2012.
CAJAZEIRA, J. P.; ASSIS JÚNIOR, R. N. Variabilidade espacial das frações primárias e agregados de um Argissolo no Estado do Ceará. Revista Ciência Agronômica, v. 42, n. 2, p. 258-267, 2011.
CAMBARDELLA, C. A.; MOORMAN, T. B.; NOVAK, J. M.; PARKIN, T. B.; KARLEN, D. L.; TURCO, R. F.; KONOPKA, A. E. Field scale variability of soil properties in central Iowa soil. Soil Science Society of America Journal, v. 58, n. 5, p. 1501-1511, 1994.
CARVALHO, D. F.; SILVA, D. G.; SOUZA, A. P.; GOMES, D. P.; ROCHA, H. S. Coeficientes da equação de Angström-Prescott e sua influência na evapotranspiração de referência em Seropédica, RJ. Revista Brasileira de Engenharia
Agrícola, v. 15, n. 8, p. 108-116, 2011.
CASTIONE, G. A. F.; SOUZA, Z. M.; SILVA, R. B.; CAMPOS, M. C. C.; CUNHA, J. M. Variabilidade espacial da textura do solo em área irrigada por pivô central em diferentes posições na paisagem. Revista Agroambiente On-line, v. 9, n. 3, p. 219-226, 2015.
CHERUBIN, M. R.; SANTI, A. L.; BASSO, C. J.; EITELWEIN, M. T.; VIAN, A. L. Caracterização e estratégias de manejo da variabilidade espacial dos atributos químicos do solo utilizando a análise dos componentes principais. Enciclopédia Biosfera, Centro Científico Conhecer, v. 7, n. 13, p. 196-210, 2011.
CHRISTINA, M.; LACLAU, J. P.; GONÇALVES, J. L. M.; JOURDAN C.; NOUVELLON, Y.; BOUILLET, J. P. Almost symmetrical vertical growth rates above and below ground in one of the world’s most productive forests. Ecosphere, v. 2, n. 3, p. 1-10, 2011.
CORRÊA, R. M.; NASCIMENTO, C. W. A.; ROCHA, A. T. Adsorção de fósforo em dez solos do Estado de Pernambuco e suas relações com parâmetros físicos e químicos. Acta Scientiarum Agronomy, v. 33, n. 1, p. 153-159, 2011.
DALCHIAVON, F. C.; CARVALHO, M. P.; ANDREOTTI, M.; MONTANARI, R. Variabilidade espacial de atributos da fertilidade de um Latossolo Vermelho Distroférrico sob Sistema de Plantio Direto. Revista Ciência Agronômica, v. 43, n. 3, p. 453-461, 2012.
DONATO, L.; LIMA, M. G. Distribuição geográfica do sistema agroflorestal na região do Vale do Ribeira. Geografia, v. 22, n. 3, p. 47-64, 2013.
EBELING, A. G.; ANDOS, L. H. C.; PEREZ, D. V.; PEREIRA, M. G.; GOMES, F. W. F. Atributos químicos, carbono orgânico e substâncias húmicas em organossolos háplicos de várias regiões do Brasil. Revista Brasileira de Ciência do Solo, v. 35, n. 2, p. 325-336, 2011.
EMPRESA BRASILEIRA DE PESQUISA AGROPECUÁRIA.
Manual de métodos de análise de solo. Centro Nacional
de Pesquisa de Solos, 1997. 212p.
GOIS, G.; DELGADO, R. C.; OLIVEIRA-JÚNIOR, J. F. Modelos teóricos transitivos aplicados na interpolação espacial do índice de precipitação padronizada (SPI) para episódios de El Niño forte no estado do Tocantins. Irriga, v. 20, n. 2, p. 371-387, 2015.
LEÃO, M. G. A.; MARQUES JUNIOR, J.; SOUZA, Z. M.; SIQUEIRA, D.; PEREIRA, G. T. Terrain forms and spatial variability of soil properties in an area cultivated with citrus.
Engenharia Agrícola, v. 31, n. 4, p. 644-651, 2011.
LIMA, S. S.; LEITE, L. F. C.; OLIVEIRA, F. C.; COSTA, D. B. Atributos químicos e estoques de carbono e nitrogênio em argissolo vermelho-amarelo sob sistemas agroflorestais e agricultura de corte e queima no norte do Piauí. Revista
Árvore, v. 35, n. 1, p. 51-60, 2011.
MARTINS, J. A.; FIORIO, P. R.; DEMATTÊ, J. A. M.; MIRANDA, J. H.; LELIS NETO, J. A. Sensoriamento remoto na determinação de atributos de um Nitossolo sob aplicação de vinhaça. Revista Brasileira de Ciência do Solo, v. 38, n. 3, p. 959-971, 2014.
MATIAS, S. S. R.; NÓBREGA, J. C. A.; NÓBREGA, R. S. A.; ANDRADE, F. R.; BAPTISTEL, A. C. Variabilidade espacial de atributos químicos em Latossolo cultivado de modo convencional com soja no cerrado piauiense. Revista
AGROFORESTRY SYSTEM, SEROPÉDICA, BRAZIL
MÉIER, M.; TEIXEIRA, H. M.; FERREIRA, M. G.; FERRARI, E. A.; LOPES, S. I.; LOPES, R.; CARDOSO, I. M. Sistemas agroflorestais em área de preservação permanente.
Revista Agriculturas: experiências em agroecologia,
v. 8, n. 2, p. 12-17, 2011.
NOVAIS, R. F.; SMYTH, T. J.; NUNES, F. N. Fósforo. In: NOVAIS, R. F. et al. Fertilidade do solo. Sociedade Brasileira de Ciência do Solo, 2007. p. 472-550.
PELISSARI, A. L.; CALDEIRA, S. F.; SANTOS, V. S. Variabilidade espacial dos atributos químicos do solo em povoamento de
Tectona grandis. Cerne, v. 20, n. 3, p. 377-384, 2014.
SANTOS, H. G.; JACOMINE, P. K. T.; ANJOS, L. H. C.; OLIVEIRA, V. A.; LUMBRERAS, J. F.; COELHO, M. R.; ALMEIDA, J. A.; CUNHA, T. J. F.; OLIVEIRA, J. B. Sistema Brasileiro de
Classificação de Solos. Embrapa, 2013. 353p.
SOUSA, A. R.; ALBUQUERQUE, S. F.; LOPES, G. M. B.; SILVA, A. B.; FILHO, J. N. Caracterização e interpretação de um Planossolo Háplico Eutrófico do Agreste Pernambucano, Brasil. Anais da Academia Pernambucana de Ciência
Agronômica, v.10, n. 1, p. 271-279, 2013.
SOUSA, D. M. G.; MIRANDA, L. N.; OLIVEIRA, S. A. Acidez do solo e sua correção. In: NOVAIS, R. F. et al. Fertilidade do solo. Sociedade Brasileira de Ciência do Solo, 2007. p. 206-274.
TOKURA, A. M.; FURTINI NETO, A. E.; CARNEIRO, L. F.; CURI, N.; SANTOS, J. Z. L.; ALOVISI, A. A. Dinâmica das formas de fósforo em solos de textura e mineralogia contrastantes cultivados com arroz. Acta Scientiarum
Agronomy, v. 33, n.1, p. 171-179, 2011.
VIEIRA, S. Introdução à Bioestatística. Elsevier, 2011. 345p.
VIEIRA, S. R.; DECHEN, S. C. F.; SIQUEIRA, G. M.; DUFRANC, G. Variabilidade espacial de atributos físicos e químicos relacionados com o estado de agregação de dois Latossolos cultivados no sistema de semeadura direta. Bragantia, v. 70, n.1, p. 185-195, 2011.
ZONTA, J. H.; BRANDÃO, Z. N.; MEDEIROS, J. C.; SANA, R. S.; SOFIATTI, V. Variabilidade espacial da fertilidade do solo em área cultivada com algodoeiro no Cerrado do Brasil. Revista Brasileira de Engenharia Agrícola e
Ambiental, v. 18, n. 6, p. 595-602, 2014.
ZUCOLOTO, M.; LIMA, J. S. S.; COELHO, R. I. Correlação e variabilidade espacial de atributos químicos do solo e produção de bananeira ‘prata-anã’. Revista Brasileira de