Palavras chave: Floresta Amazônica Equações volumétricas Diversidade
Estrutura florestal
Histórico: Recebido 21/07/2016
Aceito 27/10/2016 Keywords: Amazon forest Volume equations Diversity Forest structure
1 Federal University of Paraná - Curitiba, Paraná, Brasil +Correspondência:
vccysneiros.florestal@gmail.com
DOI: 10.1590/01047760201622032204
Vinicius Costa Cysneiros1+, Sebastião do Amaral Machado1, Allan Libanio Pelissari1, Afonso
Figueiredo Filho1, Edilson Urbano1
MODELING OF THE COMMERCIAL VOLUME STOCK IN AN OMBROPHILOUS FOREST IN THE SOUTHWEST OF THE AMAZON
ABSTRACT: The abundance of tree species in tropical rainforests with different shapes
and dimensions, as well as the great structural diversity, makes difficult the employment
of form factors or equations to estimate individual volumes. However, the employment of equations at the population level makes possible to predict the volumetric stock per unit of area from forest attributes, excluding the necessity of individual tree volume
evaluation. Thereby, the aim of this study was to select variables, fit statistical models
and propose stand equations to estimate total and exploitable commercial volumes in an Amazon forest under concession regime. For this, variables commonly measured, like density and basal area, were inserted on traditional commercial volume models; besides the application of variables that considered the diversity and forest structure on models generated by the Stepwise process. After analysis, it was observed that the models obtained through Stepwise propitiated more precise estimation of the volumetric stock, reducing estimation errors and reducing problems with heteroscedasticity of residuals. The insertion of variables that express diversity and forest structure on the equations, like Shannon’s and diametric variation indices and the commercial trees ratio, contribute to predictions’ improvement, especially for the exploitable commercial volume, being recommended for the precise evaluation of timber potential of areas under Amazon forest concession.
MODELAGEM DO ESTOQUE VOLUMÉTRICO COMERCIAL EM UMA FLORESTA OMBRÓFILA NO SUDOESTE DA AMAZÔNIA
RESUMO: Nas florestas tropicais, a abundância de espécies arbóreas em diferentes formas e dimensões, bem como a elevada diversidade estrutural, dificulta o emprego de fatores de
forma ou de equações para a estimativa de volumes individuais. Contudo, o emprego de
equações de povoamento possibilita predizer o estoque volumétrico por unidade de área a partir de atributos da floresta, excluindo a necessidade da avaliação individual do volume das árvores. Com isso, o objetivo deste estudo foi selecionar variáveis, ajustar modelos
estatísticos e propor equações de povoamento para a estimativa do volume comercial total
e explorável em uma floresta sob regime de concessão na Amazônia. Para isso, medidas comumente mensuradas, como a densidade e a área basal, foram empregadas em modelos tradicionais da literatura; além da aplicação de variáveis que consideraram a diversidade e a estrutura florestal em modelos gerados pelo processo Stepwise. Desse modo, os modelos obtidos por Stepwise propiciaram estimativas mais precisas dos estoques volumétricos,
reduzindo os erros de estimativa e reduzindo problemas de heterocedasticidade dos
resíduos. Além disso, a inserção de variáveis que expressam a diversidade e a estrutura florestal nas equações, como os índices de Shannon e de variação diamétrica e a razão de
indivíduos comerciais, contribuiu para a melhoria das predições, sobretudo para o volume
FOREST IN THE SOUTHWEST OF THE AMAZON
INTRODUCTION
Tropical forests present a series of resources useful to the society, especially timber. In these forests, despite the presence of a great number of tree species,
the majority is presented in rare or aggregated form
(CONDIT et al., 2000) and only a few of them possess commercial interest for the lumber industry (CUNHA et al., 2016). Therefore, it is necessary to survey extensive forest areas in order to attend the increasing timber demand (AKINDELE and LEMAY, 2006).
The timber potential of a forest is usually estimated from data obtained in forest inventories, using a sample as basis to infer population parameters (MACHADO et al., 2000), associating them with form factors or volume equations. However, the abundance of these tree species
in many forms and dimensions, added to the high floristic
and structural diversity, are the main characteristics of
tropical rainforests that make difficult to obtain precise
approximations of individual volumes (AKINDELE and LEMAY, 2006; IGBINOSA and AMOO, 2014).
Several management and conservation activities of tropical forests require safe and precise estimates of tree’s volume (COLE and EWEL, 2006; CHÁIDEZ, 2009; ADEKUNLE et al., 2013). For this, stand volume equations estimate the total volumetric stock per unit of area, excluding the necessity of individual assessment of trees’ volume, employing dendrometric population measures, attributes of forest’s site, climate and geographic data (ADENKULE et al., 2004; OLIVEIRA et al., 2005), generating precise estimates and considerable reduction of time and cost in forest inventories (SOUZA et al., 2014).
Equations for tree volume usually result in higher errors of estimation in Amazon Forest (HIRAMATSU, 2008; COLPINI et al., 2009; BARRETO et al., 2014). On the other hand, the stand equations can provide more statistically reliable estimates of volumetric stock, aiming at management plans and policies of forest concession.
Additionally, the floristic composition of natural forests influences their structure, and it should be incorporated
in volumetric models. Thus, the aim of this study was
to select variables, fit statistical models and propose
stand equations for the total and exploitable commercial volumetric stocks in an Amazon Forest under concession regime, employing dendrometric population variables and others that consider the diversity and structure of these forest formations.
MATERIAL AND METHODS
Area of study
This study was developed at the National Forest
of Jamari, Rondônia state, on the Southwest Brazilian
Amazon border, between the geographic coordinates 09° 00’ 00” to 09° 30’ 00” S and 62° 44’ 05” to 63° 16’ 64” W. The National Forests are sustainable use conservation units, characterized by the predominance
of native forest coverage and whose basic objective is
the multiple use and sustainable management of forest resources. Therefore, many National Forests in Brazil are currently under concession regime, managed by private companies, under the protection of the Public Forests Management Law (BRASIL, 2006).
The National Forest of Jamari is inserted in the Southwest of the Amazon Craton, where Phanerozoic
coverage is abundant. The topography is flat to
undulating, with pedologic units formed by associations of Latosols, Cambisols and Podzols (MMA/IBAMA, 2005). The region’s climate is Tropical Rainy of the Aw
type (Köppen), characterized by a well-defined dry
season during winter, with annual rainfall around 2,400 mm and annual average temperature of 25°C. Regarding the forest types, Dense and Open Ombrophilous Forests are predominant, varying according to the density of the tree individuals.
Data base
In this paper, the total commercial volumetric stock (Vt) corresponded to the inside bark volume (m³. ha-1) from the trunk base to the morphological inversion point, defined as commercial height (h), of all trees with a diameter at 1.3 m above the ground (d) equal or superior to 40 cm. The exploitable commercial volumetric stock
(Ve) comprehended the volume of 32 merchantable
Amazon species.
The census survey of an Annual Production Unit of 1,596 hectares was subdivided in sample units of 50 m x 250 m that composed the database for the volume per unit of area modeling. Besides, sample units with the presence of only one individual or a single species were previously excluded, since they would make impossible the calculation of some independent variables for the volumetric modeling, as the diversity indices and density ratios.
The tree commercial volume (v)
was estimated based on the equation
fitted for 4,366 tree-samples of 32 commercial species on Amazon, showing adjusted coefficient of determination
equal to 0.8 and standard error of estimate of 2.8 m3 after
estimations per plot were converted to hectare by the proportionality factor of 0.8.
Volumetric stock modeling
Commercial volumes per hectare were estimated for each sample unit, being also calculated the following
measurements: basal area per hectare (G), number of
trees per hectare (N), average of the diameter at 1.3
m above the ground (d
-), quadratic mean diameter (dg), average commercial height (h
-) measured with graduated
stick, dominant commercial height (hdom), Shannon’s
diversity index (H’), Pielou’s equability index (J’), diametric variation index (lvd), density ratio of commercial trees (Ric), and commercial species ratio (Rec).
The total and exploitable commercial volumetric
stocks and the G and N variables were transformed
to the unit of one hectare, while the commercial hdom
variable was adapted and calculated based on the Weise concept (SCOLFORO, 2006), considering the average commercial height of 20% of the trees of greater diameter per sample unit. The lvd [1] considers the range of the diameter of all trees in a sample unit, and is directly proportional to the diametric differentiation of the forest or the sample (PASTORELLA and PALETTO, 2013). The density ratio of commercial trees [2] and commercial species ratio [3] were inserted in the models with the
objective of assigning weight to the presence and density
of exploitable species on the estimates, where: n = total number of trees in the sample unit; nc = number of trees of the 32 exploitable species present in the sample unit; s = total number of species per sample unit; sc = number of commercial species per sample unit; and rij = ratio between the biggest and the smallest diameter of the sample unit.
For this, Pearson’s linear correlation coefficient (r) was calculated to identify the highest correlations among independent variables with total and exploitable volumes in its pure and in logarithm form, as employed by Souza et al. (2014). The independent variables were tested untransformed, in logarithm, inverted, potentiated and combined, totalizing a 130 variables set.
The logarithmic discrepancy was corrected for models with , and the selection for the best equations to estimate volumetric stocks was performed based
on the following criteria: highest adjusted coefficient
of determination (R²aj.), lowest standard error of
estimate in percentage (Syx%), significance of the regression coefficients, absence of multicollinearity
by the variance inflation factor (VIF), and residual distribution without apparent tendencies. Besides, an independent sample of 10% of the sample units was selected exclusively to validate the best equation. For this, the Chi-square (c²) adherence test at 95% probability and the graphical analysis of residuals were employed.
(
)
1 1
= - ij
Ivd r
n [1]
æ ö÷ ç =ççè ønc÷÷÷
Ric
n [2]
æ ö÷ ç =ç ÷÷çè øsc÷
Rec
s [3]
Traditional commercial volumetric models (Table 1) were selected for modeling of the commercial volumes per unit of area (UNG and OUELLET, 1991; OLIVEIRA
et al., 2005; SOUZA et al., 2014) and fitted through linear regression by software Action in Microsoft Office Excel (EQUIPE ESTATCAMP, 2014). These fitted models were
compared to equations generated by Stepwise process.
TABLE 1 Traditional models fitted for total and exploitable commercial volumetric stocks in a Ombrophilous Forest in the Southwest of the Amazon.
Model Author Mathematical formula
1
Spurr
0 1
V= b + b(G)
2 V= b + b0 1(G h)×
-3 V= b + b0 1(G h× dom)
4 ln(V)= b + b0 1ln(G)
5 ln(V) 0 1ln(G h)
-= b + b ×
6 ln(V)= b + b0 1ln(G h× dom)
7 2 dom
0 1
ln(V)= b + b ln(G ×h )
8
Figueiredo Filho
0 1
V= b + b ×ln(G h)×
-9 V= b + b ×0 1 ln(G h× dom)
10 2
0 1
V ln(G h)
-= b + b × ×
11 2
0 1
ln(V)= b + b ×ln(G ×h)
-12
Ung and Ouelet
0 1 2
ln(V)= b + b ×ln(G)+ b ln(h)
-13 ln(V)= b + b ×0 1 ln(G)+ b ×2 ln(hdom)
14 ln(V) 0 1 ln(G h) 2 ln(G hdom)
-= b + b × × + b × ×
15
Scolforo ln(V) 0 1 ln(N d)
-= b + b × ×
16 ln(V)= b + b ×0 1 ln(G N)2×
17
Rosot
0 1
ln(V)= b + b ×ln(G N)×
18 2
0 1
V (G h)
-= b + b × ×
Where: V = commercial volume per unit area (m³.ha-1); β
0, β1and β2 = regression coefficients; G = basal area per hectare; h
FOREST IN THE SOUTHWEST OF THE AMAZON
RESULTS AND DISCUSSION
Traditional models
The coefficients and statistics of the models fitted for total and exploitable commercial volumes
are presented on Table 2. Models 11 and 12 exhibited
the lowest standard error of estimate (Syx%), the
highest adjusted coefficients of determination (R²aj.) and
significant regression coefficients (βi). In this way, they were selected as the most precise to estimate the total
commercial volume. For this volume, the worst fits were
provided by models 8, 9 and 10. However, the models 1, 2 and 3 were excluded from the analysis by presenting
non-significance of some regression coefficients.
By means of the same selection criteria used, models 2, 5 and 14 were the most precise for the exploitable commercial volume per unit of area (Table 2). However, even providing satisfactory estimates, models
1, 3, 10, 13 and 14 presented non-significant regression coefficients and were eliminated from the analysis,
specially the model 14, due to the multicollinearity effect (VIF > 10). Therefore, model 5 was selected as the most precise to estimate the exploitable commercial volume, presenting higher R²aj.value and one of the lowest Syx%.
The traditional models selected on this study are cited among the most precise for volume per unit of
area estimate on natural forests. Oliveira et al. (2005) selected Ung and Ouellet’s model (model 12) as the best. This model is a generic adaptation of Schumacher and Hall’s model for individual volume estimate, whose
use is consecrated, due to its accuracy and efficiency.
Besides, Souza et al. (2014), when modeling biomass from Mimosa scabrella Benth. in native stands, selected Spurr’s combined variable model (model
5) among the most efficient to estimate the timber
production per unit of area, the same result reached on this study for exploitable commercial volume. This result might be related to the ponderation factor G². that, according to Akindele and Le May (2006), is appropriate to reduce heteroscedasticity, providing improvement of the estimates.
Selected models by Stepwise process
Considering the variables (Table 3), higher linear correlations (r) with total and exploitable commercial volumes were provided by basal area (r = 0.99 and 0.96, respectively), number of trees per hectare (r = 0.96 and 0.89, respectively), Shannon’s diversity index (r = 0.71 and 0.67, respectively) and diametric variation index (r =
0.66 and 0.65, respectively), contributing, therefore, to their insertion in different ways on the models generated by the Stepwise process. The variables basal area (G)
TABLE 2 Statistics and regression coefficients of the models fitted to estimate the total and exploitable commercial volumetric stocks in an Ombrophilous Forest in the Southwest of the Amazon.
Model Total commercial volume Exploitable commercial volume
β0 β1 β2 R²aj. Syx% β0 β1 β2 R²aj. Syx%
1 -0.3899ns 11.6790* - 0.993 4.39 0.0002ns 7.7096* - 0.923 14.29
2 0.4176ns 0.6832* - 0.995 3.59 0.1941ns 0.4561* - 0.947 11.81
3 0.5625ns 0.6304* - 0.994 3.92 0.6043ns 0.4165* - 0.927 13.91
4 2.4337* 1.0088* - 0.993 4.38 2.0127* 1.0138* - 0.984 14.37
5 -0.3125* 0.9860* - 0.995 3.56 -0.7769* 0.9983* - 0.989 11.84
6 -0.3862* 0.9855* - 0.994 3.88 -0.8490* 0.9971* - 0.984 14.01
7 1.0043* 0.4991* - 0.996 3.19 0.5667* 0.5033* - 0.985 13.92
8 -29.872* 19.4813* - 0.758 25.05 -23.101* 13.7452* - 0.735 26.51
9 -31.429* 19.4975* - 0.759 24.97 -24.086* 13.7267* - 0.730 26.76
10 -3.1137ns 9.8643* - 0.759 25.02 -4.0579ns 6.9282* - 0.731 26.75
11 1.0422* 0.4992* - 0.997 2.59 0.6042* 0.5036* - 0.987 12.76
12 0.6318* 0.9948* 0.6466* 0.997 2.58 -3.0318* 0.9787* 1.8081* 0.945 12.08
(VIF) - (1.106) (1.106) (1.076) (1.076)
13 0.8336* 0.9968* 0.5588* 0.996 3.18 -1.0679ns 0.9954* 1.0735* 0.925 14.11
(VIF) - (1.094) (1.094) (1.055) (1.055)
14 0.3430* 0.6131* 0.3734* 0.997 2.64 -0.7290* 1.5211* 0.5247 ns 0.948 11.70
(VIF) - (350.508) (350.508) (315.603) (315.603)
15 -2.7673* 1.0293* - 0.965 9.54 -3.1061* 1.0171* - 0.967 20.52
16 2.1791* 0.3402* - 0.985 6.30 1.7715* 0.3385* - 0.976 17.56
17 2.0535* 0.5119* - 0.973 8.34 1.6550* 0.5066* - 0.970 19.45
18 17.1888* 0.0865* - 0.911 15.21 11.8290* 0.0567* - 0.845 20.27
and number of trees per hectare (N) are fundamental to describe the forests’ structure and, consequently, are widely used for volume per area estimate, due to the good correlation and predictive potential (ADEKUNLE et al., 2004; OLIVEIRA et al., 2005; SOUZA et al., 2014.
diversity in natural forests generate greater probability of occurring species of commercial interest, increasing, therefore, the timber production, as observed on this study. Nevertheless, the available evidence suggests that the positive relationship between species diversity and productivity depends, fundamentally, on the geographic scale and the ecological characteristics of the studied ecosystem (MITTELBACH et al., 2001).
Similarly, the lvd variable showed good
correlation with the exploitable and total commercial volumes, being inserted in three out of four generated models. The diametric differentiation might be considered one of the most important characteristics to describe the ecosystem’s functioning, the succession development and local biodiversity in the forests (PASTORELLA and PALETTO, 2013), being, therefore, directly related to the timber production of natural forests.
The Stepwise process generated models presented satisfactory performance, with Syx% around 5 and 6% for total commercial volume and 5 and 7% for exploitable commercial volume, and R²aj. values superior to 0.98 (Table 4). According to the adopted selection criteria, the most adequate models for total commercial volume were the logarithmic, while the arithmetic was the most satisfactory for exploitable volume, with superior results about the traditional models. However, the logarithmic exploitable models presented large number of variables and multicollinearity (VIF > 10).
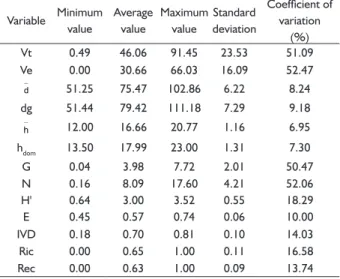
TABLE 3 Descriptive statistics of variables used to fit models to estimate the total and exploitable commercial volumetric stocks in an Ombrophilous Forest in the Southwest of the Amazon.
Variable Minimum value
Average value
Maximum value
Standard deviation
Coefficient of variation
(%) Vt 0.49 46.06 91.45 23.53 51.09 Ve 0.00 30.66 66.03 16.09 52.47
d
-51.25 75.47 102.86 6.22 8.24
dg 51.44 79.42 111.18 7.29 9.18
h
-12.00 16.66 20.77 1.16 6.95
hdom 13.50 17.99 23.00 1.31 7.30
G 0.04 3.98 7.72 2.01 50.47
N 0.16 8.09 17.60 4.21 52.06
H' 0.64 3.00 3.52 0.55 18.29
E 0.45 0.57 0.74 0.06 10.00
IVD 0.18 0.70 0.81 0.10 14.03
Ric 0.00 0.65 1.00 0.11 16.58
Rec 0.00 0.63 1.00 0.09 13.74
Where: Vt = total commercial volumetric stock (m³.ha-¹); Ve = exploitable
commercial volumetric stock (m³.ha-¹); d-= arithmetic average of the diameters at 1.3 m above the ground (cm); dg = quadratic mean diameter (cm); h-= average of commercial height (m); hdom = dominant commercial height (m); G = basal area per hectare (m².ha-¹); N = number of trees per hectare; H’ = Shannon’s diversity
index; J’ = Pielou’s equability index; lvd = diametric variation index; Ric = density ratio of commercial trees; and Rec = commercial species ratio.
Among the independent variables tested as an alternative to those commonly used for volume per unit area estimate, diametric variation index (lvd), commercial trees ratio (Ric), and Shannon’s diversity index (H’) presented prediction potential for the commercial volumetric stock. Moreover, Pielou’s equability index (J’) and commercial species ratio (Rec) variables were not inserted in the models, due to the inverse and inferior relationship with total commercial volume (r = -0.68 and -0.06, respectively) and exploitable commercial volume (r = -0.64 and -0.01, respectively). Besides, the efficiency
of the combination of the variables G.Ric was observed on this analysis, which was included on generated models.
Diversity of species, represented on this study
by the H’ index, provided good explanation for the
exploitable commercial volume, with the advantage of considering the species richness and uniformity and does not favor rare or dominant species (LIANG et al., 2007). In this sense, Vilà et al. (2007) mentioned that many established experiments in different diversity levels showed positive effect of the diversity over timber production. Those authors highlighted that the high
TABLE 4 Coefficients and statistics of the models generated by the Stepwise process for total and exploitable commercial volumetric stocks estimates in an Ombrophilous Forest in the Southwest of the Amazon. Model β0 β1 β2 β3 β4 β5 R²aj.Syx%
Total commercial volume
1 0.1559* 9.0569* 0.987 5.83
Vt Variable N.hdom G.Ric
(VIF) (5.115) (5.115)
2 -1.4179* -0.0025* 0.1771* 0.1554* 0.9476* 5.5.10-7* 0.990 4.97
ln(Vt) Variable h² Ric² H’.Ivd ln(N.hdom) (d.h)²
(VIF) (2.461) (1.592) (8.841) (8.819) (3.024)
Exploitable commercial volume
4 -5.4469* 0.0204* 0.0010* 11.7357* 0.988 5.57 Ve Variable h² (G².Ivd)² G.Ric
(VIF) (1.101) (2.404) (2.556)
5 2.4661* -2.7838* 0.0542* 0.0626* -0.0006* 1.0640* 0.981 7.09 ln(Ve) Variable 1/h 1/G 1/Ric 1/(G².Ivd) ln(G.Ric)
(VIF) (1.607) (12.976) (1.769) (7.151) (4.777)
Where: Vt = total commercial volume; Ve = exploitable commercial volume; N = number of trees per hectare; hdom = dominant commercial height; G = basal area per hectare; h
-= average commercial height; lvd -= diametric variation index; Ric = commercial trees ratio; h-= average of commercial height; H’ = Shannon’s diversity index; d-= arithmetic average of the diameters at 1.3
FOREST IN THE SOUTHWEST OF THE AMAZON
Comparison of models
Models generated by the Stepwise process
presented effi ciency and precision, especially for
exploitable commercial volume that provided an increase of the estimates’ precision, decreasing Syx% and increasing
R²aj. compared to traditional models. Another advantage of this process was the reducing of heteroscedasticity, as observed on the graphical analysis of residual distribution generated by the selected models (Figure 1). Thereby, the models generated by Stepwise on this study were considered the adequate for the population commercial volume estimate.
The Chi-square (X²) test was applied to validate the selected equations to volumetric stock estimation. Thus, respectively for total and exploitable commercial volumes, the values of X² equal to 0.352ns and 4.780ns
were observed for the tradicional models, while X²
values equal to 0.279ns and 2.156ns were observed for Stepwise models, being non-signifi cant and adherent
to the observed values. Moreover, validation residuals presented homogenous distribution throughout the whole regression line (Figure 2).
(a)
(b)
(c)
(d)
FIGURE 1 Residuals dispersion of the models selected for total (a, c) and exploitable (b, d) commercial volumetric stocks in an Ombrophilous Forest in the Southwest of the Amazon.
(a)
(b)
(c)
(d)
Facing the correlation among richness of tree species and forest production, the maintenance of the tree diversity should be a routine activity of forest management, in order to ensure greater yield through increasing the probability of occurring potentially exploitable commercial species (LIANG et al., 2007; VILÀ et al., 2007). However, the correlation between diversity and forest production varies according to the forest typology (LIANG et al., 2007). Therefore, this
shows the necessity of constant evaluation of the floristic
and structural diversity of the forests and their insertion in equations to estimate the volumetric stock and yield of tropical forests.
Those addressed volumetric models (Figures 1 and 2) presented several applications on the forest concessions context in Amazon. The Annual Forest Concession Plan, for example, was instituted by the Public Forests Management Law (BRASIL, 2006), that
selects and describes Public Federal Forests qualified
for concession. Likewise, the Decree number 6,063 of 2007 (BRASIL, 2007) establishes that forest concessions must occur through bidding and, for its effectiveness, it is necessary to evaluate the forest in terms of commercial timber potential (CAVALCANTI et al., 2009). Thus, the equations developed in this study provide more statistically reliable estimates of volumetric stock in Amazon Forest, in contrast to tree volume equations that usually result in higher errors of estimation.
CONCLUSIONS
The developed equations in the present study generate precise estimations of total and exploitable commercial volumetric stocks per unit of area on the National Forest of Jamari. These equations employ accessible variables commonly measured in forest inventories, such as density, basal area and average height.
Besides, the insertion of variables that consider floristic
and forest structural diversities, like the Shannon’s and diametric variation indexes and the commercial trees ratio, expressively contribute to improve the volume estimates, especially for the exploitable commercial stock, corroborating with the necessity of constant evaluation of the tree diversity of Amazon forests to a precise evaluation of the timber potential.
REFERENCES
ADEKUNLE, V. A. J.; NAIR, K. N.; SRIVASTAVA, A. K.; SINGH, N. K. Models and form factors for stand volume estimation in natural forest ecosystems: a case study of Katarniaghat Wildlife Sanctuary (KGWS), Bahraich District, India. Journal of Forestry Research, v. 24, n. 2, p. 217-226, 2013.
AKINDELE, S. O.; LEMAY, V. M. Development of tree volume equations for common timber species in the tropical rain forest area of Nigeria. Forest Ecology and Management, v. 226, p. 41-48, 2006.
BARRETO, W. F.; LEÃO, F. M.; MENEZES, M. C.; SOUZA, D.
V. Equação de volume para apoio ao manejo comunitário
de empreendimento florestal em Anapu, Pará. Pesquisa
Florestal Brasileira, v. 34, n. 80, p. 321-329, 2014.
BRASIL. Decreto nº 6.063, de 20 de março de 2007. Regulamenta,
no âmbito federal, dispositivos da Lei nº 11.284, de 2 de março de 2006, que dispõe sobre a gestão de florestas públicas para a produção sustentável, e dá outras providências. Diário Oficial da União, n. 55, p. 1-4, 2007.
BRASIL. Instrução Normativa nº 5, de 11 de dezembro de
2006. Altera as Diretrizes para o Manejo Florestal em
escala empresarial na Amazônia. Diário Oficial da União,
n. 238, p.155-159, 2006.
CAVALCANTI, F. J. B.; MACHADO, S. A.; HOSOKAWA, R. T. Tamanho de unidade de amostra e intensidade amostral
para espécies comerciais da Amazônia. Floresta, v. 39, n.
1, p. 207-214, 2009.
CHÁIDEZ, J. N. Allometric equations and expansion factors for tropical dry forest trees of Eastern Sinaloa, Mexico. Tropical and Subtropical Agroecosystems, v. 10, p. 45-52, 2009.
COLE, T. G.; EWEL, J. J. Allometric equations for four valuable tropical tree species. Forest Ecology and Management, v. 229, p. 351-360, 2006.
COLPINI, C.; TRAVAGIN, D. P.; SOARES, T. S.; SILVA, V. S. M. Determinação do volume, do fator de forma e da
porcentagem de casca de árvores individuais em uma Floresta Ombrófila Aberta na região noroeste de Mato
Grosso. Acta Amazonica, v. 39, n. 1, p. 97-104, 2009. CONDIT, R.; ASHTON, P.; BAKER, P.; BUNYAVEJCHEWIN,
S; GUNATILLEKE, S.; GUNATILLEKE, N.; HUBBELL, S. P.; FOSTER, R. B.; ITOH, A.; LAFRANKIE, J.V.; LEE, H. S.; LOSOS, E.; MANOKARAN, N.; SUKUMAR, R.; YAMAKURA, T. Spatial patterns in the distribution of tropical tree species. Science, v. 288, n. 5470, p. 1414-1418, 2000. CUNHA, T. A.; FINGER, C. A. G.; HASENAUER, H. Tree basal
area increment models for Cedrela, Amburana, Copaifera
and Swietenia growing in the Amazon rain forests. Forest Ecology and Management, v. 365, p. 174-183, 2016.
EQUIPE ESTATCAMP. Software Action. São Carlos: Estatcamp - Consultoria em estatística e qualidade, 2014. IGBINOSA, A. H.; AMOO, O. B. Appropriate volume functions
for Leguminosae family in two tropical rainforests in Cross River State, Nigeria. Journal of Environment and Ecology, v. 5, n. 2, p. 206-221, 2014.
HIRAMATSU, N. A. Equações de volume comercial para espécies nativas na região do Vale do Jari, Amazônia Oriental. 2008. 107 p. Dissertação (Mestrado em Engenharia
FOREST IN THE SOUTHWEST OF THE AMAZON
MACHADO, S. A.; MELLO, J. M.; BARROS, D. A.
Comparação entre métodos para a avaliação de volume total de madeira por unidade de área para o pinheiro
do paraná na região Sul do Brasil. Cerne, v. 6, n. 2, p.
55-66, 2000.
MITTELBACH, G. G.; STEINER, C. F.; SCHEINER, S. M.; GROSS, K. L.; REYNOLDS, H. L.; WAIDE, R. B.; WILLIG, M. R.; DODSON, S. I.; GOUCH, L. What is observed relationship between species richness and productivity? Ecology, v. 82, n. 9, p. 2381-2396, 2001.
MMA/IBAMA. Plano de Manejo da Floresta Nacional do Jamari - Rondônia. Volume I: Diagnóstico. 2005. 156 p.
OLIVEIRA, M. L. R.; SOARES, C. P. B.; SOUZA, A. L.; LEITE, H. G. Equações de volume de povoamento para fragmentos
florestais naturais do município de Viçosa, Minas Gerais.
Revista Árvore, v. 29, n. 2, p. 213-225, 2005.
PASTORELLA, F.; PALETTO. A. Stand structure indices as tools to support forest management: an application in Trentino forests (Italy). Journal of Forest Science, v. 59, n. 4, p. 159-168, 2013.
SCOLFORO, J. R. S. Biometria florestal: modelos de
crescimento e produção florestal. Lavras: UFLA/FAEPE,
2006. 393 p.
SOUZA, R. F.; MACHADO, S. A.; FIGUEIREDO FILHO, A. Modelagem da biomassa total e da lenha para bracatingais nativos. Revista Árvore, v. 38, n. 1, p. 53-62, 2014. UNG, C. H.; OUELLET, D. Stand volume tables. Application to
black spruce of Lebel-sur-Quevillon. Forestry Chronicle, v. 67, n. 6, p. 712-715, 1991.