Vol.47, n. 2 : pp. 213-217, June 2004
ISSN 1516-8913 Printed in Brazil BRAZILIAN ARCHIVES OF
BIOLOGY AND TECHNOLOGY
A N I N T E R N A T I O N A L J O U R N A L
Measurement of the Gassing Power of Bakers’ Yeast:
Correlation between the Dough Volume and the Incubation
Time
Walter Borzani∗
Centro Universitário do Instituto Mauá de Tecnologia; Escola de Engenharia Mauá; Praça Mauá 1; 09580-900; São Caetano Sul - SP - Brazil
ABSTRACT
An empirical equation is proposed to correlate the dough volume and the incubation time during cylinder tests using thin flour dough carried out to evaluate the gassing power of compressed yeast. The above equation permitted to correlate the gassing power of the yeast and the proof time, as well as to calculate the specific rate of the dough volume variation at any time. It provided more information regarding the fermentation power of the yeast than the sole value of its gas-producing power. A physical interpretation of the proposed equation is presented.
Key words: Bakers’ yeast; Gassing power; Fermenting power; Gas-producing power
∗ Author for correspondence
INTRODUCTION
In several methods frequently used to evaluate the fermenting power of bakers’ yeast (Caron, 1995; Ponte and Reed, 1982; White, 1954) one measures either the time required for a dough to attain a given volume or one measures the volume of the dough for a given proof time. Generally proof times are between 45 and 60 min. Calling V the dough volume corresponding to an incubation proof time tp, V0 the initial value of V, and m the
mass (dry matter) of yeast used in the test, the gassing power (P) of the yeast is preferably calculated by Equation (1).
p p
0
t m
V t m
V V P
⋅ = ⋅ −
= ∆ (1)
All the experimental conditions must be strictly controlled if the purpose of the tests is to compare
the gas-producing powers of different yeasts. The main purpose of this paper was to present an empirical equation correlating V and t in the particular case of cylinder tests using thin flour doughs.
MATERIALS AND METHODS
To a 250-mL Erlenmeyer flask containing 120 mL of distilled water, 1.00 g of previously
disaggregated compressed yeast (particles
system was then incubated at 30ºC and the volume of the dough was measured at time intervals of 15-30 min. During the preparation of the dough all the materials were maintained at 30-31ºC.
Some tests were carried out using 250-mL (V0 =
100 mL) and 500-mL (V0 = 250 mL) cylinders.
The ratios between the areas of the upper surface of the dough and the corresponding V0 values in
the 100-mL, 250-mL and 500-mL cylinders were 0.098 cm-1 , 0.096 cm-1 and 0.064 cm-1, respectively.
The mass (dry matter) of yeast in 50 mL of dough was 0.075 g.
RESULTS AND DISCUSSION
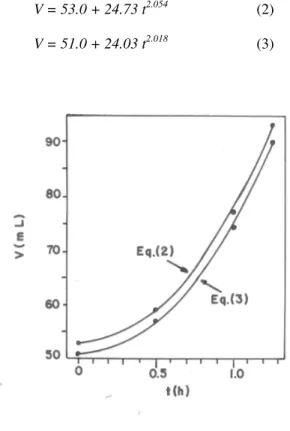
Fig. 1 shows the results obtained in two tests using 100-mL glass measuring cylinders carried out with a recently prepared compressed yeast. The empirical equations (2) and (3) may be proposed to represent the curves of Fig. 1.
V = 53.0 + 24.73 t2.054 (2) V = 51.0 + 24.03 t2.018 (3)
Figure 1 - Correlations between the dough volume (V) and the incubation time (t) in tests carried out with the same compressed yeast.
Fig. 2 shows the results obtained with the above yeast after a storage period of 18 days at 5-6ºC. Equation (4) represents the curve of Fig. 2.
V = 53.0 + 10.52 t 2.424 (4)
Figure 2 - Correlation between the dough volume (V) and the incubation time (t) in a test carried out with the compressed yeast cited in Fig. 1 after a storage period of 18 days at 5-6ºC.
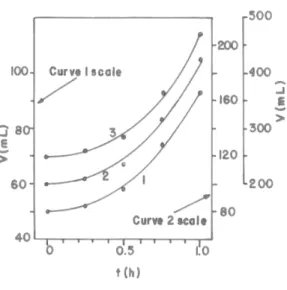
Fig. 3 shows the results of tests carried out with another compressed yeast using 100-mL [see Equation (5)], 250-mL [see Equation (6)] and 500-mL [see Equation (7)] glass measuring cylinders. Table 1 shows the values of the ratios (R) between the values of V calculated by Equations (2) to (7) and the corresponding experimental values of V.
Figure 3 - Correlations between the dough volume (V) and the incubation time (t) in tests carried out with another recently prepared compressed yeast. Curve 1: 100-mL cylinder; V0 = 50.0 mL; Equation (5). Curve 2: 250-mL cylinder; V0 = 100 mL; Equation 6. Curve 3: 500-mL cylinder; V0 = 250 mL; Equation 7.
Based on Equations (2) to (7), Equation (8) may be proposed as a general correlation between V
and t, where k and b are empirical constants.
V = V0 + ktb or ∆V = ktb (8)
Calling tpthe proof time, Equations (1) and (8) led
to Equation (9).
1 −
=
bp
t
m
k
P
(9)Considering the tests corresponding to Equations (2) to (7), Equations (10) to (15), respectively, correlate P and tp. Equations (9) to (15) show how
tp affects P.
054 . 1 p
t 7 . 329
P= (10)
018 . 1 p
t 4 . 320
P= (11)
424 . 1 p
t 3 . 140
P= (12)
242 . 1 p
t 6 . 569
P= (13)
267 . 1 p
t 7 . 559
P= (14)
419 . 1 p
t 5 . 575
P= (15)
Table 1 - Values of R
R Equation
Minimum Maximum Average SD*
2 0.990 1.009 1.000 0.008
3 0.986 1.013 0.999 0.011
4 0.989 1.008 1.000 0.006
5 0.978 1.017 0.998 0.014
6 0.967 1.030 0.995 0.023
7 0.973 1.019 0.996 0.016
* Standard deviation
Equations (10) to (15) show that the ratio between the values of P of two different yeasts is affected by tp. With the only purpose to present a numerical
example, the ratio between the values of P of the yeasts used in the tests corresponding to equations (10) and (12) decreased from 3.06 to 2.36 when tp
increased from 30 min to 60 min.
With the only purpose to compare the experimental values of P, that is, the values of P
calculated from the measured values of V, and the corresponding values of P calculated by Equations (10) to (15), Table 2 presents the above values for
Table 2 - Experimental and calculated [Equations (10) to (15)] values of P for tp= 1.0 h P (mL/g.h)
Experimental Calculated
Difference (%)
140 140 (12)* 0
311 320 (11)* 2.9
329 330 (10)* 0.3
570 570 (13)* 0
575 560 (14)* - 2.6
575 575 (15)* 0
* Number of the Equation
Let us consider now the specific rate of the dough volume variation (µ) defined by Equation (16).
dt dV m⋅
= 1
µ (16)
Equations (16) and (8) lead to Equation (17).
1 −
⋅
= b
t m
k b
µ (17)
In other words, if P is the gassing power corresponding to a proof time tp , b.P is the
specific rate of the dough volume variation at time
tp [see Equations (9) and (17)]. Finally, it seems
advisable to propose a physical interpretation of Equation (8).
Let us consider, first of all, the following well know facts: (i) the mass of yeast used as inoculum is around 3% of the flour mass (Cotton and Ponte, 1947); (ii) there is little or no multiplication of yeast cells during the 3 to 4 hours sponge period (Thorn and Ross, 1960) ; (iii) for small concentrations of yeast, only long fermentation periods (overnight) lead to considerable cells growth (Ponte and Reed, 1982).
Based on the above facts, and remembering that in our experiments the mass of yeast was 0.8% of the flour mass and the average incubation time was 1.2 h (standard deviation, 0.3h), we may assume that the masses of both yeast and sugars were practically constant during the tests. In other words, we may assume that the CO2 production
rate was constant.
The experimental results (see Equations (2) to (7)), however, clearly show that the rate (dV/dt) of the dough volume variation was not constant, but increased during the tests. In the particular case of
dV/dt were 23.9 mL/h and 48.5 mL/h, respectively.
Baker and Mize (1941), however, proving that the CO2 produced by the yeast cells does not generate
gas bubbles, but diffuses into already present air bubbles originated during dough mixing or from air adsorbed in flour particles, provided suitable information to explain how from a constant CO2
production rate in dough results an increasing variation rate of the dough volume. In fact, based on the paper published by Baker and Mize (1941), we may say that the diffusion rate of CO2 into an
air bubble mainly depends on the number of yeast cells included in a thin dough layer adjacent to the bubble surface. The diffusion of some CO2 into the
bubble will lead to the following consecutive consequences: the bubble will enlarge, the number of yeast cells included in the dough layer adjacent to the bubble surface will become greater and the CO2 diffusion rate will increase. If the diffusion
rate of CO2 into the bubble increases, dV/dt also increases.
The above interpretation of Equation (8) is only a qualitative one. It seems quite difficult to propose a mathematical model leading to Equation (8) because there are no information about, for instance, the number of already present air bubbles and their initial volumes, the interaction between
close bubbles, the frequency of bubbles
coalescence, the actual value of the CO2
production rate, the degree of heterogeneity of the dough, the CO2 transport rates through the dough,
and so on.
NOMENCLATURE
b Empirical constant, see equation (8).
k Empirical constant, see equation (8).
r correlation coefficient.
R Ratio between the value of V calculated by
the empirical equation and the
corresponding experimental value of V.
t Incubation time (h).
tp Proof time (h).
V Dough volume at time t (mL).
V0 Initial value of V (mL).
∆V V – V0 (mL)
µ Specific rate of the dough volume
variation at time t (mL/g.h).
RESUMO
Propõe-se uma equação empírica que correlaciona o volume da pasta com o tempo de incubação na medida, pelo método do cilindro graduado e pasta de baixa concentração, da capacidade do fermento prensado de aumentar o volume da pasta (usualmente denominada “poder de levantamento” ou “poder de fermentação” do fermento). A equação proposta permite não apenas correlacionar o valor daquela capacidade com o tempo de incubação, mas também calcular a velocidade específica de aumento do volume da pasta em cada
instante, fornecendo assim muito mais
informações sobre o desempenho do fermento. Apresenta-se, também, uma possível explicação da fórmula empírica proposta.
REFERENCES
Baker, J. C. and Mize, M. D. (1941), The origin of the gas cells in bread dough. Cereal Chem, 18, 19-34. Caron, C. (1995), Commercial Production of Bakers’
Yeast and Wine Yeast. In: Reem, H. J. and Reed, G. (Ed.). VCH Verlagsgesellschaft mbH., Weinheim. Biotechnology, 9.
Cotton, R. H. and Ponte Jr., J. G. (1974), Baking industry. In: Inglett, G. E. (ed.). Wheat Production and Utilization. AVI Publishing Co., Westport. Ponte Jr., J. G. and Reed, G. (1982), Bakery Foods. In:
Reed, G. (ed.). Prescott & Dunn’s Industrial Microbiology. AVI Publishing Company, Inc., Westport.
Thorn, A. J. and Ross, J. W. (1960), Determination of yeast growth in doughs. Cereal Chem, 37, 415-421. White, J. (1954), Yeast Technology. Chapman and Hall
Ltd., London.
![Table 2 - Experimental and calculated [Equations (10) to (15)] values of P for t p = 1.0 h P (mL/g.h) Experimental Calculated Difference (%) 140 140 (12)* 0 311 320 (11)* 2.9 329 330 (10)* 0.3 570 570 (13)* 0 575 560 (14)* - 2.6 575](https://thumb-eu.123doks.com/thumbv2/123dok_br/15955323.682276/4.892.83.790.134.289/table-experimental-calculated-equations-values-experimental-calculated-difference.webp)
