RESEARCH NOTE
http://dx.doi.org/10.1590/2317-1545v40n178801 Licence Creative Commons CC BY 4.0
The effect of longitudinal distribution and seed depth
on grain yield of common bean
1Pedro Marques da Silveira
2, Adriano Stephan Nascente
2*, José Geraldo da Silva
2ABSTRACT - The aim of this study was to quantify the longitudinal distribution of plants in the row and seed depth and their
effects on hypocotyl length and diameter and on yield components and grain yield of common bean, specifically the cultivar
BRSMG Realce in a Latossolo soil in the Cerrado (Brazilian tropical savanna). The data on plant distances in the row were
obtained in the field with the aid of a measuring tape in four rows of 2.5 m length. Seed depth was determined by measuring
the length of the hypocotyl that was within the soil after pulling up the plant. Hypocotyl diameter was evaluated at ground level using a digital caliper. Descriptive (univariate) statistical analysis was applied to the data. Linear correlations were established among distribution of distance between plants in the row, the depth of sowing, the characteristics of the hypocotyls, and grain yield data of common bean. Negative linear regression was observed between grain yield with sowing depth, and positive linear regression between hypocotyl diameter and longitudinal spacing between plants in the row. In the sowing process, special attention should be given to seed distribution in the row to avoid subsequent uneven plant distribution and to seed depth to avoid yield loss.
Index terms: Phaseolus vulgaris, hypocotyl diameter, hypocotyl length, plant spacing, sowing quality.
Distribuição longitudinal e profundidade da semente afetando a
produtividade de grãos do feijão-comum
RESUMO -Objetivou-se com o presente estudo quantificar a distribuição longitudinal de plantas na linha e profundidade da semente no solo e seus efeitos no comprimento e diâmetro do hipocótilo, nos componentes de produção e produtividade de grãos de feijão-comum, cultivar BRSMG Realce, em latossolo do Cerrado. Os dados da distância entre plantas na linha foram
obtidos em campo com o auxílio de trena em quatro linhas de feijão de 2,5 m de comprimento. A profundidade de semeadura
foi determinada medindo-se o comprimento do hipocótilo dentro do solo após o arranquio da planta. O diâmetro do hipocótilo foi avaliado ao nível do solo utilizando-se paquímetro digital. Os dados foram submetidos à análise estatística descritiva (univariada). Estabeleceram-se correlações lineares entre a distribuição da distância entre plantas na linha, da profundidade de semeadura e as características do hipocótilo e dados de produtividade de grãos do feijão-comum. Observou-se regressão linear negativa da produtividade de grãos com profundidade de semeadura e positiva com diâmetro do hipocótilo e espaçamento longitudinal entre plantas na linha. Especial atenção deve ser dada no processo de semeadura para evitar distribuição desuniforme de plantas da linha de semeadura e na profundidade da semente para evitar reduções na produtividade.
Termos para indexação: Phaseolus vulgaris, comprimento do hipocótilo, diâmetro do hipocótilo, espaçamento entre plantas, qualidade de plantio.
1Submitted on 04/20/2017. Accepted on 01/11/2018.
2Embrapa Arroz e Feijão, Caixa Postal 179, 75375-000 - Santo Antônio de Goiás, GO, Brasil.
Introduction
Dry edible bean or common bean (Phaseolus vulgaris) is a crop of considerable economic and social importance in many countries and one of the main sources of plant protein in the human diet. Crop yield is affected by various factors, such as diseases, insect pests, weeds, mineral nutrients, environmental conditions, seeds, and sowing density (Didonet and Costa, 2004). Controlling sowing density is among the practices that lead to increased yield. Sowing density must be well assessed since it is directly related to yield components and crop yield (Azevedo et al., 2008).
However, even at adequate densities, the sowing process can bring about bad seed distribution in the row and seed placement at depths greater than planned. Plants may be very near one another in the row and will compete, one inhibiting the development of others. Longer hypocotyl lengths may negatively affect crop yield. In any crop, sowing depth and seed distribution in the row should be adequate to ensure seed germination and seedling emergence and development (Martins et al., 1999; Rodrigues et al., 2016). According to Cortez et al. (2006), all plant spacings from 0.5 to 1.5 times the mean spacing (MS) expected is considered acceptable. Values outside this limit are considered missing plants (more than 1.5 times the MS) or multiple plants (less than 0.5 times the MS).
The depth of seed placement is specific for each species and, when adequate, leads to uniform germination and seedling emergence (Sousa et al., 2007; Trogello et al., 2013). Excessive sowing depths can impede the still fragile seedling from emerging from the soil. In contrast, if seeds are sown shallow, they are exposed to any environmental variation, such as water or heat stress through excess or deficit, and this may give rise to small and weak seedlings (Silva et al., 2008). Modolo et al. (2010) reported that irregularity in common bean seed depth can lead to big yield losses. For Trogello et al. (2008), sowing common bean at a depth of 4.5 cm exhibited the best final stand, as opposed to depths of 3 cm and 6 cm.
According to Silveira et al. (2013), uniformity of seed longitudinal distribution is one of the characteristics that most contribute to adequate plant stand and to improved crop yield. Rambo et al. (2003) and Silveira et al. (2005) affirmed that equidistant plant spacing results in less intra-specific competition and increases yield. Branquinho et al. (2004) studied seed distribution along the soybean planting row and concluded that more than half the seeds were deposited with inadequate spacing, causing significant yield reduction. With inadequate longitudinal distribution and greater seed depths, dominated plants may appear, i.e., plants from lower germination speed, and they will be shaded by dominant
plants. This will reduce yield per plant and affect yield per area (Azevedo et al., 2008).
Thus, the sowing process is an important activity in setting up crops and it must be carefully performed to obtain adequate populations at the right depth and with equally spaced plants. Otherwise, the whole investment made will not result in yield gain. However, there are practically no studies on the effect of longitudinal distribution and of seed depth in the common bean crop (Teixeira et al., 2013). The need therefore arises to investigate these factors to ascertain their real effect on final crop yield. Given this situation, the aim of this study was to quantify longitudinal distribution and seed depth and observe their effects on hypocotyl length and diameter and on yield components and grain yield of common bean in a Latossolo of the Cerrado (Brazilian tropical savanna).
Materials and Methods
The experiment was conducted in the 2016/2017 summer crop season on the Capivara Farm of ‘Embrapa Arroz e Feijão’, located in the municipality of Santo Antônio de Goiás, GO, Brazil, at 16º28’00” S and 49º17’00” W, at 823 m altitude. Climate in the region is tropical savanna, considered as type Aw in the Köppen classification. There are two well-defined seasons, normally dry from May to September (fall/winter) and rainy from October to April (spring/summer). Mean annual rainfall is from 1500 to 1700 mm. Mean annual temperature is 22.7 °C, ranging annually from 14.2 °C to 34.8 °C.
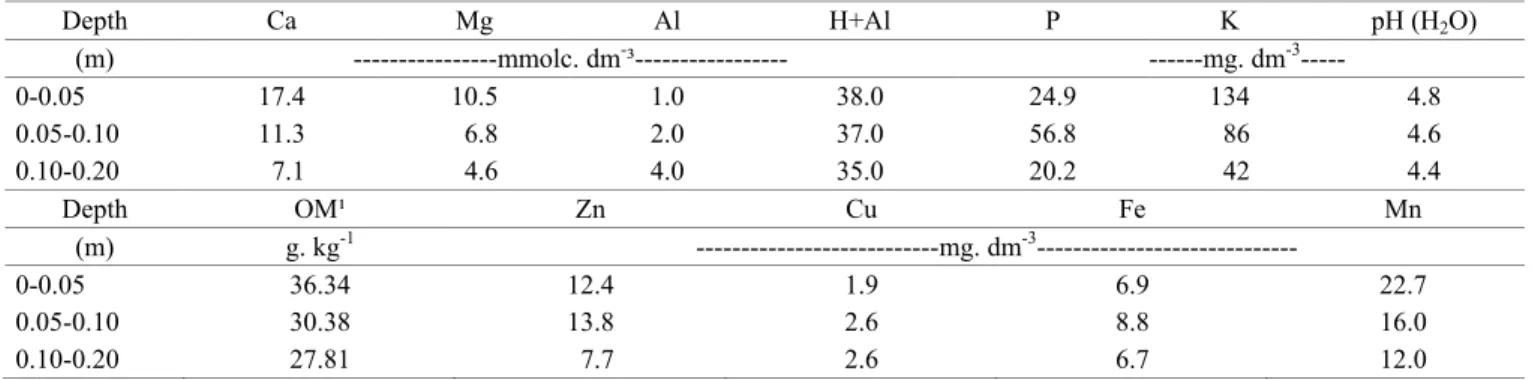
The soil was classified as a Latossolo Vermelho ácrico (Embrapa, 2006). Before setting up the experiment, in November 2016, chemical analyses were performed on samples from a depth of 0-0.20 m for characterization of the experimental area (Table 1). Chemical analyses were performed according to the methodology proposed by Donagema et al. (2011). The experimental area had been cropped under a no-tillage system with a maize and soybean rotation in the summer.
Sowing of common bean, cultivar BRSMG Realce, type I, upright plant, without branching and with a determined growth habit (Melo et al., 2014), was performed mechanically on 11/07/2016 at a fixed spacing of 0.45 m between rows, and the planter was regulated for 10 plants.m-1. A 5-row
fertilizing planter was used, pulled by a tractor, with a hydraulic lift system with remote control. Seed was supplied by a perforated horizontal disk and a guillotine-effect furrow opener. Fertilizer was applied by area, based on soil analysis (Sousa and Lobato, 2004) in the amount of 300 kg.ha-1 of a
Table 1. Soil chemical attributes of the area before setting up the experiment. 2016/2017 crop season.
Depth Ca Mg Al H+Al P K pH (H2O)
(m) ---mmolc. dm-³--- ---mg. dm-3---
0-0.05 17.4 10.5 1.0 38.0 24.9 134 4.8
0.05-0.10 11.3 6.8 2.0 37.0 56.8 86 4.6
0.10-0.20 7.1 4.6 4.0 35.0 20.2 42 4.4
Depth OM¹ Zn Cu Fe Mn
(m) g. kg-1 ---mg. dm-3---
0-0.05 36.34 12.4 1.9 6.9 22.7
0.05-0.10 30.38 13.8 2.6 8.8 16.0
0.10-0.20 27.81 7.7 2.6 6.7 12.0
¹OM – organic matter.
Seedling emergence occurred at five days after sowing. In the V4 phenological stage (third trifoliate leaf), fertilizer was topdressed at the rate of 60 kg.ha-1 of N in the form of urea.
The beans were harvested on 01/24/2017.
Data were collected at random in the crop area. Thus, with the aid of a measuring tape, four 2.5 meter rows were chosen at random for evaluation. The following measurements were performed: total longitudinal distribution of the plants in the planting row (sum of the distance of the plant of interest to the previous plant and to the subsequent plant), minimum and maximum distance of each plant in the row in relation to the other, length of the hypocotyl in the soil (based on this information, seed depth in relation to the soil surface was estimated), hypocotyl diameter at ground level (measured with the aid of a digital caliper rule in all the plants), number of pods, number of seeds, and grain weight from each plant.
Descriptive (univariate) statistical analysis was applied to the data collected, and in analysis of variance of the results, the descriptive statistical parameters calculated were considered, namely, the minimum and maximum values, the mean, median, standard deviation, and coefficient of variation. The dispersion measures allowed visualization of the dimension of dispersion of the values observed in relation to the mean, and of asymmetry and kurtosis, to analyze the type and the shape of the distribution curve of the results of each variable evaluated. The asymmetry and kurtosis values found for the data were compared to the lower and upper limits at a significance level of 5%. The Shapiro-Wilk test was performed to verify the normality of the data, testing the null hypothesis that the sample belongs to a population with normal distribution, using the statistic W (0 < W < 1); if W is equal to 1, the data perfectly fit normal distribution, whereas small values of W are evidence of deviations from normality. The value of the statistic and the associated p-value were obtained; if this p-value was less than the nominal value of significance p ≤ 0.01, the null hypothesis of normality was rejected. The data were not transformed. The aim was to check for a central
tendency, normality, and dispersion of the original data.
The Pearson correlation matrix was established for the purpose of making linear correlations for the combinations, two by two, among all the attributes studied, as well as presenting the regression analyses for the pairs of greatest interest.
Results and Discussion
Seed density in the planting row was projected to obtain a mean of 10 plants per meter, i.e., each plant should be at a distance of around 10 cm distance from the previous plant and 10 cm from the subsequent plant. Analyzing only the mean (11.93 cm) and median (11.25 cm), these values approximated the projected value (Table 2). However, the amplitude was relatively large, ranging from 1 cm to 28 cm. This showed that plants were doubled up or missing (Cortez et al., 2006). The very small distance between plants can cause greater competition between them and reduce yield per plant and per area. In contrast, greater distances between plants may mean reduction in yield per area since the plants utilize smaller total areas and leave more empty spaces, giving weeds a chance to arise. During the process of setting up crops, there may be shortcomings and sowing might not be performed adequately, resulting in plants not distributed in an equidistant manner. According to Silveira et al. (2005), one of the characteristics that most contribute to adequate plant stand and to improvement of crop yield is uniformity of the longitudinal distribution of seeds. Thus, an individual within a population experiences the effects of restriction on growth rate according to the presence and arrangement of neighbors in the plant population (Mondo et al., 2012). More equidistant distributions reduce these effects of restriction and contribute so that plants more completely and efficiently utilize the resources of a determined soil area (Freitas et al., 2013).
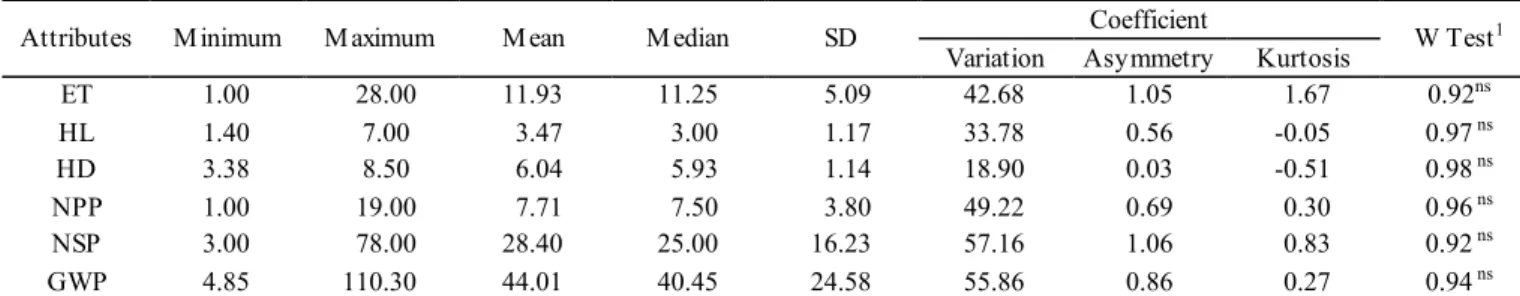
Table 2. Minimum, maximum, mean, median, standard deviation (SD), coefficients of variation, asymmetry, and kurtosis
values, and the W Test of Shapiro-Wilk for total transversal distance between plants (ET), hypocotyl length in the soil (HL), hypocotyl diameter at ground level (HD), number of pods per plant (NPP), number of seeds per plant (NSP), and grain weight per plant (GWP) obtained from evaluation of 80 common bean plants, cultivar BRSMG Realce, 2016/2017 crop season.
Attributes M inimum M aximum M ean M edian SD Coefficient W Test1
Variation Asymmetry Kurtosis
ET 1.00 28.00 11.93 11.25 5.09 42.68 1.05 1.67 0.92ns
HL 1.40 7.00 3.47 3.00 1.17 33.78 0.56 -0.05 0.97 ns
HD 3.38 8.50 6.04 5.93 1.14 18.90 0.03 -0.51 0.98 ns
NPP 1.00 19.00 7.71 7.50 3.80 49.22 0.69 0.30 0.96 ns
NSP 3.00 78.00 28.40 25.00 16.23 57.16 1.06 0.83 0.92 ns
GWP 4.85 110.30 44.01 40.45 24.58 55.86 0.86 0.27 0.94 ns
1) Shapiro-Wilk Test (W) for normal distribution; ns: not significant. Not significant indicates that the hypothesis for normal distribution is accepted.
plants dominated by neighboring plants (dominant plants), whose seedlings emerged more rapidly (Azevedo et al., 2008; Modolo et al., 2010), as occurred in this experiment in which hypocotyl length in the soil ranged from 1.7 cm to 7.0 cm; this indicated that seed depth was variable. In this situation, the lack of uniformity in speed of emergence will affect plant development; seedlings that emerge first will shade the seedlings that emerge later (Pommel et al., 2002). In addition, seedlings with delayed emergence have less shoot and root system growth, resulting in lower ability to compete for water, light, and nutrients (Azevedo et al., 2008).
In the present experiment, there was also lack of uniformity in hypocotyl diameter, which ranged from 3.38 cm to 8.50 cm (Table 2). In the other characteristics evaluated, there were also big variations: in the number of pods per plant, which ranged from 1 to 19; in the number of seeds per plant, which ranged from 3 to 78; and in grain weight per plant, which ranged from 4.85 g to 110.30 grams. These values indicate that the sowing process was inefficient and brought about significant differences in important characteristics that define crop yield. According to Kachman and Smith (1995), a good acceptable level of precision between maximum and minimum values are variations up to 29%. Based on our results, all the parameters evaluated were higher than this value. One of the factors that may have caused this lack of uniformity in the parameters evaluated is planter adjustment, especially in operating speed. In an evaluation of nine fertilizing planters of maize at three different speeds, Mantovani and Bertaux (1990) found that, in general, longitudinal distribution of seeds was irregular and outside the acceptable limits, tending to become more irregular as forward speed increased. For Delafosse (1986), Kurachi et al. (1989), Garcia et al. (2006), and Santos et al. (2011), operating speed is the variable that most affects planter performance. It affects longitudinal distribution of
seeds in the planting furrow and the depth of seeds in relation to ground level, which affects crop yield.
The mean was greater than the median in all the variables evaluated, which indicates a positive asymmetry, i.e., displacement of the mean of the population to the left (Table 2). The data were positive in regard to the asymmetry coefficient. This indicates distribution with an asymmetric tail that extends in the direction of more positive values. Positive kurtosis values indicate that the data were more concentrated around the mean (total spacing, number of pods per plant, number of seeds per plant, and grain weight) and the negative values indicate that they were slightly distanced from the mean (hypocotyl length within the soil and hypocotyl diameter). The Shapiro-Wilk test indicated that all the variables evaluated had a normal distribution pattern.
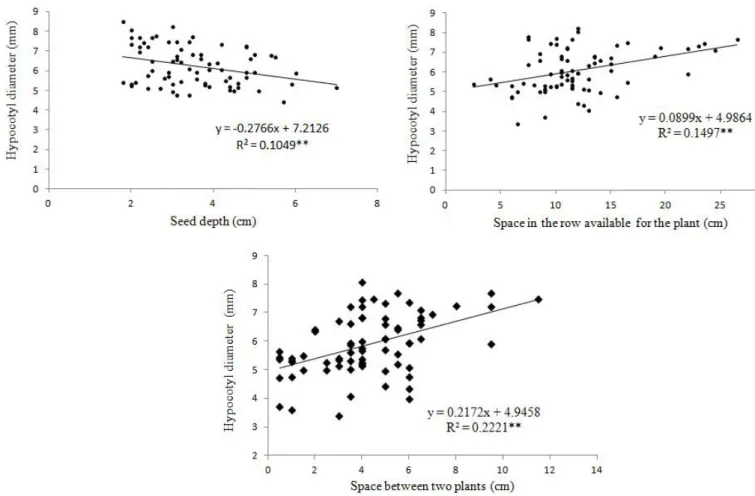
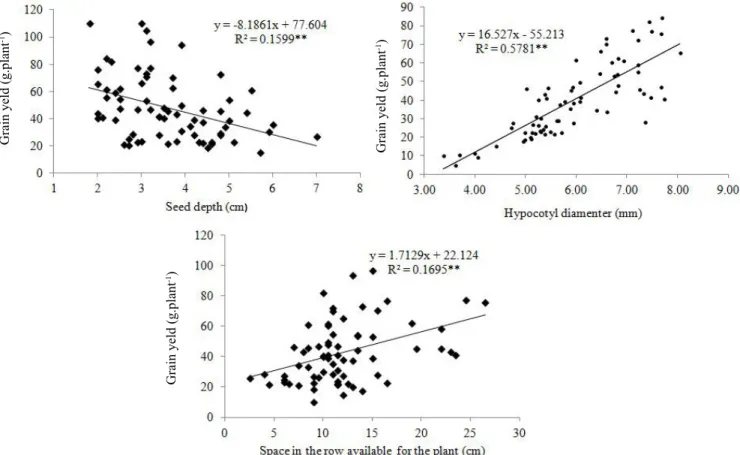
plant (Figure 1). In grain yield, there was a negative linear regression with seed depth, and a positive linear regression with hypocotyl diameter and longitudinal distance between plants in the row (Figure 2). Rocha et al. (2015) also observed positive correlations between common bean grain yield and hypocotyl diameter.
The results obtained showed that errors can occur during crop sowing that can compromise the investment made. The
sowing process must be performed in an adequate way to provide uniformity in seed depth and in longitudinal distance between plants. Uneven stands with big differences in longitudinal distances between plants in the planting row and in seed depth lead to an increase in dominated plants, which cause significant reductions in yield per plant and per area.
Conclusions
Table 3. Pearson linear correlation between the total distance of the plant in the row (TDR), hypocotyl length in the soil (HL), hypocotyl diameter at ground level (HD), number of pods per plant (NPP), number of seeds per plant (NSP), and grain weight per plant (GWP) obtained in evaluation of 80 common bean plants, 2016/2017 crop season.
Attributes TDR HL HD NPP NSP GWP
TDR 1.000 -0.102ns 0.246* 0.129*s 0.148 ns 0.354**s
HL - 1.000 -0.148 ns -0.191 ns -0.244* -0.204 ns
HD - - 1.000 0.705** 0.725** 0.727**
NPP - - - 1.000 0.947** 0.945**
NSP - - - - 1.000 0.981**
GWP - - - 1.000
ns, * and **: Not significant, significant at 5% and 1%, respectively, by the t test.
Figure 2. Relation between plant yield and seed depth, hypocotyl diameter, and total space available for the plant in the common bean crop.
Lack of uniformity in depth and in longitudinal distance of seeds in the planting row leads to significant variations in hypocotyl diameter, number of pods per plant, number of seeds per plant, and grain yield per plant in common bean.
There is a significant correlation between hypocotyl diameter and the yield components and grain yield in common bean.
There is negative linear regression between grain yield of common bean and seed depth, and a positive linear regression between grain yield and hypocotyl diameter and longitudinal spacing between plants in the planting row.
Acknowledgments
Our thanks to Embrapa for funding this study and to the CNPq for the research productivity scholarships to the first and second authors.
References
AZEVEDO, J.A.; SILVA, E.M.; RODRIGUES, G.C.; GOMES,
A.C. Produtividade do feijão de inverno influenciada por irrigação,
densidade de plantio e adubação em solo de Cerrado. Planaltina: Embrapa Cerrados, 2008. 4p. http://bbeletronica.cpac.embrapa.
br/2008/comtec/comtec_145.pdf
BRANQUINHO, K.B.; FURLANI, C.E. A.; LOPES, A.; SILVA, R.P. Desempenho de uma semeadora-adubadora direta, em função da velocidade de deslocamento e do tipo de manejo da biomassa da cultura de cobertura do solo. Engenharia Agrícola, v.24, n.2,
p.374-380, 2004. http://www.scielo.br/scielo.php?script=sci_ arttext&pid=S0100-69162004000200016
CORTEZ, J.W.; FURLANI, C.E.A.; SILVA, R.P.; LOPES, A. Distribuição longitudinal de sementes de soja e características físicas do solo no plantio direto. Engenharia Agrícola, v.26, n.2,
p.502-510, 2006. http://www.scielo.br/scielo.php?script=sci_ arttext&pid=S0100-69162006000200019&lng=en&nrm=iso
DELAFOSSE, R.M. Máquinas sembradoras de grano grueso:
descripcion y uso. Santiago: Oficina Regional de La FAO para
America Latina y el Caribe, 1986. 48 p.
DIDONET, A.D.; COSTA, J.G.C. Plant population and yield of early dry beans. Pesquisa Agropecuária Tropical, v.34, n.2, p.105-109,
2004. https://www.revistas.ufg.br/pat/article/view/2333/2300
Grain yeld (g.plant
-1)
Grain yeld (g.plant
-1)
Grain yeld (g.plant
DONAGEMA, G.K.; CAMPOS, D.V.B.; CALDERANO, S.B.; TEIXEIRA, W.G. Manual de métodos de análise de solo. 2nd ed.
Rio de Janeiro: Embrapa Solos, 2011. 230 p. https://www.embrapa.
br/busca-de-publicacoes/-/publicacao/990374/manual-de-metodos-de-analise-de-solo
EMBRAPA - Centro Nacional de Pesquisa de Solos. Sistema
Brasileiro de Classificação de Solos. 2 ed. Rio de Janeiro: Embrapa
Solos. 2006. 306p. https://www.agrolink.com.br/downloads/sistema-brasileiro-de-classificacao-dos-solos2006.pdf
FREITAS, R.J.; NASCENTE, A.S.; SANTOS, F.L.S. População de plantas de milho consorciado com Urochloa ruziziensis. Pesquisa Agropecuária Tropical, v.43, n.1, p.79-87, 2013. http://www.scielo.
br/pdf/pat/v43n1/11.pdf
GARCIA, L.C.; JASPER, R.; JASPER, M.; FORNARI, A.J.;
BLUM, J. Influência da velocidade de deslocamento na semeadura
do milho. Engenharia Agrícola, v. 26, n.2, p. 520-527, 2006. http://
www.scielo.br/pdf/eagri/v26n2/21.pdf
KACHMAN, S. D.; SMITH, J. A. Alternative measures of accuracy in plant spacing for planters using single seed metering. Transactions of the ASAE, v. 38, n. 2, p. 379-387, 1995.
http://agris.fao.org/agris-search/search.do?recordID=US9549054
KURACHI, S.A.H.; COSTA, J.A.S.; BERNARDI, J.A.; COELHO, J.L.D.; SILVEIRA, G.M. Avaliação tecnológica de semeadoras e/ou adubadoras: tratamento de dados de ensaio e regularidade de distribuição longitudinal de sementes. Bragantia, v.48, n.2, p.249-62, 1989. http://www.
scielo.br/scielo.php?script=sci_arttext&pid=S0006-87051989000200011
MANTOVANI, E. C.; BERTAUX, S. Avaliação do desempenho
de semeadoras-adubadoras de milho no campo. Relatório de Ensaio. Sete Lagoas: Centro Nacional de Pesquisa de Milho e
Sorgo – EMBRAPA, 1990. 50p. https://www.embrapa.br/busca-
de-publicacoes/-/publicacao/476532/avaliacao-do-desempenho-de-semeadoras-adubadoras-de-milho-no-campo
MARTINS, C.C.; NAKAGAWA, J.; BOVI, M.L.A. Efeito da posição da semente no substrato e no crescimento inicial das plântulas de palmito-vermelho (Euterpe espiritusantensis Fernandes - Palmae).
Revista Brasileira de Sementes, v.21, n.1, p.164-173, 1999. http://
www.bibliotekevirtual.org/revistas/RBS/v21n01/v21n01a25.pdf
MELO, L.C.; ABREU, A.L.F.L.B.; RAMALHO, M.A.P.; CARNEIRO, J.E.S.; PAULA JÚNIOR, T.J.; PELOSO, M.J.; PEREIRA, H.S.; FARIA, L.C.; PEREIRA FILHO, I.A.; MOREIRA, J.A.A.; MARTINS, M.; VIEIRA, R.F.; MARTINS, F.A.D.; COELHO, M.A.O.; COSTA, J.G.C.; WENDLAND, A.; SANTOS, J.; DIAZ, J.L.C.; CARNEIRO, P.C.S.; GIÚDICE, M.P.; FARIA, J.C. BRSMG Realce: Common bean cultivar with striped grains for the state of Minas Gerais. Crop Breeding and Applied Biotechnology,
v.14, p.61-64, 2014. http://www.scielo.br/scielo.php?script=sci_ arttext&pid=S1984-70332014000100010
MONDO, V.H.V.; CICERO, S.M.; DOURADO-NETO, D.; PUPIM, T.L.; DIAS, M.A.N. Vigor de sementes e desempenho de plantas de milho. Revista Brasileira de Sementes, v. 34, n.1
p.143-155, 2012. http://www.scielo.br/scielo.php?script=sci_ arttext&pid=S0101-31222012000100018
MODOLO, A.J.; TROGELLO, E.; NUNES, A.L.; FERNANDES, H.C.; SILVEIRA, J.C.M.; DANRÓS, M.P. Efeito de cargas aplicadas e profundidades de semeadura no desenvolvimento da cultura do feijão em sistema plantio direto. Ciência e Agrotecnologia, v.34,
n.3, p.739-745, 2010. http://www.scielo.br/scielo.php?script=sci_ arttext&pid=S1413-70542010000300029&lng=en&nrm=iso
MOURA, M.M.; CARNEIRO, P.C.S.; CARNEIRO, J.E.S.; CRUZ, C.D. Potencial de caracteres na avaliação da arquitetura de plantas de feijão. Pesquisa Agropecuária Brasileira, v. 48, n. 4, p. 417-425,
2013. http://www.scielo.br/pdf/pab/v48n4/10.pdf
POMMEL, B.; MOURAUX, D.; CAPPELLEN, O.; LEDENT, J.F.
Influence of delayed emergence and canopy skips on the growth and
development of maize plants: a plant scale approach with CERES-Maize.
European Journal of Agronomy, v.16, n.4, p.263-277, 2002. http://
ac.els-cdn.com/S1161030101001307/1-s2.0-S1161030101001307-main.pdf?_tid=9788b11e-252f-11e7-b366-00000aab0f01&acdnat=149 2627379_53fe5b4011ec1aef24dc0a94279b39f0
RAMBO, L.; COSTA, J.A.; PIRES, J.L.F.; PARCIANELLO, G.; FERREIRA, F.G. Rendimento de grãos de soja em função do arranjo de plantas. Ciência Rural, v.33, n.3, p. 405-411, 2003. http://www.scielo.
br/scielo.php?script=sci_arttext&pid=S0103-84782003000300003
ROCHA, G.S.; CARNEIRO, J.E.S.; CARNEIRO, P.C.S.; POERSCH, N.L.; LIMA, M.S.; SILVA, L.C. Estratégias de predição e efeitos de ambientes na avaliação de populações segregantes de feijão. Revista Ceres, v. 62, n. 5, p. 438-445, 2015. http://www.scielo.br/pdf/rceres/
v62n5/2177-3491-rceres-62-05-00438.pdf
RODRIGUES, A.J.R.; BATISTA, E.M.C.; OLIVEIRA, L.M.;
SOUZA, P.B. Influência da profundidade e posição de semeadura na emergência de Acacia polyphylla DC. Revista Verde de Agroecologia e Desenvolvimento Sustentável, v.11, n.1, p.23-29, 2016. http://www.
gvaa.com.br/revista/index.php/RVADS/article/view/3812
SANTOS, A.J.M.; GAMERO, C.A.; OLIVEIRA, R.B.; VILLEN, A.C. Análise espacial da distribuição longitudinal de sementes de milho em uma semeadora-adubadora de precisão. Bioscience Journal, v.27, n. 1, p.16-23, 2011. http://www.seer.ufu.br/index.php/
biosciencejournal/article/view/7355
SILVA, R.P.; CORÁ, J.E.; CARVALHO FILHO, A.; FURLANI, C.E.A.; LOPES, A. Efeito da profundidade de semeadura e de rodas compactadoras submetidas a cargas verticais na temperatura e no teor de água do solo durante a germinação de sementes de milho. Ciência e Agrotecnologia, v.32, n.3, p.929-937, 2008. http://www.scielo.br/
scielo.php?script=sci_arttext&pid=S1413-70542008000300034
SILVEIRA, J.C.M.; FERNANDES, H.C.; MODOLO, A.J.; SILVA, S.L.; TROGELLO, E. Demanda energética de uma semeadora-adubadora em diferentes velocidades de deslocamento e rotações do motor. Revista Ciência Agronômica, v.44, p.44-52, 2013. http://
www.ccarevista.ufc.br/seer/index.php/ccarevista/article/view/1819
SILVEIRA, J.C.M.; MODOLO, A.J.; SILVA, S.L.; GABRIEL
FILHO, A. Força de tração e potência em duas velocidades de
deslocamento e duas profundidades de deposição de sementes.
Revista Engenharia Agrícola e Ambiental, v.9, n.1, p.125-128, 2005.
SOUSA, D. M. G.; LOBATO, E. Cerrado: correção do solo e adubação. 2.ed. Brasília, DF: Embrapa, 2004. 416 p.
SOUSA, A.H.; RIBEIRO, M.C.C.; MENDES, V.H.C.; MARACAJA, P.B.; COSTA, D.M. Profundidades e posições de semeadura na
emergência e no desenvolvimento de plântulas de moringa. Revista Caatinga, v.20, n.4, p.56-60, 2007. https://periodicos.ufersa.edu.br/
index.php/caatinga/article/view/56/220
TEIXEIRA, S.S.; REIS, A.V.; MACHADO, A.L.T. Longitudinal distribution of bean seeds in horizontal plate meter operating with one or two seed outlets. Engenharia Agrícola, v.33, n.3,
p.569-574, 2013. http://www.scielo.br/scielo.php?script=sci_ arttext&pid=S0100-69162013000300013
TROGELLO, E.; MODOLO, A.J.; NUNES, A.L.; DAMBROS, M.P.; PORTES, E.S. Efeito de diferentes profundidades de semeadura e cargas aplicadas pela roda compactadora sobre a população de plantas e produtividade da cultura do feijão. Synergismus scyentifica,
v.3, n. 4, p. 1-4, 2008. http://revistas.utfpr.edu.br/pb/index.php/ SysScy/article/viewFile/293/95
TROGELLO, E.; MODOLO, A.J.; SCARSI, M.; SILVA, C.L.; ADAMI, P.F.; DALLACORT, R. Manejos de cobertura vegetal e velocidades de operação em condições de semeadura e produtividade de milho. Revista Brasileira de Engenharia Agrícola e Ambiental, v.17, n.7, p.796–802, 2013. http://www.scielo.br/scielo.
php?script=sci_arttext&pid=S1415-43662013000700015