Correlation between craniofacial growth and upper and
lower body heights in subjects with Class I occlusion
Thikriat S. Al-Jewair1, Charles Brian Preston1, Carlos Flores-Mir2, Paul Ziarnowski1
Objective: To correlate skeletal age, standing height, upper and lower body lengths, and selected craniofacial growth features in a sample of growing individuals, and to model craniofacial growth using multivariate regression. Methods: This was a retrospective cross-sectional study with 447 African black boys and girls, between the ages 8 and 16 years, who attended the dental clinic at one hospital. The skeletal matura-tional age was determined from hand-wrist radiographs using the Greulich and Pyle atlas. Craniofacial measurements representing maxillary length (Ar-ANS), mandibular length (Ar-Gn), and lower facial height (ANS-Me) were calculated from lateral cephalograms in habitual occlusion. Body lengths were clinically measured in centimeters. Results: Moderate correlations (r=0.42 to 0.68) were observed between skeletal age and the three selected craniofacial measurements. Statistically significant correlations were also found between the craniofacial measurements and both upper and lower body lengths. The mandibular length had a stronger correlation with the upper body length than with the lower body length. Multiple regression analyses to determine maxillary and mandibular lengths suggested that sex, upper and lower body lengths might be used to determine maxillary length; while skeletal age, upper and lower body lengths might help determine mandibu-lar length. Conclusions: Based on the relatively strong correlation between upper body length and mandibumandibu-lar length, further research in this area may warrant its use as a predictor for mandibular growth modification timing.
Keywords: Skeletal maturity. Height. Mandible. Craniofacial growth.
1 State University of New York at Buffalo, Department of Orthodontics (New
York, USA).
2 University of Alberta, Faculty of Medicine and Dentistry, School of Dentistry,
Division of Orthodontics (Edmonton, Canada).
» The authors report no commercial, proprietary or financial interest in the products or companies described in this article.
Submitted: November 18, 2016 - Revised and accepted: May 09, 2017
DOI: https://doi.org/10.1590/2177-6709.23.2.037-045.oar
How to cite: Al-Jewair TS, Preston CB, Flores-Mir C, Ziarnowski P. Correla-tion between craniofacial growth and upper and lower body heights in subjects with Class I occlusion. Dental Press J Orthod. 2018 Mar-Apr;23(2):37-45. DOI: https://doi.org/10.1590/2177-6709.23.2.037-045.oar
Contact address: Thikriat S. Al-Jewair
State University of New York at Buffalo, New York, USA 140 Squire Hall, 3435 Main Street
Buffalo, NY 14214 USA E-mail: [email protected]
Objetivo: correlacionar a idade esquelética, a estatura, as alturas corporais superior e inferior, e algumas características específicas do crescimento craniofacial, em uma amostra de indivíduos em crescimento, e delinear o crescimento craniofacial usando regressão multivariada. Métodos: esse estudo transversal retrospectivo foi feito com 447 meninos e meninas negros africanos, com idades entre 8 e 16 anos, atendidos na clínica odontológica de um hospital. A maturação esquelética, em anos, foi determinada a partir de radiografias de mão e punho, usando o atlas de Greulich e Pyle. As medidas craniofaciais representando o comprimento maxilar (Ar-ENA), o comprimento mandibular (Ar-Gn) e a altura facial anterior inferior (ENA-Me) foram calculadas a partir de cefalogramas laterais em oclusão habitual. Os comprimentos corporais foram medidos clinicamente, em centímetros. Resultados: correlações moderadas (r = 0,42 a 0,68) foram observadas entre a idade esquelética e as três medidas craniofaciais selecionadas. Também foram encontradas correlações estatisticamente significativas entre as medidas craniofaciais e as alturas corporais superior e inferior. O comprimento mandibular teve uma correlação mais forte com a altura corporal superior do que com a inferior. As análises de regressão múltipla para determinar os comprimentos maxilar e mandibular sugeriram que o sexo e as alturas corporais superior e inferior podem ser usados para determinar o comprimento maxilar, enquanto a idade esquelética e as alturas corporais superior e in-ferior podem ajudar a determinar o comprimento mandibular. Conclusões: com base na correlação relativamente forte entre a altura corporal superior e comprimento mandibular, pesquisas adicionais nessa área poderiam justificar seu uso como indicador para o período de modificação do crescimento mandibular.
INTRODUCTION
One of the treatment modalities in Orthodontics in-volves the use of orthopedic appliances in an attempt to modify dentofacial skeletal growth. These appliances ap-pear to be more effective when used around adolescent skeletal growth spurt.1
Several skeletal growth indicators have been used to identify the periods of acceleration, spurt, and de-celeration during adolescent skeletal maturation. These include standing height, changes in upper and lower body proportions, secondary sexual matura-tional characteristics, dental development, insulin-like growth factor-1 (IGF-1) and IGF binding protein-3, and radiographic assessment of skeletal maturation us-ing cervical vertebrae or hand-wrist.2-7 The hand-wrist radiographs are still considered the reference standard in predicting overall skeletal maturation.8
It has been established that upper and lower body com-ponents showcase different patterns of growth.9 The peak in growth of the lower body (i.e., long bones) occurs on average one year before the peak in growth of the upper body (i.e., vertebral column);8 while increments in the upper body are larger than those of the lower body.8,10
Changes in standing height could be used with some success to imply the occurrence of craniofacial growth
spurt11. Nonetheless, only one study has correlated
changes in upper and lower body dimensions with cra-niofacial growth. Cozza et al12 investigated this correla-tion in the pre-pubertal period on a sample of Caucasian patients using clinical anthropometric measurements. They concluded that none of the body measurements was accurate indicator of craniofacial growth during the pre-pubertal phase. No follow up study is available to as-sess the potential strength of those correlations during adolescence. Therefore, the aims of the present retrospec-tive study were to: 1) evaluate the correlation between skeletal maturation (hand-wrist radiographs), upper body length (sitting height), lower body length (leg length), and selected cephalometric measurements among Afri-can blacks aged 8-16 years; and 2) identify if upper and lower body lengths can independently determine cranio-facial growth during adolescence.
MATERIAL AND METHODS
The study was approved by the University at Buf-falo Health Sciences Institutional Review Board. This retrospective cross-sectional study examined the
cor-relation between different anthropometric measure-ments from the records of 447 (228 females and 219 males) African black urban children with
chronologi-cal ages between 8-16 years13 (females: 12.1±2.3 and
males: 12.5±2.1 years old). The subjects were ran-domly selected patients attending the dental clinic at one hospital. Assent was obtained from parents of all children before data collection. Records collected in-cluded demographics (chronological age and sex), left hand-wrist radiographs, lateral cephalograms, stand-ing height in centimeters, sittstand-ing height, and body mass in kilograms. The inclusion criteria were healthy and well-nourished boys and girls, with Class I skel-etal and dental occlusion; no previous orthodontic treatment received or required. The exclusion crite-ria were the presence of syndromes, systemic diseases such as metabolic bone diseases, developmental dis-turbances, long-term medications, or premature loss of permanent teeth.
The left hand-wrist radiographs were obtained us-ing the same machine and with a standardized target to film distance of 75 centimeters. The second edition of the Greulich and Pyle atlas14 was used to determine the skeletal maturational age. This method (GP) uses series of standard plates to be compared with the subjects’ hand-wrist radiographs so that their matu-rational age using maturity indicators of individual ossification centers is obtained. The values assigned to each ossification center were used to determine an average skeletal age of each subject. One calibrated operator who was blinded to the chronological ages conducted all measurements. All the records were de-identified at the time of data collection.
Systematic error was assessed using 40 random-ly selected radiographs with equal sex distribution obtained from the GP atlas by an independent ob-server. The mean error was 4.1 ± 3 months (stan-dard error of the mean = 0.84 months, t-value = 0.68, 0.05 > P > 0.01). Intra-operator error was calculated us-ing 39 radiographs (17 males and 22 females) obtained from the sample collected for this study. The mean error was -0.36 ± 5.90 months (standard error of the mean = 0.97 months, t-value = 0.39, P < 0.05).
radio-graphs was 5.8%. One author manually traced and analyzed the cephalograms using a number of land-marks. Measurements used to the nearest 0.5 mm were the lower anterior facial height (LAFH), mea-sured between the anterior nasal spine (ANS) and menton (Me); the mandibular unit length, measured from Articulare (Ar) to Gnathion (Gn); the maxillary
unit length, measured from Ar to ANS.15,16 The
cen-ter of the section where the ANS is 3mm in thickness was used. Intra-operator error was less than 1% and not statistically or clinically significant.
Standing height (stature) was measured by using the horizontal arm of the anthropometer on a clinical scale. The subjects were instructed to stand with their heels together, soles in contact with the platform, stretching upward to the fullest extent, aided by the measurer, who exerted gentle pressure on the mastoid processes. The subject’s back was kept straight as pos-sible, with the Frankfurt plane parallel to the floor. The recording arm of the anthropometer was then lowered on the subject’s head. Measurements were taken to the nearest 1 mm, with the horizontal arm lightly in contact with the child’s head. Contact of the measuring arm was made as close to the midsag-ittal plane of the skull as possible, and tangent to the highest point of the head in the median plane.
Upper body length (sitting height) in centime-ters included trunk length plus head length (vertex to subischial plane). A bench was placed over the plat-form of the clinical scale, of such a height that it al-lowed the subjects to sit with their unsupported feet hanging over the edge. Measurements were taken with the child’s back stretched up straight and with the back of the knees directly over the edge of the seat. Exten-sion of the spine was encouraged in the same way as for the standing height, while the head was postured in the Frankfurt plane. The bench was 35 cm in height and was subtracted from the total sitting height.
Lower body length (leg length) in centimeters (fe-mur plus tibia) was obtained by subtracting standing from sitting height, to compare growth of long bones to upper body, including vertebral column.
Statistical analysis
Descriptive statistics for all variables were calcu-lated. Independent samples t-test was used to identify differences between females and males in the body
lengths and craniofacial measurements at each skel-etal age (rounded to the nearest year). Normal data distribution was observed. Pearson correlation
coef-ficients17 were calculated for the chronological and
skeletal ages, standing height, upper and lower body lengths, and craniofacial measurements. Correlations were two-tailed and interpreted at the 1% and the 5% significance levels, with the Bonferroni adjust-ment applied for multiple testing. A stepwise multiple linear regression with backward elimination was used to determine predictors of craniofacial growth pat-terns, while controlling for chronological and skeletal ages, sex, and upper and lower body lengths. Data were analyzed using PASW for Windows version 20.
RESULTS
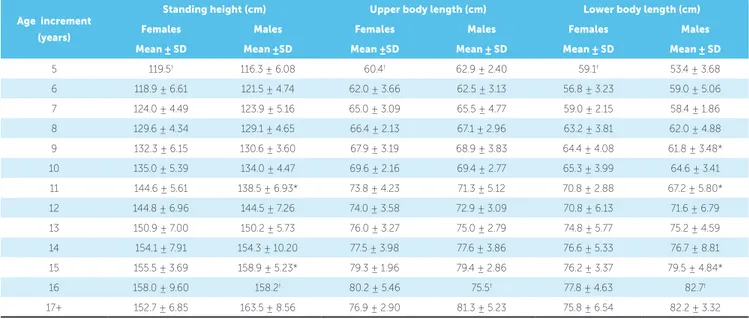
The skeletal ages of the sample using the GP method ranged from 5 to 17+ years old (Table 1). The mean skeletal ages were 11.6 ± 2.6 years for fe-males and 12.0 ± 2.3 years for fe-males. A breakdown of the skeletal ages by sex is depicted in Figure 1.
Table 2 presents the differences in standing height between males and females at various skeletal ages. A large difference between females and males was seen at skeletal age 11 (6.06 cm) and was statisti-cally significant (P=0.003) both at the nominal level of 0.05 and at the Bonferroni adjusted level of 0.01, based on tests for eight skeletal age groups with suf-ficient numbers of observations (30+) for reliable sta-tistical testing. A relatively large difference was also seen at age 15 (3.39 cm), but the finding was not statistically significant after adjustment (P=0.047). There was a general gradual increase in leg length for both sexes as skeletal age group increased. A sta-tistically significant difference of 2.62 cm was noted between females (64.38 cm) and males (61.76 cm) at age 9 (P=0.023). Similarly, the 3.56 cm difference at age 11 and 3.28 cm difference at age 15 (greater for males) were also statistically significant (P=0.026 and P=0.038, respectively). When the upper body length was measured, the largest difference between females and males was 2.5 cm at age 11. However this did not achieve statistical significance (P= 0.090).
Table 1 - Cross-tabulation of chronological and skeletal ages
Table 2 - Mean standing height, sitting height, and leg length per skeletal age increment.
* P<0.05; statistically significant difference between females and males using two tailed tests.
† One observation, standard deviation (SD) undefined.
Figure 1 - Percentages of subjects at various skeletal ages.
Skeletal age by year Total
up to 4.9 5 6 7 8 9 10 11 12 13 14 15 16 17+
Chronological age by year
16 2 2
15 2 10 16 22 6 3 59
14 2 2 19 28 17 5 3 1 77
13 1 1 7 18 20 3 2 1 53
12 3 2 26 20 11 62
11 1 6 17 19 4 1 1 1 1 51
10 1 8 25 18 7 1 60
9 2 17 25 5 5 54
8 3 6 7 6 2 3 1 1 29
Total 3 7 10 31 62 48 66 65 70 37 33 9 6 447
Age increment (years)
Standing height (cm) Upper body length (cm) Lower body length (cm)
Females Males Females Males Females Males
Mean ± SD Mean ±SD Mean ±SD Mean ± SD Mean ± SD Mean ± SD 5 119.5† 116.3 ± 6.08 60.4† 62.9 ± 2.40 59.1† 53.4 ± 3.68
6 118.9 ± 6.61 121.5 ± 4.74 62.0 ± 3.66 62.5 ± 3.13 56.8 ± 3.23 59.0 ± 5.06 7 124.0 ± 4.49 123.9 ± 5.16 65.0 ± 3.09 65.5 ± 4.77 59.0 ± 2.15 58.4 ± 1.86 8 129.6 ± 4.34 129.1 ± 4.65 66.4 ± 2.13 67.1 ± 2.96 63.2 ± 3.81 62.0 ± 4.88 9 132.3 ± 6.15 130.6 ± 3.60 67.9 ± 3.19 68.9 ± 3.83 64.4 ± 4.08 61.8 ± 3.48* 10 135.0 ± 5.39 134.0 ± 4.47 69.6 ± 2.16 69.4 ± 2.77 65.3 ± 3.99 64.6 ± 3.41 11 144.6 ± 5.61 138.5 ± 6.93* 73.8 ± 4.23 71.3 ± 5.12 70.8 ± 2.88 67.2 ± 5.80* 12 144.8 ± 6.96 144.5 ± 7.26 74.0 ± 3.58 72.9 ± 3.09 70.8 ± 6.13 71.6 ± 6.79 13 150.9 ± 7.00 150.2 ± 5.73 76.0 ± 3.27 75.0 ± 2.79 74.8 ± 5.77 75.2 ± 4.59 14 154.1 ± 7.91 154.3 ± 10.20 77.5 ± 3.98 77.6 ± 3.86 76.6 ± 5.33 76.7 ± 8.81 15 155.5 ± 3.69 158.9 ± 5.23* 79.3 ± 1.96 79.4 ± 2.86 76.2 ± 3.37 79.5 ± 4.84* 16 158.0 ± 9.60 158.2† 80.2 ± 5.46 75.5† 77.8 ± 4.63 82.7†
17+ 152.7 ± 6.85 163.5 ± 8.56 76.9 ± 2.90 81.3 ± 5.23 75.8 ± 6.54 82.2 ± 3.32
Skeletal age (years)
Per
centage o
f subjects
Female Male 25%
15%
5%
5 6 7 8 9 10 11 12 13 14 15 16 17+ 20%
10%
between females and male groups at the early ages (5, 6 and 7 years old) and older ages (17+), as well as differ-ences within the groups that represented as a decrease in maxillary length with increasing age. Nonetheless, these groups had very small representation and, as such, statistical testing was unreliable. The difference at age 10 however, showed statistical significance (4.27 mm, P=0.002). For mandibular length, a statistically sig-nificant difference was also seen at age 10 (3.86 mm, P=0.002). No other age groups demonstrated a signifi-cant difference between females and males. Results of the LAFH revealed a statistically significant difference of 2.60 mm at skeletal age 12 (P=0.041) at the nominal level of 5%, but not for the Bonferroni adjusted cut-off of 1%. The difference of 9.12 mm seen for the age group 17+ was also statistically significant (P=0.031), but the number of observations was too small for reli-able statistical testing.
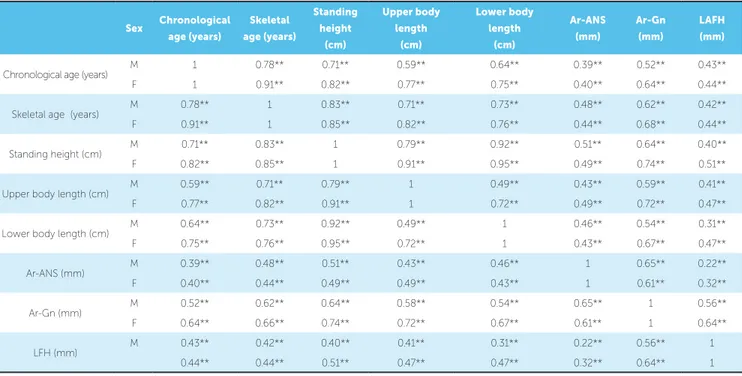
Results of the linear correlations between the skel-etal ages for females and males, the standing height, the upper and lower body lengths, and the craniofacial mea-surements are presented in Table 3. The correlation be-tween the skeletal ages and the chronological ages was stronger for females (r=0.91) than for males (r=0.78). Moderate correlations (r=0.42 to 0.68) were noted between the skeletal age and the craniofacial measure-ments. Similar correlations were also found between both, upper and lower body lengths, and the craniofacial measurements. Correlations of the mandibular length and lower facial height were stronger with the upper body length than with the lower body length.
Tables 4 and 5 present the stepwise multiple re-gression analyses with backward reduction. The mod-els suggested that sex, upper and lower body lengths might be used to predict maxillary length; while skeletal age, upper and lower body lengths might help predict mandibular length.
Figure 2 - Differences in maxillary lengths (Ar-ANS) at various skeletal ages.
Figure 4 - Differences in lower anterior facial heights at various skeletal ages.
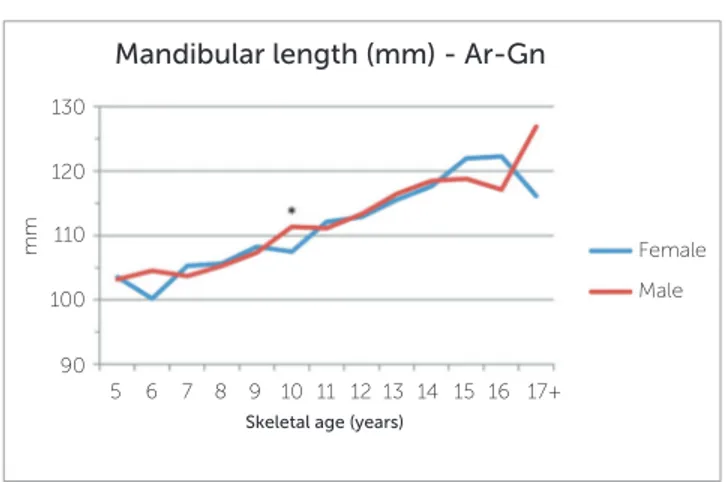
Figure 3 - Differences in mandibular lengths (Ar-Gn) at various skeletal ages.
Skeletal age (years)
Maxillary length (mm) - Ar-ANS
Female Male
5 7 10
70 80 90 100
mm
12 15
11 13 14 16 17+ 6 8 9
Skeletal age (years)
Lower anterior facial height (mm) - LAFH
Female Male
5 7 10
60 70
65 75 80
mm
12 15
11 13 14 16 17+ 6 8 9
Skeletal age (years)
Mandibular length (mm) - Ar-Gn
Female Male
5 7 10
90 110
100 120 130
mm
12 15
Sex Chronological age (years)
Skeletal age (years)
Standing height
(cm)
Upper body length
(cm)
Lower body length
(cm)
Ar-ANS (mm)
Ar-Gn (mm)
LAFH (mm)
Chronological age (years) M 1 0.78** 0.71** 0.59** 0.64** 0.39** 0.52** 0.43** F 1 0.91** 0.82** 0.77** 0.75** 0.40** 0.64** 0.44**
Skeletal age (years) M 0.78** 1 0.83** 0.71** 0.73** 0.48** 0.62** 0.42** F 0.91** 1 0.85** 0.82** 0.76** 0.44** 0.68** 0.44**
Standing height (cm) M 0.71** 0.83** 1 0.79** 0.92** 0.51** 0.64** 0.40** F 0.82** 0.85** 1 0.91** 0.95** 0.49** 0.74** 0.51**
Upper body length (cm) M 0.59** 0.71** 0.79** 1 0.49** 0.43** 0.59** 0.41** F 0.77** 0.82** 0.91** 1 0.72** 0.49** 0.72** 0.47**
Lower body length (cm) M 0.64** 0.73** 0.92** 0.49** 1 0.46** 0.54** 0.31** F 0.75** 0.76** 0.95** 0.72** 1 0.43** 0.67** 0.47**
Ar-ANS (mm) M 0.39** 0.48** 0.51** 0.43** 0.46** 1 0.65** 0.22** F 0.40** 0.44** 0.49** 0.49** 0.43** 1 0.61** 0.32**
Ar-Gn (mm) M 0.52** 0.62** 0.64** 0.58** 0.54** 0.65** 1 0.56** F 0.64** 0.66** 0.74** 0.72** 0.67** 0.61** 1 0.64**
LFH (mm) M 0.43** 0.42** 0.40** 0.41** 0.31** 0.22** 0.56** 1 0.44** 0.44** 0.51** 0.47** 0.47** 0.32** 0.64** 1
Table 3 - Pearson correlation coefficients (r) between skeletal maturational indicators and craniofacial measurements.
Table 4 - Stepwise multivariate linear regression with backward elimination for the association between maxillary length (Ar-ANS) and different growth indicators.
Table 5 - Stepwise multivariate linear regression with backward elimination for the association between mandibular length (Ar-Gn) and different growth indicators
** Correlation is significant at the 0.01 level (2-tailed). * Correlation is significant at the 0.05 level (2-tailed).
Variable β
Coefficient SE. Standardized β t P
95% CI
R2 Adjusted R2
Lower
limit Upper limit
Sex 1.07 0.48 0.09 2.22 0.027 0.12 2.01 0.27 0.26
Upper body length (cm) 0.28 0.07 0.26 4.00 <0.001 0.14 0.41
Lower body length (cm) 0.16 0.05 0.21 3.42 0.001 0.068 0.25
Variable β
Coefficient SE Standardized β t P
95% CI
R2 Adjusted R2
Lower limit
Upper limit
Skeletal age (years) 0.56 0.23 0.19 2.45 0.015 0.11 1.01 0.51 0.50
DISCUSSION
This study used the GP method to assess the skeletal ages of the subjects. The expected standard deviation of calculation errors in skeletal age as-sessments using the GP atlas is four to six months
and it is best employed in cross-sectional studies.18
Its strength lies in the relative ease with which radio-graphs may be placed relative to a set of standards.19 This study revealed statistically significant differ-ences in standing height between females and males at skeletal ages 11 and 15. Females showed high-er standing height than males at earlihigh-er age (skel-etal age 11; 6.06cm). At later age (skel(skel-etal age 15; 3.4cm), males surpassed females and became taller. These differences are in accordance with previous studies that showed that females experience an ear-lier pubertal growth spurt, then boys surpass girls at the older age.20,21
By eliminating the contribution of the lower body to standing height, the maximum upper body length was reached at more or less the time when the maximum standing height was attained, with no significant sexual dimorphism. A previous study used upper body length to predict standing height
in patients with leg deformities.9 The lower body
length, on the contrary, showed variability as com-pared to standing height and upper body length. Fe-males showed earlier lower body length spurts than males, at ages 9 and 11. All these findings may sug-gest that changes in upper body length may be more valid for predicting maturational growth spurt than changes in lower body length.
Overall, maxillary and mandibular lengths in-creased gradually with increasing skeletal age for both sexes. At skeletal age 10, however, males showed acceleration in growth of maxilla and man-dible, compared to females. The LAFH in the sam-ple of this study was greater than what has been re-ported for other racial groups. This relatively greater lower anterior facial dimension in the African black
children is in agreement with Jacobson,22 who noted
that South African blacks have increased mandibu-lar plane angles (SN-MP). The LAFH also showed some sexual dimorphism. Males had significantly greater LAFH than females at skeletal age 12. This is following the same trend observed for the maxilla and mandible, and in accordance with earlier studies
that concluded that males have more growth
incre-ment and duration, compared to females.6,23
Similar to previous studies,24,25 mandibular length in this study showed a statistically significant correla-tion with skeletal age in both females and males. Yet the clinical significance of this correlation might be ques-tioned. Individual variability may at least partially ex-plain this. The maxilla on the other hand showed a vari-able level of growth with increasing skeletal age. This can be explained by the fact that it undergoes growth at the sutures in addition to the remodeling of bones, which might put it under the control of other factors, in comparison to the mandible.24,26
When correlated with upper and lower body lengths, mandibular length showed a stronger correla-tion with the upper body length, compared to the lower body length. The upper body length includes both the head and the vertebral column lengths. Although cra-nial growth slows down after age 5, the head height and width have shown slight acceleration during growth spurt.27 Thus it is possible that the growth of the ver-tebral column is mainly responsible for the substantial acceleration during adolescence. The cervical verte-brae make the upper portion of the vertebral column. The cervical vertebral maturation (CVM) and its rela-tion with mandibular growth has long been suggested
in many earlier studies.25 However, the CVM method
has undergone criticism lately, due to its poor reliabil-ity and reproducibilreliabil-ity. Ball et al7 reported variability in the timing of each CVM stage, with the average time spent in stage 4 being 3.79 years. They concluded that the CVM on itself couldn’t consistently predict pre-pu-bertal or peak of mandibular growth. Future studies are needed to further understand the relationship between mandibular growth and sitting height.
pattern at age 14 and older, with males exceeding fe-males in values. Baccetti et al29 also showed that fe-males with Class III malocclusion exhibited shorter midfacial length (Co-Pt.A) than males at the pubertal and postpubertal age of 13 years and older.
For the mandibular prediction equation in the present study, the skeletal age, the upper and the lower body lengths were relatively similar strong con-tributors, while sex was not a contributor. Previous
studies30 indicated that sexual dimorphism was more
evident for the corpus size and velocity than the ra-mus height. Thus, the sexual dimorphism in the total mandibular length is less clear.
The results of this study cannot be generalized to other racial groups. Normal growth patterns of Afri-can black children are said to differ signifiAfri-cantly from those of Caucasian children.31,32 These ethnic differ-ences in growth appear to transcend family, social and economic backgrounds, since African black children from low income families grow faster and mature ear-lier than middle class white children.33
The cross-sectional data in this study did not al-low the estimation of mean velocity peaks in body lengths or craniofacial dimensions as it would be pos-sible with longitudinal studies34 nor was it set to de-termine cause and effect relationship. Previous stud-ies have shown that the onset of pubertal growth in the upper body length starts on average at 75 cm in females and 78 cm in males,10 and an increase of up to
84 cm indicates menarche in 80% of the females.10,35
Also at the onset of puberty, boys and girls have 14% (22.5 cm ± 1; made up by 13 to 9.5 cm upper to low-er body proportion) and 12% (20.5 cm ± 1; made up by 12 to 8.5 cm upper to lower body ratio) of their remaining standing height to grow. Therefore, it is recommended that future studies evaluate the growth changes and correlations prospectively. It is also worthwhile investigating longitudinally the associa-tion between the upper and lower body lengths with the mandibular ramus and corpus lengths, to increase our understanding of facial patterns of growth.
CONCLUSIONS
There were moderate correlations (r=0.42 to 0.68) between the three evaluated craniofacial mea-surements (Lower anterior facial height [ANS-Me]; mandibular unit length [Ar-Gn]; and maxillary unit length [Ar-ANS]) and skeletal age. The same mea-surements were also correlated (r=0.43 to 0.72) with the upper and lower body lengths. The mandibular length had a stronger correlation (r=0.58 in females and 0.72 in males) with the upper body length than with the lower body length.
1. Baccetti T, Franchi L, Toth LR, McNamara JA Jr. Treatment timing for Twin-block therapy. Am J Orthod Dentofacial Orthop. 2000 Aug;118(2):159-70. 2. Fishman IS. Maturational patterns and prediction during adolescence. Angle
Orthod. 1987 July;57(3):178-93.
3. Flores-Mir C, Burgess CA, Champney M, Jensen RJ, Pitcher MR, Major PW.
Correlation of skeletal maturation stages determined by cervical vertebrae and hand-wrist evaluations. Angle Orthod. 2006 Jan;76(1):1-5.
4. Hassel B, Farman AG. Skeletal maturation evaluation using cervical vertebrae. Am J Orthod Dentofacial Orthop. 1995 Jan;107(1):58-66.
5. Nayak S, Bhad Patil WA, Doshi UH. The relationship between salivary insulin-like growth factor I and quantitative cervical maturational stages of skeletal maturity. J Orthod. 2014 Sept;41(3):170-4.
6. Mellion ZJ, Behrents RG, Johnston LE Jr. The pattern of facial skeletal growth and its relationship to various common indexes of maturation. Am J Orthod Dentofacial Orthop. 2013 June;143(6):845-54.
7. Ball G, Woodside D, Tompson B, Hunter WS, Posluns J. Relationship between cervical vertebral maturation and mandibular growth. Am J Orthod Dentofacial Orthop. 2011 May;139(5):e455-61.
8. Tanner JM. Growth at adolescence. 2nd ed. Oxford: Blackwell Scientific; 1962.
9. Fredriks AM, Van Buuren S, Van Heel WJ, Dijkman-Neerincx RH,
Verloove-vanhorick SP, Wit JM. Nationwide age references for sitting height, leg length, and sitting height/height ratio, and their diagnostic value for disproportionate growth disorders. Arch Dis Child. 2005 Aug;90(8):807-12. 10. Dimeglio A. Growth in pediatric orthopaedics. J Pediatr Orthop. 2001
July-Aug;21(4):549-55.
11. Verma D, Peltomäki T, Jäger A. Reliability of growth prediction with hand-wrist radiographs. Eur J Orthod. 2009 Aug;31(4):438-42.
12. Cozza P, Stirpe G, Condó R, Donatelli M. Craniofacial and body growth: a cross-sectional anthropometric pilot study on children during prepubertal period. Eur J Paediatr Dent. 2005 June;6(2):90-6.
13. Preston CB. A cephalometric study of the development and morphology of the cranial base in a sample of black children [thesis]. Braamfontein: University of Witwatersrand; 1986.
14. Greulich WW, Pyle SI. Radiographic atlas of skeletal development of the hand and wrist. 2nd ed. Stanford: University Press Stanford; 1959.
15. McNamara JA Jr. A method of cephalometric evaluation. Am J Orthod. 1984 Dec;86(6):449-69.
16. Harvold EP. The activator in interceptive orthodontics. St Louis: C.V. Mosby; 1974. p. 9-26.
17. Evans JD. Straightforward statistics for the behavioral sciences. Pacific Grove, CA: Brooks/Cole; 1996.
18. Andersen E. Comparison of Tanner-Whitehouse and Greulich-Pyle methods in a large scale danish survey. Am J Phys Anthr. 1971;35(3):373-6.
19. Johnston FE. The use of the greulich-pyle method in a longitudinal growth study. Am J Phys Anthr. 1971;35(3):353-7.
REFERENCES
20. Taranger J, Hägg U. The timing and duration of adolescent growth. Acta Odontol Scand. 1980;38(1):57-67.
21. Malina RM, Bouchard C, Bar-Or O. Growth, maturation, and physical activity. 2nd ed. Champaign, IL: Human Kinetics; 2004.
22. Jacobson A. The craniofacial skeletal pattern of the South African negro. Am J Orthod. 1978 June;73(6):681-91.
23. Grave KC. Timing of facial growth: a study of relations with stature and ossification in the hand around puberty. Aust Orthod J. 1973;3:117-22. 24. Arat M, Koklu A, Ozdiler E, Rubenduz M, Erdogan B. Craniofacial growth and
skeletal maturation: a mixed longitudinal study. Eur J Orthod. 2001;23:355-61.
25. Baccetti T, Franchi I, Mcnamara J Jr. An improved version of the cervical vertebral maturation (CVM) method for the assessment of mandibular growth. Angle Orthod. 2002 Aug;72(4):316-23.
26. Björk A. Sutural growth of the upper face studied by the implant method. Acta Odontol Scand. 1966 Sept;24(2):109-27.
27. Shuttleworth FK. “The physical and mental growth of girls and boys age six to nineteen in relation to age at maximum growth monographs of the society for research in child development”. Monographs of the Society for Research in Child Development. JSTOR. 1939;4(3):i+iii+v-vi+1-291. 28. Ursi W, Trotman C, McNamara Jr J, Behrents RG. Sexual demorphism in
craniofacial growth. Angle Orthod. 1993;63(1):47-56.
29. Baccetti T, Reyes BC, McNamara JA Jr. Gender differences in Class III malocclusion. Angle Orthod. 2005;75(4):510-20.
30. Buschang PH, Tanguay R, Demirjian A, La Palme L, Goldstein H. Sexual dimorphism in mandibular growth of French-Canadian children 6 to 10 years of age. Am J Phys Anthropol. 1986 Sept;71(1):33-7.
31. Chen J, Hu H, Guo J, Liu Z, Liu R, Li F, et al. Correlation between dental maturity and cervical vertebral maturity. Oral Surg Oral Med Oral Pathol Oral Radiol Endod. 2010 Dec;110(6):777-83.
32. Barr GD, Allen cm, Shinefield HR. Height and weight of 7,500 children of three skin colors. Pediatric multiphasic program: report no. 3. Am J Dis Child. 1972 Dec;124(6):866-72.
33. Garn SM, Clark DC. Problems in the nutritional assessment of black individuals. Am J Public Health. 1976 Mar;66(3):262-7.
34. van der Beek MC, Hoeksma JB, Prahl-Andersen B. Vertical facial growth and statural growth in girls: a longitudinal comparison. Eur J Orthod. 1996 Dec;18(6):549-55.